bản tiến anh môn kế toán tài chính (MBM)
Bạn đang xem bản rút gọn của tài liệu. Xem và tải ngay bản đầy đủ của tài liệu tại đây (338.34 KB, 23 trang )
MÔN HC:
1
TRAINING PROGRAM
OF
GLOBAL ADVANCED MASTER OF BUSINESS
ADMINISTRATION
FINAL TEST OF
FINANCIAL ACCOUNTING
Lecturer: A.P Dr HA XUAN THACH
Student: NGUYEN DO THANH
TP. HCM 2012
TOPIC: ANALYSIS OF FINANCIAL ACCOUNTING
DOMESCO MEDICAL IMPORT-EXPORT JOINT STOCK
COMPANY
Comparison of financial statements between January 1st, 2010 with December 31
st
,
2010
DOMESCO MEDICAL IMPORT EXPORT JOINT STOCK
COMPANY
Address: No 66, Highway 30, My Phu Ward, Cao Lanh Ciy, Dong Thap Province.
BALANCE SHEET ACCOUNTING
On December 31
st
, 2010 Price unit: VND
Asset Code Descrip
tion
3 1 / 1 2 / 2 0 1 0 0 1 / 0 1 / 2 0 1 0
A. Short-term asset 100 404,658,371,352 344,665,015,631
I. Cash and cash equivalents
1. Cash
110
111
4.1, 5.1
22,821,815,791
22,821,815,791
32,635,944,465
32,635,944,465
II. Short-term investment
1. Short-term investment
2. Provision for devaluation of short-term investment
120
121
129
5.2
4.6
4.6
-
-
-
4,211,794,000
10,330,950,000
(6,119,156,000)
III. Short-term receivables
1. Receivables for customers
2. Advances for sellers
3. Other receivables
4. Provision for bad short-term debts
130
131
132
135
139
5.3
4.4
200,920,920,568
194,073,520,045
9,088,206,432
4,016,671,775
(6,257,477,684)
148,865,799,485
143,403,792,119
2,317,434,750
4,401,062,376
(1,256,489,760)
IV. Inventory
1. Inventory
140
141
4.3, 5.4 167,376,698,750
167,376,698,750
152,552,800,868
152,552,800,868
2
V. Other short-term assets
1. Short-term prepaid expenses
2. VAT deducted
3. Other short-term asset
150
151
152
158
5.5
5.6
13,538,936,243
3,569,235,062
3,006,508,826
6,963,192,355
6,398,676,813
1.663.871.449
1,476,763,421
3,258,041,943
B. Long-term asset
200
305,311,235,452 268.263.596.854
I. Fixed asset
1. Tangible fixed asset
- Original price
- Accumulated depreciation
2. Intangible fixed asset
- Original price
- Accumulated depreciation
3. Construction in progress
220
221
222
223
227
228
229
230
4.5, 5.7
4.5, 5.8
5.9
222,070,055,976
130,454,112,474
204,968,122,293
(74,514,009,819)
37,979,161,872
38,437,473,245
(458,311,373)
53,636,781,630
186,379,478,808
98,367,745,001
155,373,011,712
(57,005,266,711)
21,899,901,794
22,039,345,412
(139,443,618)
66,111,832,013
II. Long-term financial investment
1. Investment in associated company, joint venture
2. Long-term investment
3. Provision for devaluation of long-term financial
investment
250
252
258
259
4.6, 5.10
4.6, 5.11
4.6, 5.12
78,213,960,000
73,570,200,000
4,643,760,000
-
78,158,000,000
69,000,000,000
10,208,000,000
(1,050,000,000)
III. Other long-term asset
1. Long-term prepaid expenses
260
261 4.8, 5.13
5,027,219,476
5,027,219,476
3,726,118.046
3,726,118,046
Total assets
270 709,969,606,804 612,928,612,485
Capital
A. Liabilities 300 208,065,199,380 137,100,651,741
I. Short-term debt
1. Short-term loan and debt
2. Payables for seller
3. Deposit
4. Taxes and payables for the state
5. Payables for labor
6.Other short-term payables and receivables
310
311
312
313
314
315
319
5.14
5.15
5.16
192,916,685,483
70,819,739,361
72,396,892,281
8,783,936,312
19,083,402,707
16,885,274,946
4,947,439,876
135,460,967,942
33,720,226,995
65,310,106,908
14,120,070,708
9,272,558,518
9,685,308,104
3,352,696,709
II. Long-term debt
1. Other long-term payables
2. Long-term loans and debts
3. Provision for allowance of unemployment
330
333
334
336
5.17
5.18
4.9
15,148,513,897
3,417,660,752
11,541,101,700
189,751,445
1,639,683,799
1,485,288,063
-
154,395,736
3
B. Equity
400 4.10 501,904,407,424 475,827,960,744
I. Equity
1. Equity capital
2. Share premium
3. Treasury stock
4. Investment and development funds
5. Provision for financing
6. Retained earnings
410
411
412
414
417
418
420
5.19 497,252,696,252
178,093,360,000
229,275,000,000
(15,737,386,.415)
33,053,413,153
10,560,423.609
62,007,885,905
471,091,959,890
137,699,990,000
229,275,000,000
(10,925,191,085)
59,962,318,020
7,557,455,320
47,522,387,635
II. Other expenses and funds
Reward fund and welfare
430
431
5.20 4,651,711,172
4,651,711,172
4,736,000,854
4,736,000,854
Total capital
440 709,969,606,804 612,928,612,485
General Director
Huynh Trung Chanh
Chief Accountant
Pham Ngoc Tuyen
REPORT OF BUSINESS PERFORMANCE
On December 31
st
, 2010 Price unit: VND
Criteria Code Description 2010 2009
4
1. Sale revenue and service supply 01 4.11, 6.1 1,071,895,125,105 941,224,745,266
2. Revenue deductions 02 6.2 3,997,822,113 3,464,132,427
3. Net revenue from goods and service 10 6.3 1,067,897,302,992 937,760,612,893
4. Original price of goods sold and service 11 6.4 750,295,758,943 677,519,918,845
5. Gross profits from sales and services 20 317,601,544,049 260,240,693,994
6. Revenue from financial activities
7. Financial expenses
- In which: Cost of interest
8. Cost of sale
9. Cost of business management
21
22
23
24
25
4.11, 6.5
4.12, 6.6
4.7
6.7
6.8
7,410,029,139
6,714,971,345
5,153,557,779
120,152,210,215
93,890,709,242
9,839,072,775
27,629,845,448
4,909,839,189
92,538,541,721
75,631,093,830
10. Net profit from business operation 30 104,253,682,386 74,280,285,770
11. Other income
12. Other expense
31
332
6.9
6.10
12,973,462,864
5,039,081,288
235,763,868
21,948,932
13. Other profit 40 7,934,381,576 213,814,936
14. Pretax profit 50 112,188,063,962 74,494,100,706
15.Current tax expense
16. Deferred tax
51
52
4.13, 6.11 35,825,597,903
-
11,688,745,821
-
17. Profit after tax 60 76,362,466,059 62,805,354,885
18. Basic interest per share 70 6.12 4,349 4,563
General Director
Huynh Trung Chanh
Chief Accountant
Pham Ngoc Tuyen
5
CASH FLOW STATEMENT
On December 31
st
, 2010 Price unit : VND
Criteria Co
de
2 0 1 0 2009
Cash flow from business operation
Pre-tax profit
Adjustment for items
Depreciation of fixed asset
Provisions
Unrealized (interest)/loss of exchange rate difference
(interest)/loss from investment activities
Cost of interest
Profit from business operation before change
Floating capital
(increase)/decrease receivables
Increase )/decrease inventory
Increase /decrease) payables
Increase )/decrease prepaid expenses
Interest paid on loan
Business tax paid
Other receivables from business operation
Other receivables from business operation
Net cash flow from business operation
Net cash flow from investment activities
Payables for purchase, build fixed asset and other long-term
asset
Receivables from liquidation, sale of fixed assets and other
long-term asset
Cash for borrow, purchase of debt instruments of other entities
Proceeds from loans, sale of debt instruments of other entities
Payments for investment, capital contribution to other entities
Proceeds from loans, dividends and divided profits
Net Cash flow from investment activities
Cash flow from financial activities
Payments for capital contribution for owners, acquisition of
released business share
Short-term, long-term loans receivable
Payments for the original loan
Dividend, profit payable for owners
Net cash flow from financial
Net cash flow in term
Cash and cash equivalents in beginning of the term
The influence of the change of exchange rates for foreign
currency exchange
Cash and cash equivalents at the end of the term
01
02
03
04
05
06
08
09
10
11
12
13
14
15
16
20
21
22
23
24
25
27
30
32
33
34
36
40
50
60
61
70
112,188,063,962
18,054,891,706
(2,168,168,076)
569,969,388
(7,019,180,251)
5,153,557,779
126,779,134,508
(62,291,004,824)
(14,823,897,882)
(950,473,465)
(3,196,731,043)
(5,097,695,767)
(25,095,660,054)
2,613,460,864
(12,439,696,241)
5,497,436,096
(54,917,211,311)
12,818,681,818
(295,860,000)
11,919,147,100
(4,570,200,000)
3,509,886,275
(31,535,556,118)
(4,812,195,330)
193,531,731,169
(144,891,117,103)
(27,034,458,000)
16,793,960,736
(9,244,159,286)
32,635,944,465
569,969,388
22,821,815,791
74,494,100,706
15,729,744,537
6,221,127,406
(68,176,168)
5,513,125,377
4,909,839,189
106,799,761,047
(21,910,037,908)
60,205,540,001
(43,530,715,255)
(302,865,195)
(4,909,839,189)
(6,047,866,901)
1,735,342,500
(13,246,978,420)
78.792.340.680
(68,930,412,927)
13,890,909
(15,667,725,402)
10,998,123,100
(60,000,000,000)
2,809,320,961
(130,776,803,359)
(10,925,191,085)
92,357,545,565
(61,472,902,565)
(27,407,198,000)
(7,447,746,085)
(59,432,208,764)
91,999,977,061
68,176,168
32,635,944,465
General Director
Huynh Trung Chanh
Chief Accountant
Pham Ngoc Tuyen
6
I. Financial statement analysis:
In general meaning, financial statement analysis mentions the art of analysis
and the explanation of financial statements. It applies tool and analytical technique
to financial statements and relevant documents in order to draw useful estimations
and conclusions for business decisions. It is a selective tool to chose “candidates”
for investment or merger. It is also a tool to foresee conditions and consequences of
the finance in the future
Financial statement analysis is a diagnostic device when it assesses
operations of investment, finance and business. It is used to evaluate management
and other business decision .
Financial statement analysis is not only a calculation process of numbers but
also a process of review, examination, collation and comparison of current financial
result of the company between the present with the past in order to evaluate the
financial situation of the company, what the company have done exactly, and
obtain the potentials, expect what things will happen and then suggest methods in
order to take full advantage of the strength and overcome the weakness.
On the other hand, it is necessary for financial statement analysis to make
above these data can “speak” in order for users to understand clearly financial
situation of the business and the objective, plan of managers of such businesses
The purpose of financial statement analysis is to provide the useful
information for investors, creditors and other users to make their own decisions
about investment, credit and similar decision. The information needs to be easy to
understand for those who want to research these information but they have relative
level on business and economic activities. At the same time it helps investors,
creditors and other users assess the quantity, time and risk of receivables from
dividend or cash
7
II. Analysis of account balance of DOMESCO company
Every year, most of people come to the doctor to check their overall health - a physical condition
check-up at a certain time. Similarly, balance sheet of accounting is an integrated financial situation of
the companies at a certain time, usually the end of the month, quarter or ending of fiscal year.
In fact, the balance sheet shows the assets are managed by the company and providing funds for
these assets - by using capital of those who granting loans (liabilities), capital contributed from owners,
or from both sources. The balance sheet is reflected in the two following accounting equation: Assets =
Liabilities + Equity
Table of figure analysis of account balance
Using 01/01/ 2010 (2009) as original basis to compare and analyze finance of 2009 and 2010.
Target Cod
e
2010 2009 Amount Ratio
ASSETS
Short term assets 100 404,658,371,352 344,665,015,631 59,993,355,721 0.174
Cash and relevant amounts 110 22,821,815,791 32,635,944,465 -9,814,128,674 -0.301
Amounts for short term financial
investment
120 - 4,211,794,000 - -
Short term receivable accounts 130 200,920,920,568 148,865,799,485 52,055,121,083 0.350
Inventory 140 167,376,698,750 152,552,800,868 14,823,897,882 0.097
Short term assets 150 13,538,936,243 6,398,676,813 7,140,259,430 1,116
Long term assets 200 305,311,235,452 268,263,596,854 37,047,638,598 0.138
Fixed assets 220 222,070,055,976 186,379,478,808 35,690,577,168 0.191
Amounts for long term financial
investment
250 78,213,960,000 78,158,000,000 55,960,000 0.001
Other long term assets 260 5,027,219,476 3,726,118,046 1,301,101,430 0.349
Total Assets 270 709,969,606,804 612,928,612,485 97,040,994,319 0.158
SOURCE OF CAPITAL
Liabilities 300 208,065,199,380 137,100,651,741 70,964,547,639 0.518
Short term liability 310 192,916,685,483 135,460,967,942 57,455,717,541 0.424
Long term liability 330 15,148,513,897 1,639,683,799 13,508,830,098 8.239
Owner’s capital 400 501,904,407,424 475,827,960,744 26,076,446,680 0.055
Owner’s capital 410 497,252,696,252 471,091,959,890 26,160,736,362 0.056
Other expenses 430 4,651,711,172 4,736,000,854 -84,289,682 -0.018
Total source of capital 440 709,969,606,804 612,928,612,485 97,040,994,319 0.158
Horizontal analysis
8
The assets : Current assets in 2010 increased 17.4% of VND 59,993,355,721 respectively compared to
original year 2009 is 100%. Cash and amounts similar to cash decreased 30.1% compared with original
year 2009. Meanwhile, short term accounts receivable increased 35% in 2010, inventories increased 9.7%
in 2010; other short term assets also increased 111.6% compared to original year 2010 is 100%. It shows
that the main field of the company is production and trade.
Fixed assets increased by 19.1% in 2010, equivalent to VND 35,690,577,168 compared to original year
2009 is 100%. Long-term financial investment barely increased, just increased 0.1% in 2010 and other
long term assets increased 34.9% in 2010 compared to original year 2009 is 100%. This demonstrates that
the company is interested in expanding business activities to strengthen competition in the marketplace.
The capital source : In 2010, liabilities increased 51.8% , equivalent to VND 70,964,547,639 compared to
original year 2009 of 100% because short-term and long-term liabilities all increased. It shows that
the company increased business scale by using short-term funds. Owner’s capital increased 5.5%
equivalent to VND 26,076,446,680 in 2010 compared to original year 2009 is 100%. This proves
business result is effective.
II. Analysis of table of business activities report of DOMESCO company:
The report of business results, also known as interests/ loss report reflects the status and results
of business activities as well as the implementation of responsibilities and obligations of the enterprises
toward the State in an accounting period.
Through the targets of report of business results, we can check, analyze and evaluate the status
of implementation of the plan, estimate the cost of production, cost price, product sales, material
consumption, situation of cost and income of other activities and business results after an accounting
period.
Through data of report of business result, we can check the status of implementation of responsibilities
and obligations of the enterprises toward the State and other taxes and other payables.
Through the report of results of business operations, we can assess the trend of enterprise
development in the future.
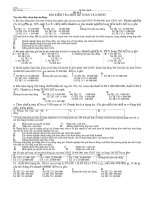
Analysis of figures of report of business result
Using 01/01/ 2010 (2009) as original basis to compare, analyze finance of 2009 and 2010.
9
10
11
Based on above analysis table, the business situation of DOMESCO company has profit after
tax of VND 76,362,466,059 ,increasing 21.59% compared to original year 2009. This is a good sign
shows that company works rather highly effectively.
III. Analysis of table of flow of cash of DOMESCO company
Based on current accounting regime, the cash flow statements is not mandatory financial report.
It is only guidelines. Thus the state should soon force the enterprises to make report of cash flow
when presenting the financial information to the subjetcs for the following reasons:
Currently, investors, lenders, suppliers, managers, etc including the State concern about the
financial situation of the business and events, the economic transactions that affect financial status of the
Target Cod
e
2010 2009 Amount Rate
1. Revenue of sales and service supplement 01 1,071,895,125,105 941,224,745,266 130,670,379,839 0.1381
2. Discount amounts of revenue 02 3,997,822,113 3,464,132,427 533,689,868 0.1541
3. Net revenue from goods and services 10 1,067,897,302,992 937,760,612,893 130,136,690,099 0.1387
4. Cost price for goods and services 11 750,295,758,943 677,519,918,845 72,775,840,098 0.1074
5. Total profit from sales and service supplement 20 317,601,544,049 260,240,693,994 57,360,850,055 0.2204
6. Revenue from financial activities
7. Financial expenses
- Including: Loan interest cost
8. Sales cost
9. Business management cost
21
22
23
24
25
7,410,029,139
6,714,971,345
5,153,557,779
120,152,210,215
93,890,709,242
9,839,072,775
27,629,845,448
4,909,839,189
92,538,541,721
75,631,093,830
-2,429,043,636
-20,914,874,103
243,718,590
27,613,668,494
18,259,615,412
-0.2469
-0.7570
0.0496
0.2984
0.2414
10. Net profit from business activities 30 104,253,682,386 74,280,285,770 29,973,396,616 0.4035
11. Other income
12. Other costs
31
332
12,973,462,864
5,039,081,288
235,763,868
21,948,932
12,737,698,996
5,017,132,356
54,0273
228,207
7
13. Other profit 40 7,934,381,576 213,814,936 7,720,566,640 36,1086
14. Total accounting profit before tax 50 112,188,063,962 74,494,100,706 37,693,963,256 0.5060
15. Expense of current enterprise income tax
16. expense of deferred enterprise income tax
51
52
35,825,597,903
-
11,688,745,821
-
24,136,852,082
-
2,0650
-
17. Profit after enterprise income tax 60 76,362,466,059 62,805,354,885 13,557,111,174 0.2159
18. Basic profit of stock 70 4,349 4,563 -0.214 0.0469
12
enterprises. Investors and managers want to know if the enterprises have enough cash to meet the
business opportunity or not, potentially dominant in the new business opportunities arise or not? Lenders
want to know whether the business can repay the loan on time or not?
Therefore, financial information of business can help the enterprises make their economic
decisions. To meet that requirement, enterprises must prepare a financial report with integrated- specific
content about money flow into the business as well as the money flow out of its in an certain
accounting period.
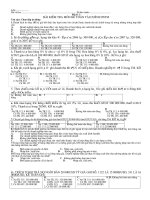
Analysis of figures of table of money flow
Using 01/01/ 2010 ( 2009) as original basis to compare , analyze finance of 2009 and 2010.
13
TARGET code 2010 2009 Amount Ratio
I. Flow of money from business activities
Profit before tax
Adjustment for accounts
Depreciation of fixed assets
Provision amounts
(Interests)/loss difference of exchange rate has not
implemented
(Profit)/loss from investment activity
Cost of loan interest
Profit from business activity before change
Floating capital
(Increase)/ decrease in accounts receivable
Increase)/ decrease in inventory
Increase)/ decrease in accounts payable các khoản phải
trả
Increase)/ decrease in cost paid in advance
Loan interest had been paid
Enterprise income tax has been paid
Other income from business activity
Other income from business activity
Flow of net amount from business activity
II. Flow of money from investment activity
01
02
03
04
05
06
08
09
10
11
12
13
14
15
16
20
21
22
23
112,188,063,962
18,054,891,706
(2,168,168,076)
569,969,388
(7,019,180,251)
5,153,557,779
126,779,134,508
(62,291,004,824)
(14,823,897,882)
(950,473,465)
(3,196,731,043)
(5,097,695,767)
(25,095,660,054)
2,613,460,864
(12,439,696,241)
5,497,436,096
(54,917,211,311)
12,818,681,818
(295,860,000)
74,494,100,706
15,729,744,537
6,221,127,406
(68,176,168)
5,513,125,377
4,909,839,189
106,799,761,047
(21,910,037,908)
60,205,540,001
(43,530,715,255)
(302,865,195)
(4,909,839,189)
(6,047,866,901)
1,735,342,500
(13,246,978,420)
78.792.340.680
(68,930,412,927)
13,890,909
(15,667,725,402)
37,693,963,256
2,325,147,169
-4,052,959,330
501,793,220
1,506,054,874
243,718,590
19,979,373,461
40,380,966,916
-45,381,642,119
-42,580,241,790
2,893,865,848
187,856,578
19,047,793,153
878,118,364
-807,282,179
-73,294,904,584
-14,013,201,616
12,804,790,909
-15,371,865,402
0.5060
0.1478
-0.6515
7,3604
0.2732
0.0496
0.1871
1,8430
-0.7538
0.9781
9,5550
0.0383
3,1495
0.5060
0.0609
-0.9302
-0.2033
921,8109
-0.9811
14
Expense for purchasing, building fixed assets and other
long term assets
Income from liquidation, transfer of fixed assets and
other long term assets
Amount of money for loan, purchasing debt instruments
of other units
Amount of money from granting loan, selling debt
instruments to other units
Expense for investement, distribution of capital to other
units
Amount of money from granting loan interest, dividend
and profit divided
Flow of net money from investment activity
III. Flow of money from financial activity
Amount for paying capital distribution to owners,
buying shares of the enterprises issued. Short term-long
term loan
Amount for paying loan debt
Dividend, profit paid to owners
Flow of net amount from financial activity
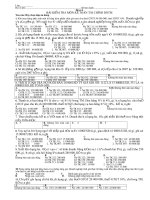
IV. Flow of net amount of money in the
period
Money and relevant money of the beginning of the
period
24
25
27
30
32
33
34
36
40
50
60
61
70
11,919,147,100
(4,570,200,000)
3,509,886,275
(31,535,556,118)
(4,812,195,330)
193,531,731,169
(144,891,117,103
)
(27,034,458,000)
16,793,960,736
(9,244,159,286)
32,635,944,465
569,969,388
22,821,815,791
10,998,123,100
(60,000,000,000)
2,809,320,961
(130,776,803,359)
(10,925,191,085)
92,357,545,565
(61,472,902,565)
(27,407,198,000)
(7,447,746,085)
(59,432,208,764)
91,999,977,061
68,176,168
32,635,944,465
921,024,000
-55,429,800,000
700,565,314
-99,241,247,241
-6,112,995,755
101,174,185,604
83,418,214,538
-372,740,000
9,346,214,651
-50,188,049,478
-59,364,032,596
501,793,220
-9,814,128,674
0.0837
-0.9238
0.2494
-0.7589
-0.5595
1,0955
1,3570
0.0136
1,2550
-0.8445
-0.6453
7,3602
0.3007
15
Influence of change in exchange rate of foreign
currency
Money and relevant money of the ending of the period
16
General evaluation of the financial situation of DOMESCO company through report of cash
flows. Firstly, we need to evaluate the difference between revenues and expenses from business
activities: in 2009, VND 497,436,096 , company’s revenue is greater than its expenses, original
year 2009 VND 78,792,340,680 company’s revenues is more than expenses. Compared with 2009, in
2010 the company’s expense is greater its turnover, approximate of 93.02% compared to those of
2009.
Net cash flows from negative investment activities shows that , the scale investment of
DOMESCO is increasingly greater. Since this is the result of investment in purchasing fixed assets,
other assets, granting loans - buying the debt instruments of other entities, costs of investments in
other entities.
Net cash flow from financial activities, original year 2010 received external funding with a
total of VND 16,793,960,736 and the Company may be dependent on external financial supporters.
Thus, the financial situation of DOMESCO is generally stable, with the investment in scale
expansion , while also paying dividends to the owners and purchasing shares.
V. Analysis financial status of DOMESCO company through coefficients:
1. Coefficients reflect the capability of payment.
Fast solvency coefficient: current solvency coefficient current does not reveal all the solvency of the
business. Investors, lenders always raise the question : If all the short-term debt is required :
Current solvency coefficient : The relationship between Working assets ( TSLĐ) and short-term
investments with short term liabilities. It demonstrates the ability to convert assets into cash in a short
period of time (<1 year) to ensure the solvency of short term liabilities.
Ht
2010
= ( Working assets + short term investment assets) / short term liability
= 404,658,371,352 / 192,916,685,483 = 2.098
Ht
2009
= ( Working assets + short term investment) / short term liability
= 344,665,015,631 / 135,460,967,942 = 2.544
Thus, the solvency of DOMESCO company was very great in 2009 (2.544).It reduced slightly in
2010 (2.098) but it was still very large. However, the fact that Ht was too high is not good. Because
there was an amount of money (or TSLD) was preserved too much with of slow working capital
rotation speed . Current assets are preserved too much large reflects the inefficient use of capital.
Can financial capacity of enterprises meet immediate payment? Study of the possibility of fast
payment will answer this question.
Hn
2010
= Money and relevant amounts of money / Short term debts
= (22,821,815,791 + 200,920,920,568) / 192,916,685,483
15
= 1.160
Hn
2009
= Money and relevant amounts of money / Short term debts
= (32,635,944,465+ 4,211,794,000+ 148,865,799,485) / 135,460,967,942
= 1.371
Thus, the solvency of DOMESCO company was pretty good in 2010 (1.160), higher than in
2009 (1371). Generally this ratio varied from 0.5 - 1 is normal, but we should pay attention to:
business report of the enterprise and structure of floating assets as well as method of payment that
customers enjoy. Experience shows that if Hn <0.5, the enterprise will certainly have difficulty in
paying the debt.
2. Group of coefficient reflects financial structure and investment situation
Debt ratio:. Debt Ratio: The people who analyze the financial statements are always interested in the
assets of the business acquired from sources of owners and assets acquired from borrowing. It
compares the contribution of capital of business owners to debt from loan. Creditor enjoy
moderate debt ratio , because low debt ratio, safety coefficient of creditors will be high, their debt
will be more guaranteed. In contrast, one part of the business risks of the business is transferred to
creditors .
Debt ratio
2010
= (liability / Total of source of capital) x 100%
The ratio of debt
2010
= (Liabilities / Total capital) x 100%
= (208.065.199.380 / 709.969.606.804) x 100% = 29.31%
The ratio of debt
2009
= (Liabilities / Total capital) x 100%
= (137.100.651.741/ 612.928.612.485) x 100% = 22.37%
In contrast to debt ratio is the ratio of self-funded:
Self-funded ratio
2009
= Sources of equity / Total capital = 100% - The ratio of debt
= 100% - 29.31% = 70.69%
Self-funded ratio
2008
= Sources of equity / Total capital = 100% - The ratio of debt
= 100% - 22.37% = 77.63%
DOMESCO had the ratio of debt in 2010 (29.31%) higher than in 2009
(22.37%), that is relatively low, but since the total capital of 2010 was higher than in
2009, so that is reasonable. This proved that the source of equity contributing to the
16
formation of assets of the company was high. However, if the profit rate was lower
than the interest of loans, the internal funding was reasonable.
Investment ratio: Reflecting the important position of fixed assets in the companies.
The higher it is, the larger the degree of importance of fixed assets is. But we need to
examine industries traded by the companies.
Investment ratio
2010
= Fixed assets and long-term investment / Total assets
= (222.070.055.976 + 78.213.960.000) / 709.969.606.804 = 42.30%
Investment ratio
2009
= Fixed assets and long-term investment / Total assets
= (186.379.478.808+ 78.158.000.000) / 612.928.612.485 = 43.16%
DOMESCO was interested in fixed asset investment to increase its existing
capacity.
17
Rate funding fixed assets: Indicating how the level of equipment of fixed assets
funded by the owner is? This also allows the assessment of safety of finance when
investing in fixed assets. A company with has a strong financial situation, the ratio is
usually > 1. One of the principles of management is to use long-term source of funding
for long-term use. Therefore, it will be risky to borrow short-term loan for purchasing
fixed assets.
Investment ratio
2010
= Sources of equity / Fixed assets and long-term investment
= 501.904.407.424 / (222.070.055.976 + 78.213.960.000) = 1.67
Investment ratio
2009
= Sources of equity / Fixed assets and long-term investment
= 475.827.960.744 / (186.379.478.808+ 78.158.000.000) = 1.799
The yearly investment ratio are greater than 1 (1.67-1.799), this proves that the
financial capability of DOMESCO is stable and healthy.
3. Ratios reflecting operation capability.
Inventory turnover: Inventory is a reserve asset for the purpose that business processes
are conducted regularly, continuously and supply demands of the market. This
indicates that the average of turns of inventory, the greater it is, the more quickly the
speed of rotation of inventory is, the number of days of storage decrease and the
efficiency of capital usage is enhanced or in contrast.
Rotation of inventory
2010 – 2009
= The value of goods sold / Average balance of
inventories = 750.295.758.943 / 159.964.749.809 = 4.69 rounds
Average balance of inventories = Inventory (Beginning of period + ending of period) /
2
= (167.376.698.750+152.552.800.868) / 2
= 159.964.749.809
Days of inventory = Days in the period / Inventory turnover
= 360 / 4.69 = 76.76 days
This shows that the inventory turnover is 4.69 rotations and the days of inventory is
76.76 days long. This proves that the company trades specialized goods.
Turnover of receivable accounts: Receivable accounts are an integral part of saved
working capital in the payment period. If shortening this process, not only speeding up
the flow of working capital but also reducing the risk of payment process.
18
Turnover of receivable accounts
2010 – 2009
= Net income / Balance of receivable accounts
(beginning of period + ending of period) / 2 = 1.067.897.302.992 / (200.920.920.568 +
148.865.799.485) / 2
= 6.11 rounds
The period of average collection = Days of period / Turnover of receivable accounts
= 360 / 6.11 = 58.92 days
So switching speed of receivable into cash of DOMESCO is 6.11 relative rapid.
Working capital cycle: Working capital is moving through different forms. Firstly, it is
capital in cash -> production reserve capital -> production capital -> capital in payment
and cash funds. When collecting money, it ends a cycle. The faster working capital
demonstrates, the more efficient the capital usage is and in contrast.
Rotations of working capital cycle
2010 – 2009
= Net income / The average balance of
working capital (beginning of period + ending of period)/2 = 1.067.897.302.992 /
(404.658.371.352 + 344.665.015.631)/2
= 1.42 rounds
Days of working capital rotation = Days of period / Rotations of working capital
= 360 / 1.42 = 253.52 days
Thus, the capital of DOMESCO in 2010 turned 1.42 rounds and turned per
round 253.52 days.
Efficiency of property usage: This business process ultimately is the profit-seeking
process. In order to achieve maximum profit in the able conditions and scope, the
company has to use thoroughly the assets of the business process to save capital. The
efficiency of property usage will show the benefit when using a dong of assets
involving in the business process creating how much net income or profit? The greater
it is, the higher efficiency of assets usage is or in contrast.
Efficiency of property usage
2010 – 2009
= Net income / Assets (beginning of period +
ending of period) /2
= 1.067.897.302.992 / (709.969.606.804 + 612.928.612.485) /2 = 0.813
This proves that on average, a copper of property involving in the business process
will create 0.813 in 2010.
19
Indexes reflect the profitability: The greater indicators are, the higher profitability is.
Profit on sales: shows that 100 dongs will create how much profit
Profit on sales
2010
= Profit /Net income = 104.253.682.386/ 1.067.897.302.992
= 9.76 %
Profit rate on capital: shows that on average, 100 dongs of capital involving in
business operation will create how much net profit (or gross profit ) ?
Profit rate on capital
2010 - 2009
= Profit / Average value of assets
= 104.253.682.386 / (709.969.606.804 + 612.928.612.485) /2 = 15.88 %
Rate of profit on equity: Shows that on average, 100 dongs spent on business will
create how much gross profit?
Rate of profit on equity
2010 – 2009
= Profit / Average equity
= 104.253.682.386 / (501.904.407.424 + 475.827.960.744) /2 = 21.33 %
This calculation indicates that: 100 dongs in net revenue with 9.76 dongs of
profit. DOMESCO used 100 dongs of capital for the business process gained 15.88
dongs of profit and the owner would profit 21.33 of dongs profit in 2010.
C. Conclusion.
Overall, the business of DOMESCO is good. Benefits brought to the owner in
2010 was higher 21.33%, although in 2010, we were still affected by the economic
crisis, the index of financial statements showed that the business of the company
remained positively.
References
1. Financial Accounting Curriculum.
2. Financial statement information of DOMESCO medical import-export
company.
3. Finance for Managers – First News and HCM City Tong hop Publisher.
20
4. />%E1%BA%A3_kinh_doanh
5.
6. />bai-giai-m11i27797.html
21