Growth and transmission electron microscopy studies of nanomaterials 3 4
Bạn đang xem bản rút gọn của tài liệu. Xem và tải ngay bản đầy đủ của tài liệu tại đây (5.07 MB, 72 trang )
Chapter 3 Growth of boron nitride nanostructural materials
56
Chapter 3 Growth of boron nitride nanostructural
materials
In this chapter, the nucleation and growth of boron nitride nanomaterials in
microwave plasma enhanced CVD system and in-situ TEM is presented in detail.
3.1 Introduction
The growth chemistry and atomic structure of BN nanostructures have
attracted much attention because the wide band gap exhibited by BN suggests
interesting applications in novel UV lasers and low-k materials [1-3]. Following the
discovery of the carbon nanotube by Iijima [4], similar structures have been
proposed and discovered for BN [5]. Compared with the carbon nanotubes, BN
nanotubes have been predicted to display a bandgap of roughly 5.5 eV, independent
of their chirality together with high ultimate strength and oxidation resistance [5, 6].
Thermal stability and oxidation resistance make BN a suitable material to store and
protect some air-sensitive metals inside, such as pure Co and Fe [7].
3.2 Motivation
BN nanotubes have been synthesized by a range of methods from arc
discharge [8, 9], chemical vapor deposition [10, 11] to solid-state ball milling
methods followed by annealing at high temperature [12, 13]. Non-catalytic growth
Chapter 3 Growth of boron nitride nanostructural materials
57
methods have also been demonstrated [14-16]. Compared with the growth condition
required for carbon nanotubes, most of these methods require thermal conditions
higher than 1200 ˚C and the yield of BN nanomaterials is often low. The growth
temperatures required for BN synthesis are often too high to be compatible with
microelectronic processing on conventional semiconductor substrates. Hence, the
properties and technological applications of BN nanotubes, nanowires and
nanospheres have not been fully investigated due to the lack of these materials in
sufficient quantity.
Narita and Oku [17-19] have studied the arc-melting of a sequence of borides
such as TiB
2
, VB
2
, NbB
2
, LaB
6
for the production of BN nanocapsules and
nanotubes. The formation enthalpies of BN from the respective borides were
considered as the key factor in catalyst design. However another important factor is
the composition of the boride phase in the design of the catalyst, since this will
influence the eutectic melting point. A lower eutectic melting point will promote the
ready formation of a molten phase to initiate the VLS mechanism [20], thus
allowing the phase segregation of BN nanomaterials at lower temperatures.
However, the direct plasma nitridation of iron borides at moderately low
temperatures, i.e. <1000 ˚C, for the growth of BN nanomaterials has not been
demonstrated. The growth of metal encapsulated BN nanoparticles is more difficult
due to the lack of a reactive BN-precursor.
Chapter 3 Growth of boron nitride nanostructural materials
58
The growth of metal encapsulated nanomaterials, where the outer sheath
consists of an inert coating to prevent the oxidation of the inner metal nanoclusters,
offers important technological applications in ferromagnetism and quantum devices.
Interesting host-guest chemistry or supra-atom properties may be exhibited by
metallo-fullerene type structures where a metal atom is inserted in the center of the
BN nano-sphere [21]. BN nanotubes may also act as a sheath encapsulating metal
nanowire, forming an interesting insulator-metal structure. A recent study of BN
nanocage-encapsulated cobalt nanopaticles showed ferromagnetic properties [8].
Cobalt nanoparticles encapsulated in carbon shells have been synthesized by
catalytic chemical vapor deposition with high yield by reducing Mg
0.9
Co
0.1
O solid
solution-impregnated MgO catalyst with a H
2
/CH
4
mixture. Magnetic measurements
confirmed that carbon-encapsulated Co nanoparticles were protected against
oxidation and remained metallic. Fe-based films are the logical choice for next
generation magnetic record heads because pure Fe has a magnetization of 1710
emu/cc. Encapsulating the iron, or reacting with nitrogen to produce ultrafine grain
sizes is an effective means of obtaining films with low coercivity and high
permeability. It has been suggested that the 2D organization of such magnetic
nanoparticles could be a step forward in the realization of high-density recording
media.
In this work, we report the nucleation and growth of various BN
Chapter 3 Growth of boron nitride nanostructural materials
59
nanomaterials using the heterogeneous reaction between ammonia and iron boride
particles in order to prepare BN nanomaterials at temperatures lower than 1000 ˚C.
NH
3
or nitrogen is the single source to provide nitrogen to react with boron evolved
from FeB particles. We also directly observe the process of formation of a BN
encapsulated metal nanoparticle for the first time by performing in-situ TEM at high
vacuum in order to get insight into the growth mechanism of BN nanomaterials.
3.3 Experiment
Reactive FeB nanoparticles [22, 23] were prepared by ball-milling water-free
FeCl
3
and NaBH
4
powders (1:3.3 mole ratio) for 8 hours, followed by annealing in
an Ar atmosphere at 500 ˚C for 3 hours.
In the series of ex-situ TEM studies, samples were prepared by casting FeB
nanoparticles onto Si (100) wafers, where were then introduced into the
MW-PECVD system. The sample was heated to 850 ˚C during plasma treatment.
The gaseous precursor consisted of a mixture of N
2
:H
2
in a volumetric flow ratio of
3:1 at a pressure of 20 torr. The microwave power was maintained at 350 W. The
product was scraped off the Si substrate, ultrasonically cleaned in ethanol, and then
cast onto a Cu grid for observation with a Phillips CM300 TEM.
For direct in-situ TEM observation, detailed information on sample
preparation was given in chapter 2.1.4. Ammonia gas was admitted into the TEM
Chapter 3 Growth of boron nitride nanostructural materials
60
column through a leak valve. The in-situ TEM has a base pressure of ~3-4×10
-6
torr
during reaction and the sample was heated to 1000 ˚C.
3.4 Growth of BN nanomaterials from FeB catalysts
10 20 30 40 50 60
FeN
Fe
2
N
Fe
2
N
Fe
23
B
6
Fe
8
B
Fe
23
B
6
Fe(110)
BN(002)
10 min
30 min
60min
0 min
Intensity (a.u.)
2 theta (degree)
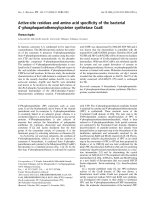
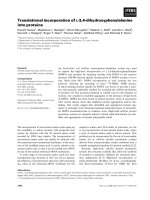
Figure 3.1 Grazing angle XRD spectra of FeB before and after nitridation.
The original FeB powders are fine black particles. TEM observation of the
FeB particles before reaction shows that the nanoparticles are approximately 20–30
nm in diameter. Following microwave plasma treatment, a whitish-grey product
covered the sample
. Grazing angle XRD was performed to determine the crystal
structure of FeB before and after reaction at different nitridation times under the
same experimental conditions. The diffraction pattern, shown in figure 1, reveals
Chapter 3 Growth of boron nitride nanostructural materials
61
that the crystalline phase of the initial FeB particles is alpha-Fe, and the Fe-B is also
present as an amorphous phase. Hu et al [22] also found FeB to be amorphous using
Mössbauer spectroscopy. Following nitrogen plasma treatment at 850 ˚C in a
microwave CVD system, we can detect the peaks assignable to the products of iron
and nitrogen and phase recrystallization from FeB, such as Fe
23
B
6
, Fe
8
B, Fe
2
N and
FeN, as well as a small peak due to BN (002), suggesting the formation of
crystalline h-BN. The intensity of the BN (002) peak is similar for all samples after
nitridation, resulting from the formation of BN mainly in the first 10 minutes.
300 320 340 360 380 400 420 440 460 480 500
20
40
60
80
100
120
140
160
180
200
220
240
260
280
300
60 mins
30 mins
10 mins
150K
CL intensity
wavelength(nm)
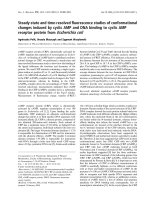
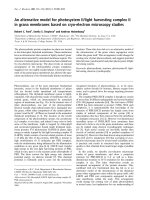
Figure 3.2 Cathodoluminescence spectra of BN recorded after 10, 30, 60 min exposure to
N
2
.
Chapter 3 Growth of boron nitride nanostructural materials
62
CL measurements (figure 3.2) were carried out to characterize the quality of
the BN products. No peak can be detected for FeB particles before N
2
plasma
treatment. After reaction, in each case, emission is detected centered at ~370 nm,
corresponding to an energy of 3.36 eV which is considered to be the impurity level
of the BN layers (5.5 eV). Impurities such as oxygen (leakage) or hydrogen can be
incorporated into the BN during N
2
and H
2
treatment [24, 25]. The CL signal
increases substantially with increasing nitridation time, and the FWHM is observed
to decrease with nitridation time, from ~50 nm after 10 minutes, to ~20 nm after 60
minutes nitridation. This is most likely due to the reduction of defects in the BN
products with increasing reaction time. The asymmetry of the peak also decreases
with nitridation time, as longer wavelength emission is suppressed. This is most
likely due to the reduction in mid-gap defects due to surface and related effects. CL
measurement proves the high quality of BN can be achieved after N
2
treatment of
FeB particles.
Generally, several types of BN nanostructures were formed from the grey
deposits following the nitrogen-plasma treatment of the FeB nanoparticles. A
comprehensive analysis of the morphologies of the BN nanomaterial and the
adjacent FeB particles from which it ensues were studied carefully under TEM.
TEM results indicate a relationship between the size of the FeB particle and the
shape and form of its BN derivative. In actual experimental conditions, where we
Chapter 3 Growth of boron nitride nanostructural materials
63
subjected the FeB-cast silicon substrate to a N
2
-plasma treatment, the distribution of
products on the silicon substrate is quite heterogeneous and the nanotube diameter
correlation is complicated by nanoparticle-substrate interaction, mobility of particles
at elevated temperatures and fragmentation and coagulation process. Underpinning
this relationship is the relative ease by which the particle undergoes liquid-flow.
Table 3.1 Relationship between the FeB particle size and the morphology of the
nanomaterials ensuing from it.
Size of associated
FeB particle (nm)
Morphology Length Quantity Reference
10 Nanotubes 200 nm small Fig. 3.3
50–200 nanotubules 2–3 µm medium Fig. 3.5
Nanocages many Fig. 3.4
Iron nanowires 0.5–1 µm Few Fig. 3.7
>200 Microspheres 0.5 µm Many Fig. 3.6
Table 3.1 summarizes the apparent relationship between the size of the FeB
particle and the BN nanomaterial that ensued from it, as was observed in this work.
It is more difficult for the larger particles to achieve fluid-like motion compared to
the smaller particles. So if the smaller FeB particles aggregate to form a FeB particle
larger than 200 nm, the mobility of this particle is restricted and only an outer BN
microcapsule grows on it. Nanotubules are generally observed to grow from FeB
Chapter 3 Growth of boron nitride nanostructural materials
64
particles with sizes in the range of 50–200 nm, because these particles melt and flow
readily, and trace out nanotubules with bamboo-like segments in its motion. What is
interesting are FeB particles with sizes ranging from 50 to 100 nm, smaller BN
nanotubes and nanocapsules are readily created from these, and in addition, these
FeB particles readily melt and recrystallize into crystalline Fe nanowires ensheathed
by BN. A detailed discussion of the various structural polytypes follows below.
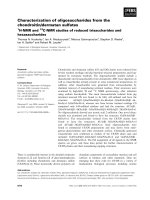
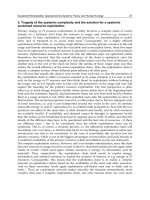
Figure 3.3 TEM images of BN nanotubes recovered from the FeB nanoparticles after
nitrogen-plasma treatment at 850 ˚C.
Some BN nanotubes can be observed in the nitridation products, as shown in
figure 3.3a. These are BN nanotubes with diameters of 20-30 nm and length to 200
nm. Higher magnification images were recorded in order to observe the internal
structure of these nanotubes. Unfortunately, the low contrast between the BN
nanotubes and the carbon support film leads to poor quality images. However, we
can still see tat the walls of the BN nanotube are poor by crystalline with many
Chapter 3 Growth of boron nitride nanostructural materials
65
defects which make the BN nanotubes unstable under the strong electron beam.
These nanotubes may have evolved from a partial crystalline BN film during the
nitridation process. For the growth of BN nanotubes, a high temperature and a slow
cooling rate would be needed. In our plasma system, 850 ˚C may not be a high
enough temperature to form high quality BN nanotubes.
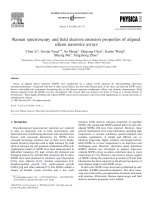
Figure 3.4 TEM images of BN nanocapsules.
For FeB particles with sizes between 50 and 100 nm, nanotubules or
nanocapsules are readily formed from them. We can observe the Fe or FeB-FeN
nano-sized particles encapsulated in the BN nanocages. Isolated FeB particles that
escaped sintering afforded an interesting observation point for the growth of BN
nanocages. Figure 3.4 shows TEM images of BN nanocages consisting of
multi-layered hexagonal BN with some FeB particles leaving the BN nanocages.
Chapter 3 Growth of boron nitride nanostructural materials
66
When some of the particles were leaving the BN capsules, the movement of the
particles stopped due to the rapid reduction of the temperature. This indicated that
the BN nanocages formed at the surface of FeB particles.
Figure 3.5 TEM image of (a) (b)BN bamboo-like nanotubules, HRTEM images of (c) center
and (d) tip of the nanotubules.
Moreover, we can observe for example a one-micron long nanotubule traced
out by one single FeB particle, as shown in figure 3.5. HRTEM lattice images of the
nanotubule close to the FeB particles and at the center are shown in figure 3.5c and
(a)
(b)
(c)
(d)
Chapter 3 Growth of boron nitride nanostructural materials
67
d. It is noteworthy to point out two facts: First, the nanotubule formed is a
shape-transform of the FeB particle as judged by the BN walls surrounding the
exterior of the FeB particle. Second, the nanotubule walls are curvy and
twisted-looking, and are formed by a string of interconnected BN nanotubles
circumscribed by the FeB particle in its liquid flow.
Figure 3.6 HR-SEM images of (a) BN microcapsules on the top of FeB particles which
resembles cracked egg-shells; (b) single crystalline FeB or Fe particles beside the BN
microcapsules; (c) TEM image BN microcapsules (d) HRTEM image of walls of these
capsules.
(a)
(d)
(b)
(c)
Chapter 3 Growth of boron nitride nanostructural materials
68
When the size of the FeB particles are large than 200 nm due to aggregation,
the mobility of the FeB particles will decrease compared with small particles. The
outer BN micro-capsules will grow around these big FeN particles. Following the
nitrogen plasma treatment and cooling, many micron-sized egg shell-like BN
microcapsules were formed, as shown by the SEM images in figure 3.6a. What is
noteworthy is that all the BN microcapsules have a crack in the shell. Next to these
cracked BN ‘egg-shells’ can be found single crystal, well-faceted Fe, as shown in
figure 3.6b. This suggests that molten metal drops created from the aggregation of
FeB particles are contained in the micron-sized solid BN capsule during the plasma
treatment and high-temperature annealing. Compressive stress created by the
inward-growing BN shells caused the molten Fe to break through, escape and
recrystallize into single crystals next to it, leaving behind the cracked BN egg-shells.
This suggests that the compressive force is strong enough to crack thick BN
microcapsules. The internal microstructure of some of the thinner, transparent BN
microcapsules is shown by the TEM images in figure 3.6c and 3.6d. These thinner
capsules become disengaged from the FeB particles after ultrasonication. The walls
of the capsules are well ordered with the interlayer spacing of 3.4 Å, which is in
good agreement with the spacing of 3.34 Å of bulk hexagonal BN. Such shell-like
BN sub-micron and micron scale structures have also been observed in laser ablation
studies by Komatsu and coworkers [26, 27].
Chapter 3 Growth of boron nitride nanostructural materials
69
Figure 3.7 TEM images showing: (a) metallic nanoparticles exhibiting capillary flow and
being entrapped in the mass of BN sheets; (b) image of a long iron nanowire encapsulated in
BN. Higher magnification images in (c) and (d) reveal that the interface between the BN and
Fe consists of disordered h-BN.
(a)
(b)
(c)
(d)
Chapter 3 Growth of boron nitride nanostructural materials
70
Figure 3.8 Bright field image and elemental mapping of Fe, N and B of BN ensheathed–Fe
nanowire. The results show that the core is filled with elemental iron, whilst the sheath is
made of BN.
In addition to BN nanotubes and nanospheres, metallic nanoparticles with
high shape anisotropy can be found among the products after the nitrogen plasma
treatment. The relative ease of liquidification and capillary flow of smaller FeB
particles, followed by recrystallization, result in the growth of iron nanowires
encapsulated by disordered hexagonal BN sheets. Figure 3.7a shows TEM images of
Chapter 3 Growth of boron nitride nanostructural materials
71
metallic nanoparticles entrapped in the mass of BN sheets after capillary flow. It can
be seen that some wires grow from the catalyst by a "root-growth" mechanism, with
the source of the wire in the FeB catalyst. The diameter of the wire is about 5 nm.
The catalyst was observed to move with capillary fluidity in the tube and crystalline
planes could be seen inside the tubule. Figure 3.7b shows an image of a long iron
nanowire encapsulated in BN. Higher magnification images in figure 3.7 c, d reveal
that the interface between the BN and Fe consists of disordered h-BN, and
crystalline h-BN layers nucleates on top of the disordered h-BN. The composition
was verified by elemental mapping with EELS in figure 3.8, which confirmed that
the inner core is elemental iron, whilst the outer coating is BN. The wrap around of
the entire iron wire by BN layers attests to the good wetting properties between iron
and BN. Babonneau and coworkers reported the synthesis of vertically elongated
nanoparticles of Fe
2
N encapsulated in disordered hexagonal BN by the ion beam
sputtering of BN–Fe nanocomposite film [28]. They attributed the high shape
anisotropy to the activated surface diffusion of the incoming deposited species
assisted by ion beams. In the work described here, many BN laminar sheets, as well
as small isolated FeB particles were left behind in an extended matrix after the
encapsulated FeB particles escaped and coagulated into bigger particles. These
laminar sheets may curl up to form BN nanotubes with the metal particle
encapsulated within. Plasma-activated nitrogen and hydrogen species in our
Chapter 3 Growth of boron nitride nanostructural materials
72
experiment may also impart energy for the activated diffusion of Fe on the
dimensional BN laminar sheets, resulting in the anisotropic crystallization of
metallic nanowires.
Based on these experimental observations, we can deduce that the growth
occurs at the inner face between the BN walls and the FeB particle.
Nitrogen-bearing species may be supplied to the FeB particles either by diffusion
through the shell wall, or by diffusion along the particle:shell interface. Diffusion of
N–BN layers has a high activation barrier with a characteristic time that is much
larger compared to diffusion through the liquid particle. Low diameter liquefied
nanoparticles are characterized by significantly shorter times of N diffusion through
the particle body which is important for BN nanotube formation by the segregation
process. The dissolution of nitrogen in the molten FeB results in the formation of
BN, which is insoluble and segregates as an outer BN shell. Following the
segregation of a single BN shell, growth of further BN shells proceeded between the
inner face of the shell and the FeB particle which is wetting it by the continuous
epitaxial precipitation of BN from the molten FeB, i.e. the growth occurs between a
wetted liquid-solid interface. This process is similar to the VLS growth method. The
inward directed growth of the BN shells will result in a continuously shrinking inner
volume and increasing tensional forces at the Fe–BN interface. At any aperture in
Chapter 3 Growth of boron nitride nanostructural materials
73
the BN shell, capillary action will draw the molten FeB out from within and through
it as the compressive forces build up to a critical level.
Figure 3.9 Phase diagram of Fe-B binary alloy.
The FeB phase diagram [29] indicates that the FeB is stable to 1650 ˚C. No
liquid Fe-B phase can be detected in the phase diagram. But as the B content
decreases below 50% at a temperature of 1000 ˚C, Fe
2
B (solid) and liquid FeB are
the equilibrium phases (stable to 1389 ˚C), whilst below 33% B, solid Fe and liquid
Fe
2
B are expected, with a eutectic at 1174 ˚C. In addition, the melting point of the
small particles decreases dramatically compared to that of the bulk states. The
surface melting will occur when the particles size reaches nanometer size [30, 31].
Chapter 3 Growth of boron nitride nanostructural materials
74
The well-known Gibbs–Thompson effect predicts that for particles with sizes below
100 nm, melting occurs at a significantly lower temperature compared to values in
the standard phase diagram, thus fluid-like motion can be attained more readily at
~1000 ˚C.
3.5 in-situ TEM study of growth of BN nanocapsules from FeB particles
Based on our experimental observations we propose that growth of the BN
nanocages proceeds by the dissolution of nitrogen in the molten FeB results in the
formation of BN, which is insoluble and segregates as an outer BN shell at the
surface of the FeB particle, with the Fe playing the role of catalyst. To fully
understand the growth mechanism of the BN nanomaterials, the FeB catalysts were
nitrided in the in-situ TEM. This allowed the direct observation of the nitridation
process with ammonia, sintering of the FeB particles, as well as the growth of BN
layers on the periphery of the aggregated particles could be observed.
The sample was heated in the presence of a partial pressure of 3-4×10
-6
torr
of NH
3
background. Around ~1000 ˚C in high vacuum, a rapid and significant
degree of sintering and agglomeration of the FeB nanoparticles was observed, which
made electrons difficult to go through the melted thick part of the nanoparticles.
Fluid-like motion of the particle profiles was apparent at and above ~900 ˚C, which
confirmed the liquid like behavior of FeB concluded from the phase diagram and the
Chapter 3 Growth of boron nitride nanostructural materials
75
small size effect on the melting point. To avoid sintering, the sample was then heated
to a maximum temperature of 900 ˚C. Despite their fluid-like motion, the particles
remained crystalline, as determined by the diffraction contrast associated with the
particles. In the heating process, due to thermal drift and the influence of a high
concentration of NH
3
on the electrons, we were not able to follow closely the growth
of all dimensional structures other than the nanospheres described above.
Figure 3.10 Bright-field image of the Fe–B nanoparticles prior to heating.
Chapter 3 Growth of boron nitride nanostructural materials
76
200 250 300 350 400
B-K
σ
*
π
*
N-K
Counts (a.u.)
after reaction
before reaction
eV
Figure 3.11 In situ EELS spectra before (lower) and after (upper) exposure to NH
3
, showing
the B 1s and N 1s K-edges, and a notable absence of carbon.
TEM observation of the particles revealed excellent size uniformity, and
figure 3.10 presents a bright-field image of a typical area of the sample prior to
reaction with ammonia. The FeB particles are approximately 30 nm in diameter.
EELS was performed at this stage and revealed the presence of the B K-edge and C
K-edge with low concentrations, as shown in figure 3.11 (lower trace); no evidence
of the presence of nitrogen was observed prior to reaction. EELS spectra recorded
post-nitridation is shown in figure 3.11 (upper trace). The spectrum now shows two
characteristic edges at 188 eV and 401 eV corresponding to the K-shell ionization
edge of B and N, with the absence of carbon. The ionization edges π*, σ* and the
energy loss fine structure correspond to the sp
2
hybridization of BN, as expected for
Chapter 3 Growth of boron nitride nanostructural materials
77
the formation of hexagonal BN.
The composition can be derived from the EELS spectrum using the
following equation [32]:
),(),(
),(
),(),(
),(
22
2
11
1
2
1
∆∆
∆
∆∆
∆
=
βσβ
β
βσβ
β
I
I
I
I
C
C
c
c
where Ic
1
(β, ∆) is the integrated core-loss intensity integrated over an collecting
semi-angel β (10 mRad) and an energy window of width ∆ (50 eV), I
1
(β, ∆) is the
integrated intensity of the low-loss region of the spectrum, σ(β, ∆)is the
cross-section for core-loss scattering up to the β and ∆, C is the number of atoms per
unit area of corresponding element. Since we only need relative concentrations, the
low loss integral can be ignored. From the above calculation, the B: N atomic ratio
of the BN nanocapsules is around 0.93:1, which is consistent with the stoichiometry
of BN. The estimated error of the calculated result is around 10 %. This suggests
that stoichiometric BN with B/N atomic ratios of approximately 1 can be achieved
after nitridation.
Detailed insights into the heterogeneous reaction come from elemental
mapping by energy-filtered imaging in figure 3.12. The red particle indicates iron,
which is surrounded by thin BN cages. We can conclude that the iron particle is
encapsulated by a BN nano-cocoon.
Chapter 3 Growth of boron nitride nanostructural materials
78
Figure 3.12 Elemental map of FeB particles after annealing in NH
3
at 900 ˚C, Blue-
Nitrogen, Green-Boron, red- iron.
Figure 3.13 A bright-field image shows the series of BN nanocages produced by the
nanoparticle.
Chapter 3 Growth of boron nitride nanostructural materials
79
After a few minutes exposure to NH
3
at 900 ˚C, melting of the catalyst and
its resultant “activation” could be detected. At this point, crystalline layers were seen
to nucleate around the molten catalyst. The particle located at ‘E’ (figure 3.13) was
initially located within the BN nanocage at ‘A’; the series of BN nanocages formed
around the particle can be clearly seen in TEM, in positions ‘A’-‘E’. The following
sequence of events was observed in real time, as shown in figure 3.13: (i) growth of
BN nanocages around iron boride particle; (ii) After reaching a certain thickness, the
aperture of the cage is closing, capillary force at the interface expels the molten iron
boride particle into region B, leaving an incipient void, and a new BN cage grows in
B; the FeB particles were seen to be ejected from the core of the shells that had
formed around them, being subsequently located outside the shell but still in contact
with it. (iii) the particle was expelled into C after the BN nanocage reaches a certain
size, and (iv) process repeats itself, and then into ‘E’ finally. No further movement
was detected in ‘E’ thereafter even though the reaction conditions were maintained.
Chapter 3 Growth of boron nitride nanostructural materials
80
Figure 3.14 High-resolution phase contrast image of the BN layer structure. The observed
lattice spacing corresponds to the (002) planes of hexagonal BN.
The thickness of each nanocage wall was found to be ~3-5nm. In figure 3.14
we present a high resolution image of a representative wall, showing the layered
structure of hexagonal BN as viewed along the (002) planes. The observed lattice
spacing corresponds to the expected (002) spacing of 0.34 nm. The (002) plane,
being the lowest free-energy layers for hexagonal BN, manifests as many two
dimensional (002) sheets in many areas. The cages shown here are still filled with a
metallic particle with a second cage overlapping this cage in the lower left portion of
the image. The presence of occasional defects within the cage walls was observed,
and a typical example is found in this image, labeled ‘D’. At position ‘F’, above the
through-thickness defect, a section of the outer shell wall has apparently ‘folded’
over during the initial stages of growth. The feature has some similarities with the