Cytophysiologic effects and molecular inhibition of a functional actin specific ADP ribosyltransferase CDT from clostridium difficile 3
Bạn đang xem bản rút gọn của tài liệu. Xem và tải ngay bản đầy đủ của tài liệu tại đây (1.4 MB, 52 trang )
62
Chapter 3
Molecular Characterization of a binary cdt toxin genes from a variant
Clostridium difficile strain with truncated pathogenicity locus
3.1. Introduction
Several approaches have been used to identify virulence proteins in recent years. For
example, random transposon mutagenesis was useful through creation of Pseudomonas
aeruginosa mutants which were screened for virulence reduction (Rahme, Tan et al. 1997; Jander,
Rahme et al. 2000). Gaining increasing application is nucleotide microarray chip technology
(Lan and Reeves 2000) which allows identification of differential genes between pathogenically
diverse organisms. However, availability of genetic sequences is necessary for inclusion into the
array. More recently, phenotype microarray has allowed comparison of differential proteome
expression amongst six strains (Bochner, Gadzinski et al. 2001). As knowledge in phenotypic
variations has become popular in understanding disease processes and formulation of directed
defense, detection of virulence genes by phenotype analysis between wild-type and isogenic
knock-out strains for example, has become promising. Again, differences in protein products is
dictated by gene diversity and this highlights the importance on our continued discovery of
genetic sequences.
Recently, genomic subtraction (GS) between virulent P. aeruginosa pathogen PA14 and
avirulent PA01 revealed Yersinia pestis ybtQ virulence homolog in P. aeruginosa using G.
mellonella and burned mouse model (Sawada, Kokeguchi et al. 1999; Choi, Sifri et al. 2002).
Moreso, Sawada et al. (1999) detected insertion sequence IS1598 involved in necrotic abscess
formation among virulent Porphyromonas gingivalis strains after failed attempts to identify
virulence determinants from strain differences using biochemical means (Neiders, Chen et al.
1989). Use of this technique has likewise resulted in rapid isolation of gene islands and
pathogenes between closely related organisms (Klee, Nassif et al. 2000; Choi, Sifri et al. 2002).
In this study, we have adopted a similar approach and have localized 19126-specific
63
virulence gene portions which to our knowledge is the first report of genomic subtraction
administered between two C. difficile strains. Putative pathogenes were concentrated as genomic
library probe through elimination of closely homologous DNA from two sets of genome that have
hybridized. The process has led to the identification of several virulence genes and
characterization of variant forms of cdt whose detection was reported at about 6% of C. difficile
clinical isolates (Stubbs, Rupnik et al. 2000; Geric, Rupnik et al. 2004; Goncalves, Decre et al.
2004). This has illustrated the efficiency of the technique in enriching specific genomic subset
involved in pathogenicity and those encoding unknown or hypothetical proteins with possible
novel identity. Furthermore, we have explored cdt gene expression since knowledge on this
aspect is lacking, unlike the PaLoc toxin genes whose expression has been well-characterized to
follow both mono- and polycistronic transcription with higher expression of downstream mRNA
(tcdA>tcdB mRNA). Finally, we have studied the functional role of several conserved amino
acid residues in CDTa confirming identity of the genes isolated.
3.2. Results
3.2.1. Isolation of putative 19126-specific virulence DNA
Initially, we performed genomic subtraction between pathogenic (19126) and
nonpathogenic (11186) C. difficile strains to derive virulence gene fragments. Identity of DNA
source strains were first ascertained by detecting a portion of toxin B gene, tcdB using colony
PCR (see Table 2.2 for primers used). Results showed the presence of 1362 bp segment in
genomes of known C. difficile pathogens ATCC 43596 and 19126 which was not amplified from
11186 (Fig. 3.1). Using enzyme immunoassay, toxin A was produced by 19126 (OD
450
=0.589)
and 20309 (0.446) which are higher than the >0.200 cut-off for positive result but not 11186
(0.036). These indicated the presence of PaLoc-encoded toxins in 19126 and absence in 11186.
Enrichment of 19126 DNA was achieved by allowing its reassociation with excess of
sheared, biotinylated subtractor DNA from 11186 (Fig. 2.1). The streptavidin-bound biotinylated
64
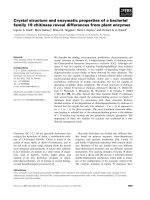
Figure 3.1. Characterization of C. difficile reference strains for the presence of tcdB gene
portion using colony PCR. The PaLoc gene was amplified from chromosomal DNA of
ATCC 43596 (lane1), CCUG 19126 (lane 2) and VPI 11186 (lane 3). M, 1 kb plus DNA
ladder (Gibco BRL).
DNA species (single-stranded, homoduplexes and heteroduplexes) were removed by organic
phase extraction with streptavidin while unbound DNA subjected to more rounds of subtraction
cycle. Rounds 1-4 extracts contained amplicons of wide-ranged sizes whereas fifth round
products were limited to 100 to 300 bp, suggesting more complete range of target DNA template
until the 4th round. Using colony and dot blot hybridization, pathogenic ATCC43596 and 48 out
of 292 library clones reacted with the probe but not 11186 and E. coli containing pUC18, SK1200
(Table 2.1)(Fig. 3.2A,B,C,E). Accordingly, clinical isolate CD108, screened as non-PaLoc
containing was not recognized by the probe (Fig. 3.2E). These indicate efficient enrichment
through successive subtractive cycles and have shown probe identity to PaLoc toxigenic elements
and other putative pathogenes.
3.2.2. Identification of insert fragments with putative virulence function
Nineteen representative plasmids with inserts ranging from 100 bp to 1 kb fragments
were sequenced (GenBank accession no. CC927338-CC927348) and submitted to NCBI BLAST
programs for homology search (Table 3.1). Majority of clone inserts at 42% showed identity to
1.6
M 1 2 3
1.3
kb
65
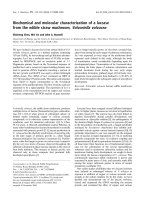
Figure 3.2. Colony hybridization showing autoradiogram of CCUG 19126 genomic
library clones detected by round 4 subtraction product. A-C, discs blotted with 292
colonies starting from slot A1 up to C93. For all discs, slots 101-104 contained the
following colonies: SK1200-JM109 carrying pUC18 (negative control), ATCC 43596
(Positive control), CCUG 19126 (test), and VPI 11186 (test) shown by arrows on disc A.
Disc A had colonies 1-100 exclusively, disc B with colonies 101-200, and disc C had
colonies 201-292. D, template grid used for colony blotting. E, dot blot of C. difficile
genome probed with round 4 subtraction product: 1-SK1200, 2-CD108, 3-CCUG 8884,
4-VPI 11186, 5-CCUG 4938, 6-ATCC 43596, 7-CCUG 19126.
66
Table 3.1. Protein similarities of CCUG 19126 library inserts
Clone
Length
of
fragment
(bp) Predicted protein homologies Organism E- value
Percent
identities
GenBank
access. no.
GS05 382 Phage-related protein Xylella fastidiosa Temecula1 2.E-01 68% NP779526
GS10 129 Toxin B Clostridium difficile 1.E-23 100% AF217292
GS41 348 Toxin A locus CDTOXA, X5179, AA1-142 Clostridium difficile 2.E-10 100% CAA36093
TcdE locus CDI011301, AJ011301 Clostridium difficile 5.E-09 90% CAC19892
GS65 560 Hypothetical protein Deinococcus radiodurans 5.E-09 41% D75542
GS68 725 Carbamoyl-phosphate synthetase subunit Clostridium perfringens 6.E-04 91% NP563488
GS80 573 CDT binding component Clostridium difficile 3.E-92 98% AAB67305
Iota toxin component Ib Clostridium perfringens 5.E-75 75% CAA51960
GS101 230 SocE-csgA suppressor Myxococcus xanthus 5.E-05 53% AAF91388
GS104 398 Toxin B Clostridium difficile 1.E-59 100% AF217292
GS110 127 Tox protein DT-201 Corynebacterium diphtheriae 2.E-06 100% AAA72620
GS128 187 S-layer protein Clostridium difficile 1.E-01 75% CAC35720
GS157 303 Alpha-hemolysin Aeromonas hydrophila 3.E-04 65% AAB81227
GS159 293 Hypothetical protein Clostridium perfringens 2.E-04 68% Q8XM08
GS166 194 HD superfamily hydrolase, HD-GYP domain Clostridium acetobutylicum 2.E-08 92% NP347489
GS194 635 Unknown Pasteurella multocida 1.E-01 76% NP245838
GS201 165 Catalase Agrobacterium tumefaciens 3.E-01 94% NP535120
GS213 537 Hypothetical protein Bacillus megaterium 4.E-08 65% NP799510
GS237 142 Cat-2 catalase Zea mays 5.E-08 93% S71455
GS241 164 DnaK heat shock protein Clostridium acetobutylicum 5.E-02 56% NP347113
GS272 288 Hypothetical protein Escherichia coli 4.E-02 42% NP308728
bacterial virulence homologs with clones GS10 and GS104 containing portions of tcdB covering
an average 112 amino acid residues, while GS41 carries portions of tcdA at amino acids 112-142
and tcdE at amino acids 135-165. On the other hand, 32% matched with unknown, hypothetical
or phage-associated factors and 26% with housekeeping proteins. Although the proportion of
identified DNA here is small relative to complete genome sequences, similarity in categorical
identity are reflective of those in many genome projects like in Clostridium perfringens and
E.coli K-12 where 38% of ORFs had homology to hypothetical or unclassified proteins and
87.8% to known factors (Blattner, Plunkett et al. 1997; Shimizu, Ohtani et al. 2002). Detection of
several virulence-encoding fragments is expected as our library was probed with nucleotides
which have been potentially rid of strain-specific complementary duplexes that are likely
maintenance genes.
67
3.2.3. CCUG 19126 and CCUG 20309 encodes variant forms of cdt
To further support applicability of genomic subtraction, we validated the identity of
GS80 insert by attempting to capture and functionally characterize the complete cdt in 19126 and
other C. difficile strains. The clone has a 573 bp insert of 75% identity to iota toxin component
Ib of C. perfringens (nt 638-786) and 98% to C. difficile CD196 ADP-ribosyltransferase binding
component, CDTb with extensive coverage of 148 amino acid residues (nt 639-787) (Perelle,
Gibert et al. 1997a). Based on CD196 nucleotide sequence, primer pairs were designed to detect
cdt from various C. difficile strains.
Our preliminary survey of toxin A-producing hospital isolates yielded 13 toxinotypes of
PaLoc and cdt gene variants with none of the complete cdt. Strain 19126 encodes a 1,282 bp
truncated cdt (GenBank accession no. AY341253). Sequence identity encompass 533 bases
downstream of cdtA start site and 3’end of cdtB punctuated with a large block deletion of 1,958
bp (Fig. 3.3). The incomplete orf was sequenced from pDA579 in clone SK1222 (Table 2.1).
Among the reference strains tested including ATCC 43596, nonpathogenic VPI 11186 and VPI
8884, only CCUG 20309 contained the full cdtA, cdtB and binary genes of 0.9, 1.8 and 3.2 kb
amplicon sizes, respectively (Fig. 3.3). cdtA is 1,392 bp long encoding a 463-amino acid protein
(53 kDa, pl of 8.81), whereas cdtB has 2,631 bp encoding a polypeptide of 876 amino acid
residues (99 kDa, pl of 4.74). The higher prevalence of C. difficile with truncated cdt (40%) over
the complete cdt toxinotype is reflected on our survey.
In comparison to CD196, 9 additional nucleotides (ACCAGAAGA) were located 165 bp
downstream of cdtA translational start site. This resulted in the replacement of Ser55 by Arg55,
Pro56, Glu57 and Asp58 resulting in 4 conservative deduced amino acid substitutions.
Immediately upstream lies the putative cleavage site (Lys42-Val43) that is essential for the
release of proposed cdtA N-terminal transmembrane signal peptide (Klein, Kanehisha et al. 1985;
Perelle, Gibert et al. 1997a). A similar cleavage site was found in cdtB (Lys42-Glu43).
68
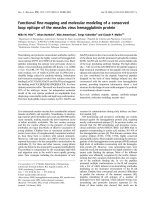
Figure 3.3. Comparative genetic map of CCUG 19126 and CCUG 20309 cdt genes.
Double arrow heads indicate amplicon position and sizes with corresponding bands on
1% agarose gel (M, DNA ladder; lanes 1-3, from template 20309; lanes 4, 5 and 6, from
templates VPI 10463, 11186 and 19126, respectively. Single arrow head points to the
direction and location of primers (see Table 2.2). Block circles show the location of
homologous direct repeats (underlined) in 20309 cdtA
(TATACAAAACAAATTATT
TAA), 20309 cdtB (ACTACAAATTATTCCCATACA),
and 19126 truncated cdt (TATACAAGACAAATTATT
ACCATACA). Dashed lines
show the extent of cdt deletion (not drawn to scale).
69
3.2.4. Analysis of cdt regulatory region
Primer extension generated a first strand cDNA product (52 bp) which terminated at the
5’ transcription initiation site (TSS) that was mapped to an adenine residue at nt. -24, that is 25 bp
and 14 bp upstream of start codon and RBS, respectively (Fig. 3.4)(Angeles, Leong et al. 2004).
The 542 bp sequence upstream of cdtA ATG start site (GenBank accession no. AY029209)
showed several features including a ribosomal binding site (RBS) located 6 bp upstream of start
site (Fig. 3.4). An RBS was also found 5 nucleotides upstream of cdtB that is conserved in iota
Ib. Inverted repeats of 11 bp and 8 bp in length were also located 47 bp and 325 bp respectively,
upstream of start site. Two putative promoter regions were detected with one -10 region located
34 bp upstream of start site, separated from the -35 region by 15 nucleotides while the other at
128 bp upstream of start site has -10 and -35 regions with 18 intergenic spaces (Fig. 3.4). The –
10 consensus promoter sequence at nt –33 to –38 (TTCAAG) was located 9 bases whereas the –
35 site at nt –54 to –59 (TATAAT) is 32 bases upstream of TSS (Fig. 3.4)(Table 3.2). The –45
AT-rich region upstream of promoter which is conserved in Gram-positive bacteria was also
identified at nt. –69 to –80. This 0.58 kb regulatory region was also detected in 19126 while the
0.9 kb cdtB downstream region containing inverted repeats at nt 161-173 and 186-198 was not
present.
Comparison with truncated cdt revealed a single copy of 10 bp direct repeat
(ACAAATTATT) in place of deleted block also found flanking the deletion region in 20309 cdt
(Fig. 3.3). Such intergenic repeat sequences may represent insertion or deletion site remnants of
transposable DNA elements mediating mutation through gene transfer or recombination.
Manifestations exist in 19126 cdt as intermittent deletion, base substitution and insertion that
resulted in premature termination (TGA) at the 69th codon.
3.2.5. Growth dependent transcription of cdt
70
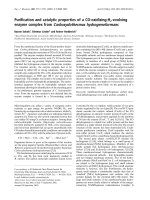
Figure 3.4. Characteristic features of 20309 cdt regulatory sequences. The initiation
(ATG) and termination (TAA) codons are labeled. Putative RBS sequences are shown in
bold, putative promoters are italicized and underlined and the transcription initiation site
is italicized and labeled (+1). Arrows indicate the direction and position of inverted
repeats. Intergenic sequence between cdtA and cdtB are in lower case and flanked with
spaces. Numerical designation on the right indicates sequence position of the last
nucleotide in the line.
GAACCATCTCTTTTTTTATACAAAAAAAGTAGTTCCTAAGAAT
-
310
CCTCTATA TCTCTTTAAAATATT
-
160
CAG
TTGTTA
TTTTGTACTGACATATCA
TATAAA
TACATATTTT -117
TATGATATATAGTTACATATTTTATGAAATTTATATAAAAAAT
-
74
-35 -10
-35
TCTTATTTAGATTA
TATAAT
CTAAATAAATTAAAG
TTCAAG
AG -31
-
10
TTAATT
A
AACTAATATTGGGAGGGAGAATAAATGAAAAAATTT 12
AGGAAACAT TGATGCAACATTGA 1383
TACCTTAA tattttttcacataaataatttaatatttttcaa
atttaaggAGGAGAaaca ATGAAAATACAAAT
GAGGAATAAA 24
Stop
Start cdtA
Start cdtB
+1
71
Table 3.2. Comparison of clostridial promoter sequences with bacterial consensus DNA
Bacterial source Gene -35 -10
Intergene
space
(bp) Reference
Gram positive Ttgaca* TATAAT 17 Graves & Rabinowitz, 1986
E. coli Ttgaca* TATAAT 18 Hawley & McClure, 1983
Clostridia spp. Ttgaca* TAtAAT* 17 Young et al., 1989
C. difficile cdtA TTGTTA TATAAA 18 This study
TATAAT TTCAAG 15 This study
C. difficile tcdA TTAACA TTATCT 20 Sauerborn et al., 1990
TTTACA CTCCTT 17 Dupuy & Sonenshein, 1998
C. difficile tcdB TTTACA GTCTTT 17 Dupuy & Sonenshein, 1998
TTAGCA TATAGT 17 Song & Faust, 1998
TTTACA TTATTC 21 von Eichel-Streiber et al., 1992
C. difficile tcdD TATGTC TATTTT 14 Hammond et al., 1997
TTTACA TTATTG 20 Hundsberger et al., 1997
C. difficile tcdE TGCACA TCTAAT 20 Sauerborn et al., 1990
C. perfringens Ia TTGTCAT TATAAT 17 Perelle et al., 1993
C. botulinum botA TTAACC TATGTT 18 Binz et al., 1990
*lower case letters represent less conserved sequences
To characterize transcription pattern of cdt, gene expression of the complete and
truncated form were initially compared using RT-PCR. At OD
600
, C. difficile growth phases
followed a typical sigmoid curve with the early log phase observed between 9 to 10 h proceeding
to peak at 19 h (Fig. 3.5A). Preliminary control assays proved experimental validity by showing
no amplicon when total RNA template was digested or no first-strand synthesis was performed
while similar treatments without DNAse I digestion generated PCR products (Fig. 3.5B).
Temporal expression at 5 growth points revealed that cdtA is transcribed from the exponential
phase between the 8th and 12th h, which waned starting from stationary phase (Fig. 3.5C,D).
Similar expression pattern was observed for cdtB and higher transcription of the truncated form
which seemingly persisted up to the 24th h (Fig. 3.5E,F). In addition, primer pairs flanking both
cdtA and cdtB regions of 20309 produced a 690 bp amplicon at the exponential phase (Fig. 3.5G).
Taken together, such synchronous transcription suggests possible expression of cdt locus as a
bicistronic operon controlled by similar if not identical regulatory elements.
72
3.2.6. Transcription of cdt relative to tcdE of the PaLoc
Using semiquantitative RT-PCR, transcription of cdt mRNA was then compared with
tcdE of the PaLoc to determine intra-strain relative expression in 20309. Determination of
optimum primer annealing temperature was initially conducted for each primer pairs using
Biometra gradient cycler (Fig. 3.6A-C)(Table 2.2). Thereafter, cDNA level of specific genes was
measured starting with the relatively high expression of internal control 16S rRNA (Fig.
3.6D)(Table 2.2). Throughout most growth points, band intensities showed abundance of tcdE
over cdtA and cdtB mRNAs which were not detected in 11186 (Fig. 3.6E-G) and reiterated by
densitometric data (Fig. 3.6H). Considering mean values for all timepoints, the transcription ratio
for cdtA, cdtB and tcdE was 0.7: 0.6: 1.0 with significant difference in values for tcdE against
cdtA (2.1x10
-2
) and cdtB (1.6x10
-5
) but not for cdtA against cdtB (0.11) at p<0.05. These indicate
more efficient transcription of tcdE and possibly the rest of PaLoc polycistron genes. Although
comparatively lower band intensities for cdt were already measurable at early exponential growth
phase, distinct staining was only apparent at the 12th h, whereas tcdE transcripts were evident as
early as the 7th h of growth (Fig. 3.6E-G). Furthermore, tcdE expression peaked from 14th to the
18th h (stationary phase) while those of cdts were observable at the 16th to 18th h, indeed
implying earlier production of PaLoc toxin genes.
Real-time quantitation confirmed higher transcription of tcdE over cdt. Normalized
corrected mean threshold cycle values (C
T
) were consistently and significantly higher for both
cdtA (3.1x10
-4
) and cdtB (3.2x10
-6
) relative to tcdE (Fig. 3.6I). Accordingly, mean calculated
cdtB and cdtA amplicon concentration for all timepoints exhibited a 4.3-fold and 1.5-fold
increase, respectively, compared to tcdE (Fig. 3.6J). Conforming with RT-PCR results, initial
two-fold rise in tcdE mRNA concentration was evident at the 7th h. In addition, peak
concentration for cdtA (42.19) and cdtB (15.23) were recorded earlier in real-time measurements
at the 14th h indicating improved sensitivity of fluorogenic detection system.
73
Figure 3.5. Comparison of growth-dependent transcription between complete and
truncated cdt through RT-PCR. A, C. difficile 20309 growth profile. B, total RNA (16 h)
of lanes 1-4 were treated with DNAse I (60 µg/ml) while lanes 5-8 were untreated.
RNAse A (40 µg/ml) were subsequently added to lanes 1, 2, 5 and 6 before first-strand
synthesis for lanes 1, 3, 5 and 7 was carried out. PCR amplification was conducted using
primer pairs cda-F1 and cda5. C-D, cdtA portion amplified from 20309 and 19126
cDNA, respectively, using primer pairs cda1 and cda5. E-F, cdtB portion from 20309
and 19126 cDNA, respectively, using primer pairs cdb3 and cdb7. G, cdtA and cdtB
portions from20309 using cda4 and cdb4. (+), genomic DNA was used as template; (-),
total RNA without reverse transcription as template; M, DNA ladder.
74
75
Figure 3.6. Comparison of growth-dependent transcription between cdt and tcdE of
20309 through real-time RT-PCR. A-C, optimization at various annealing temperature
indicated for cdtA, cdtB and tcdE amplification, respectively. D, 16S rRNA expression at
indicated times. E-G, time-dependent mRNA expression of cdtA, cdtB and tcdE,
respectively. Lanes 1 contained 20309 total RNA with no first-strand synthesis. Lanes
2-4 and 5-12 had 11186 and 20309 cDNA template, respectively, reverse transcribed
from total RNA (2 µl) extracted at indicated timepoints. H, comparative expression with
respect to internal control (densitometric pixel unit). I and J, relative C
T
and calculated
concentration values, respectively, with respect to internal control (arbitrary unit). M,
DNA ladder. Data points represent mean pixel values from triplicate measurements
which were corrected by subtraction from non-template background over the total area
measured, then normalized with reference to 16S rRNA values.
76
3.2.7. Expression of wild-type and mutant C. difficile 20309 CDTa
CDTa (52 kDa) and CDTb (99 kDa) were purified as 6XHis-fusion proteins from
recombinant pQE-30 vectors pDA577 under tight regulation by a plasmid-encoded repressor in E.
coli M15 designated as SK1214 and pDA578 in SK1215, respectively. To establish identity of
cdtA from 20309 as an ADPRT-encoding gene and to localize functionally important amino acid
components, the ability of CDTa to ADP-ribosylate G-actin was assessed and compared with
products of mutant constructs with modified amino acid residues that are conserved among ADP-
ribosyltranferases (Fig. 3.7) and possibly involved in NAD binding or enzyme activities.
Substrate pDA577 which was subjected to site-directed mutagenesis, transformed into DH5α-T1
and reintroduced into pQE-30, yielded clones producing mutated CDTa listed in Table 2.1.
Mutations were confirmed through restriction analysis, size comparison of purified mutant toxins
with recombinant wild-type in SDS-PAGE, and sequencing. Gel analysis showed similar
restriction band sizes, pattern (Fig. 3.8A) and protein mass weight of approximately 52 kDa as
wild-type CDTa (Fig. 3.8B,C,D), indicating identity of mutant toxins with substitution of amino
acid residues ascertained and illustrated in sequence electropherograms (Fig. 3.9).
3.2.8. Conserved ADP-ribosyltransferase residues are essential for enzymatic function
We then investigated the ability of CDTa and its variant forms to mediate direct
hydrolysis of [
32
P]NAD and attachment thereafter of radiolabeled ADP-ribose moiety to muscle
G-actin in an in vitro ADP-ribosylation assay. Modified toxins include CDTa
Y344N
and CDTa
Y344P
whose Tyr344 was replaced with asparagine and proline, respectively; CDTa
R345P
whose Arg345
was replaced with proline, CDTa
S388H
whose Ser388 was replaced with histidine and CDTa
E430A
which had a glutamic acid to alanine substitution in residue 430 (Fig. 3.9). Not observed in
control and other test lanes, multiple trial phosphorscreen images for wild-type and CDTa
Y344P
-
treated lanes, consistently showed a single radiolabeled band of 42 kDa that corresponds to the
size of monomeric actin (Fig. 3.10A), indicating specificity in substrate labeling.
77
Most mutant toxins exhibited undetectable or weak labeling by CDTa
Y344N
at 4.2% of
wild-type band intensity in pixel unit (100%), except for CDTa
Y344P
which exhibited 97.8% of
wild-type activity (Fig. 3.10A). Complete loss or significant reduction in wild-type ARTase
activities implicate Tyr344, Arg345, Ser388 and Glu430 as essential components for optimum
biological function of CDTa. Our results also suggest that substitution of Tyr344 is not as crucial
since it could be replaced by non-polar amino acid proline with differential but only partial
reduction in enzymatic activities. This has been established in assays with increasing NAD to
derive initial rate data for enzyme kinetics where mixtures containing CDTa
Y344P
showed gradual
increase in ADP-ribose labeling of actin as the wild-type (Fig. 3.10B).
UV Photolabeling of CDTa with [
32
P]NAD was performed to further explore mechanistic
basis for the attenuation or inhibition of ARTase activities by variant CDTa. Binding of NAD to
CDTa
R345P
, CDTa
S388H
and CDTa
E430A
was beyond the detection limit suggesting that inhibition in
ARTase activities is largely if not entirely attributable to steric hindrances posed by altered
residue side chains in the docking of NAD to CDTa (Fig. 3.10C). On the other hand, disruption
in NAD interaction with both CDTa and actin appeared contributory in Tyr344 mutations as only
partial 23.7% and 41.6% reduction in NAD photoinsertion of the wild-type, were observed on
asparagine and proline replacements, respectively (Fig. 3.10C). Furthermore, photolabeling in
both Tyr344 mutants had no significant difference from wild-type (p>0.05, n=3), unlike for
ARTase, whereby asparagine replacement showed significant difference to wild-type activities
(p=2.1X10
-3
, n=4) while proline replacement did not (p=0.67, n=4). This indicates that
substantial loss in CDTa
Y344N
ARTase activities is not predominantly caused by obstruction in
NAD binding, but possibly due to weakened NAD hydrolysis or interaction with actin.
78
Figure 3.7. Alignment of conserved amino acids (red letter) of ADPRT toxins: CDTa,
C. difficile 20309 wild-type toxin (AF271719); SK1238, SK1252, SK1228, SK1236 and
SK1242 produce CDTa mutated toxins (Table 2.1); Ia, C. perfringens iota (X73562); C2,
C. botulinum (D63903); C3, C. botulinum (M74038); CT: Vibrio cholerae (X58785);
PT: Bordetella pertussis (E01352); LT: E. coli heat-labile enterotoxin (M17894); and
Bacillus cereus VIP2 (Han et al. 1999). Putative functions of the 3 conserved regions are
indicated (yellow shade).
CDTa 298 LTV
YR
RSGP 341 PNFI
STS
IGSV 381 GYAG
E
Y
E
VLLN
SK1238 298 LTV
NRRSGP 341 PNFISTSIGSV 381 GYAGEYEVLLN
SK1252 298 LTV
PRRSGP 341 PNFISTSIGSV 381 GYAGEYEVLLN
SK1228 298 LTV
YPRSGP 341 PNFISTSIGSV 381 GYAGEYEVLLN
SK1236 298 LTV
YRRSGP 341 PNFIHTSIGSV 381 GYAGEYEVLLN
SK1242 298 LTV
YRRSGP 341 PNFISTSIGSV 381 GYAGEYAVLLN
Ia 291 LIV
YRRSGP 334 PNFISTSIGSV 374 GYAGEYEVLLN
C2 295 LIA
YRRVDG 344 LSFSSTSLKST 383 GFQDEQEILLN
C3 84 IILF
RGDDP 130 YGYISTSLMN 168 AFAGQLEMLLP
CT 4 KL
YRADSR 58 GYVSTSISLR 106 PHPDEQEVSAL
PT 6 TV
YRYDSR 48 SAFVSTSSSRR 123 LATYQSEYLAH
LT 4 KL
YRADSR 58 GYVSTSLSLR 106 PHPYEQEVSAL
VIP2 345 ITV
YRWCG 383 GYMSTSLSSE 422 GFASEKEILLDK
e
-
transfer/
H-bonding
NAD
binding
H-bonding/
salt bridge
formation/
NAD binding
79
Figure 3.8. Comparison of recombinant CCUG 20309 wild-type and mutant cdt and
purified His-fusion CDT and mutant CDTa proteins. A, restriction analysis of cdt
constructs digested with BamHI and HindIII. Two microliter aliquot from each
methylation and mutation reaction mixture containing 100 ng of pDA577 were loaded per
lane. Lane 1contained digested pQE-30E whereas lanes 2-7 had digested pDA577,
pDA587, pDA594, pDA582, pDA586 and pDA589, respectively (see Table 2.1). M, 1
kb plus DNA ladder (Gibco BRL). B, purified CDTa expressed from pDA577 of
SK1214 and visualized in 12% SDS-PAGE. Lanes 1-8 contained protein fractions from
uninduced clones, induced clones, cell lysate, flow-thru, buffer D1, D2, E1 and E2
eluates, respectively. M, high molecular weight protein ladder (Bio-Rad). C, CDTb
expressed from pDA578 of SK1215 in 12% SDS-PAGE. Lanes 1-6 contained protein
fractions from uninduced clones, induced, cell lysate, flow-thru, buffer D1 and D2
eluates, respectively. M, high molecular weight protein ladder. D, Lane 1 contained
cellular extract from pQE-30 of induced SK1203. Lane 2 had CDTa and CDTb
expressed from pDA576 of SK1216 in 10% SDS-PAGE. Lanes 3-7 had mutant CDTa
expressed from mutated pDA577 including pDA587, pDA594, pDA582, pDA586 and
pDA589, respectively (see Table 2.1). M, high range protein molecular weight standards
(Gibco BRL).
80
SK1214 (wild-type)
1018 AAT TTA ACT GTA TAT AGA AGA TCT GCT CCT
340 N L T V Y R R S A P
SK1238 (Y344N)
1018 AAT TTA ACT GTA
AAT AGA AGA TCT GCT CCT
340 N L T V
N R R S A P
SK1252 (Y344P)
1018 AAT TTA ACT GTA CCT AGA AGA TCT GCT CCT
340 N L T V
P R R S A P
SK1228 (R345P)
1018 AAT TTA ACT GTA TAT CCA AGA TCT GCT CCT
340 N L T V Y
P R S A P
SK1214 (wild-type)
1147 TAT CCA AAC TTT ATT AGT ACT AGT ATT GGT
383 Y P N F I S T S I G
SK1236 (S388H)
1147 TAT CCA AAC TTT ATT
CAT ACT AGT ATT GGT
383 Y P N F I
H T S I G
SK1214 (wild-type)
1270 GGT TAT GCA GGT GAA TAT GAA GTG CTT TTA
424 G Y A G E Y E V L L
SK1242 (E430A)
1270 GGT TAT GCA GGT GAA TAT G
CA GTG CTT TTA
424 G Y A G E Y
A V L L
Figure 3.9. Nucleotide sequences of wild-type and mutant CDTa as shown in
electropherogram results. Modified sequences are indicated in red text.
81
Figure 3.10. ADP-ribosyltransferase activities of various CDTa isoforms in their ability
to radiolabel rabbit skeletal muscle actin with [adenylate-
32
P] ADP-ribose moiety. A,
Protein profile in 12% SDS-PAGE (left) and phosphorscreen autoradiogram showing
ARTase reactions of CDTa variants. Lane 1, contained reaction mixture with purified
wild-type CDTa from SK1214; lane 2 with SK1203; lane 3, with no CDT; lanes 4-8, with
CDTa
Y344N
, CDTa
Y344P
, CDTa
R345P
, CDTa
S388H
and CDTa
E430A
. B, protein profile (upper
panel) and autoradiogram (lower panel) showing ARTase reactions at increasing NAD
concentrations. Lanes 1-3, 4-6, 7-9, 10-12, 13-15 and 16-18 contained wild-type CDTa,
CDTa
Y344N
, CDTa
Y344P
, CDTa
R345P
, CDTa
S388H
and CDTa
E430A
, respectively at 2, 6 and
12 nCi concentrations of [
32
P]NAD. C. NAD photoaffinity labeling of CDTa from
SK1214, CDTa from SK1203, CDTa
Y344N
, CDTa
Y344P
, CDTa
R345P
, CDTa
S388H
and
CDTa
E430A
(lanes 1-7). M, BenchMark protein ladder (Invitrogen).
82
3.3. Discussion
Global increase in morbidity and mortality caused by C. difficile has encouraged
exhaustive research on disease pathogenesis. Pathogenic C. difficile 19126 produces high levels
of toxins A and B and can cause severe enterocolitis and death in hamsters (Culture Collection,
University of Göteborg, Sweden), while nonpathogenic 11186 does not produce toxin A nor toxin
B and does not cause disease in hamsters (Virginia Polytechnic Institute). We have exploited this
phenotypic disparity to perform genomic subtraction on the premise that genes found in 19126
which are absent in 11186 may encode for important proteins for pathogenesis. Repeated cycles
of subtractive hybridization eliminated homologous interspecies DNA touted to be housekeeping
determinants of basic metabolic processes.
The specificity of enriched subtraction products was realized when it hybridized with
DNA from known virulent C. difficile strains and failed to do so with nonpathogen DNA and
library host strain containing the vector only. Moreover, detected clone fragments showed
homology to annotated virulence factors of C. difficile and other organisms (Table 3.1).
Several
clones contained PaLoc genes including partial copies of adjacent tcdA and tcdE and gene
portions of tcdB encoding for toxins involved in the attachment of glucose moiety from donor
UDP-glucose to acceptor Thr37 of GTP-binding RhoA protein (Just, Selzer et al. 1995a; Just,
Wilm et al. 1995b).
Other toxin homologs include Corynebacterium diphtheriae Tox protein,
Aeromonas hydrophila alpha-hemolysin and ADP-ribosylating toxin which was pursued further
in this study. GS110 insert matched a short N-terminal sequence of fragment A (193 kDa) of C.
diphtheriae toxin which is part of a proteolytically activated holotoxin that ADP-ribosylates and
inactivates elongation factor 2 (Collier 1967; Bishai, Rappuoli et al. 1987). GS157 showed 65%
identity to alpha-hemolysin and although amino acid coverage is not extensive, its presence in
pathogenic C. difficile is warranted since hemolytic toxin causes septic arthritis by promoting
secretion of proinflammatory factors from immune cells (Krull, Dold et al. 1996). Secretion of a
similar protein which participates in colonic inflammation, a sequelae of infection, is not
83
surprising. The toxin has also been reported to mediate cell lysis by forming heptamers upon
insertion into target membrane (Song, Hobaugh et al. 1996) and to aid S. aureus in biofilm
formation on plastic surfaces (Caiazza and O'Toole 2003). A similar protein may be at work for
efficient C. difficile adsorption and colonization of intestinal epithelium as the polysaccharide
matrix formed by multiple aggregate not only stabilize but also protects the colony from
antimicrobials and host defense onslaught. In fact, a related homolog C. perfringens luxS
(Ohtani, Hayashi et al. 2002) which participates in quorum sensing has been recently isolated
with its characterization under way (Song, personal communication). Other virulence homologs
include catalases from diverse species (Bethards, Skadsen et al. 1987; Wood, Setubal et al. 2001)
which protect organisms from toxic peroxides and cell damaging activated oxygen radicals whose
elimination is a key step to survival (Markillie, Varnum et al. 1999). A socE portion was also
matched in GS101, whose complete gene expression in C. difficile may participate in the
regulation of spore-forming process (Crawford Jr and Shimkets 2000). Of special interest is a
structural S-layer homolog traced to C. difficile strain 630. As cell envelope component and due
to its propensity to extracellular matrix-binding, the S-layer can enhance virulence by facilitating
bacterial adhesion to target membrane surface (Doig, Emody et al. 1992) and resisting interaction
with host immune effectors (Kotiranta, Lounatmaa et al. 1997). The crystalline protein lattice
linked to cell wall teichuronic acid polymer also serve as portal for the diffusion of exoenzymes
that are adhered to the structure (Sleytr, Messner et al. 1993; Lemaire, Myras et al. 1998).
Homology to unknown and hypothetical proteins was detected at 26%, a proportion
which approximates those in complete genome sequences. For example, 511 out of 2185 (23%)
ORFs in the D. radiodurans genome matched with hypothetical protein (White, Eisen et al. 1999)
while nearly 40% in E.coli K-12 remains uncharacterized (Blattner, Plunkett et al. 1997). Even
closely related C. perfringens contains 44.1% of ORFs that are similar to proteins with either no
known function or with unique sequences (Shimizu, Ohtani et al. 2002). Detection of such
sequences underscores the efficiency of the subtraction process.
84
GS80 insert has homology to cdtB portion of the binary cdt in strain CD196 of toxinotype
VIII (Stubbs, Rupnik et al. 2000). Our preliminary survey revealed 39% of truncated form in
19126 and among clinical strains. The complete binary genotype was solely traced to CCUG
20309, a unique cytotoxic serotype F strain with full tcdB but truncated tcdA genes. However,
despite the large toxin A deletion (3’-end) and possession of a weak enterotoxin undetectable in
immunoassays (Borriello, Wren et al. 1992), vigilant monitoring of its distribution must be
sustained since it has been shown to cause diseases even in animals and has been increasingly
implicated in outbreaks of antibiotic associated diarrhea during the past years (Kato, Kato et al.
1998; Alfa, Kabani et al. 2000). Given these, the contribution of CDT in pathogenesis as an
ADPRT is potentially considerable.
Analysis of 19126 and 20309 cdt gene regions also revealed the presence of identical
repeat sequences as possible transposition remnants of mobile elements such as cryptic phage or
insertion sequences (IS). In Shigella flexneri genome (Wei, Goldberg et al. 2003), 46 such
insertion sequences were found as gene-flanking direct repeats, while in E.coli K-12, these were
classified into groups and even found to comprise large genomic segments of 5.7 to 9.6 kb in
length (Bachellier, Clement et al. 1997; Clement, Wilde et al. 1999). Mobile DNA can
encourage intra- and interstrain promiscuity which is manifested as intragenic punctuation or
disruption resulting in genetic rearrangement.
Genetic mobility through horizontal transfer could be manifested as heterogeneity in cdt
characterized by block deletion in 19126 and cassette insertion in 20309. As patches of direct
repeats were located along boundaries or internal to cdt of 20309 and 19126, the locus shows
properties of a pathogenicity islet or its being part of a larger pathogenicity island (PAI), which
are composed of virulence gene clusters interrupted by IS, transposons, phage integrons or
plasmids (Groisman and Ochman 1996; Hacker, Blum-Oehler et al. 1997). In S. flexneri
chromosome, several islands with such elements have also been identified including the SHI
series encoding for transporter, enterotoxin (Al-Hasani, Rajakumar et al. 2001), antibiotic
85
resistance factor (Turner, Luck et al. 2001), sideophore system involved in iron acquisition (Moss
and Vaughan 1988) and criR regulator involved in the expression of invasion plasmid antigen
(Walker and Verma 2002). The PaLoc locus is one pathogenicity islet in C. difficile. It was
replaced with a 127 bp portion carrying repeats with predicted secondary structure in 11186. This
may have been the entry point of IS-flanked toxin cluster either through homologous
recombination or transposon-mediated insertion, a process reminiscent in Bacteroides fragilis
whereby a 17 bp sequence in the nontoxigenic strain served as target for insertion of a
pathogenicity islet containing the tandem enterotoxin fragilysin and metalloprotease genes
(Moncrief, Duncan et al. 1998). A parallel event may have occurred in the creation of varying cdt
genotypes and as such, it is tempting to speculate that 19126 with truncated cdt may have been a
descendant of 20309 after it has undergone block deletion. Furthermore, it would be interesting
to explore adjacent sequences beyond the PaLoc and cdt in order to determine whether the loci
comprise a more extensive pathogenicity island.
Aside from variations in interstrain toxin genotype, non-conforming regulation in
transcription may account for differences in the degree of pathogenicity. In this regard, we have
analyzed the transcription pattern of the cdt relative to PaLoc toxin genes to elucidate the
interrelations between Tcd and CDT production. While expression studies have aided in the
investigation of PaLoc gene properties (Hundsberger, Braun et al. 1997), similar data on cdt is
lacking despite its importance in functional evaluation and development of effective therapeutic
intervention. As such, we have characterized the cdt regulatory region before comparison of
mRNA production with a PaLoc polycistron gene, tcdE with respect to an internal standard
whose production is maintained at relatively high but constant level.
For comparative studies, amplicons were first quantitated as band densities then
confirmed as significant fluorogenic threshold intensities recognized in real-time detection. The
level of fluorescence is proportional to exponential increase in labeled amplicon products, hence,
86
samples with minimal target sequence would require more cycles to generate sufficiently
significant signal that would result in higher C
T
value transposable into concentration.
Similar pattern and magnitude in mRNA production of cdtA and cdtB and absence of
consensus promoter sequence upstream of cdtB, suggest possible bicistronic configuration of cdt
operon. Compared to tcdE, cdt had significantly lower transcript level which conforms with
earlier findings on high expression of PaLoc toxins TcdA and TcdB at a ratio of 3:1 (von Eichel-
Streiber, Harperath et al. 1987). Readthrough mRNA screening of the PaLoc identified tcdE as
part of multiple transcription units such as one comprised of tcdD, tcdB, tcdE and tcdA, which is
transcribed in one direction opposite the tcdC cistron (Hundsberger, Braun et al. 1997).
Separation of cistron units was revealed by absence of readthrough transcript and detection of
bidirectional terminator including one that is located at the tcdA and tcdC intergenic region (von
Eichel-Streiber and Sauerborn 1990). Furthermore, presence of multiple transcription initiation
sites indicated the presence of several promoters within the PaLoc, leading to elevated gene
expression due to combined monocistronic and polycistronic transcription. Thus, more efficient
transcription of tcdE compared to cdt is not surprising.
Differential virulence gene expression is not unique to C. difficile. Recently,
transcription of streptococcal capsular polysaccharide genes was revealed to have marked
discrepancies through time and in various growth conditions (Ogunniyi, Giammarinaro et al.
2002). Unsynchronized regulation appears universal and necessary as living cells coordinate
protein synthesis for physiologic adaptation. As such, differential cdt and tcdE expression may
be due to discrepancy in promotional activities despite controlled amplification efficiency
through usage of primers that would anneal at similar temperatures and amplify products of
comparable sizes. In addition, stringent experimental controls were also employed to minimize
the effect of varying transcript stability and turnover rate, generating consistent intra- and inter-
assay results. However, although RT-PCR has been used extensively in many fields particularly
in diagnostics and shown to be sensitive, reproducible and applicable for simultaneous