Design and analysis of optimal resource allocation policies in wireless networks
Bạn đang xem bản rút gọn của tài liệu. Xem và tải ngay bản đầy đủ của tài liệu tại đây (3.21 MB, 173 trang )
DESIGN AND ANALYSIS OF
OPTIMAL RESOURCE ALLOCATION POLICIES
IN WIRELESS NETWORKS
WANG BANG
NATIONAL UNIVERSITY OF SINGAPORE
2004
DESIGN AND ANALYSIS OF
OPTIMAL RESOURCE ALLOCATION POLICIES
IN WIRELESS NETWORKS
BY
WANG BANG
(M.Eng., B.Eng., HUST, PRC )
A THESIS SUBMITTED
FOR THE DEGREE OF DOCTOR OF PHYLOSOPHY
DEPARTMENT OF ELECTRICAL & COM PUTER ENGINEERING
NATIONAL UNIVERSITY OF SINGAPORE
2004
Dedication
To my Mama and Papa and to my wife Minghua
Acknowledgements
I would like to take this opportunity to express my deepest thanks to many who have
contributed to the production of this thesis. Without their support, this thesis could
not have been written. My thesis advisor, Associate Professor Chua Kee Chaing,
has my sincerest gratitude. Both this thesis and my personal development have been
benefited greatly from his guidance, advices, encouragements, rigorous research style.
I feel fortunate to have been his student.
I would like to thank the Department of Electrical and Computer Engineering and
the National University of Singapore for the kind offer of a research scholarship. Also,
I thank Siemens ICM for providing a chance to have worked on an industrial project in
Munich Germany. I meet many wonderful colleagues, among whom I specially thank
Dr. Robert Kutka and Dr. Hans-Peter Schwefel for their kind help when working in
Munich.
I must also thank my parents, my wife and my parents in law for their constant
caring and support. My sincere thanks to my wife, Xu Minghua, whose endless and
selfless love is always an important part of my life. My deepest thanks go to my
parents in China for their prayerful supports in my decision to go on to graduate study
in Singapore.
Finally, I would like to express my gratitude to my colleagues and friends in Open
Source Software laboratory for providing hearty help and happy hours.
ii
Conte nts
List of Figures ix
List of Tables x
List of Abbreviations xii
List of Symbols xii
Abstract xiv
1 Introduction 1
1.1 Cellular Mobile Communications . . . . . . . . . . . . . . . . . . . . . 1
1.1.1 3G and UMTS . . . . . . . . . . . . . . . . . . . . . . . . . . . 3
1.2 Resource Allocation in Wireless Networks:
Challenges and Issues . . . . . . . . . . . . . . . . . . . . . . . . . . . . 4
1.2.1 Wireless Services and QoS Issues in UMTS . . . . . . . . . . . . 4
1.2.2 Hostile Radio Channel . . . . . . . . . . . . . . . . . . . . . . . 7
1.2.3 Some Management Modules . . . . . . . . . . . . . . . . . . . . 8
1.3 Related Works . . . . . . . . . . . . . . . . . . . . . . . . . . . . . . . . 10
1.3.1 Optimal Policy Design . . . . . . . . . . . . . . . . . . . . . . . 10
1.3.2 Fair Resource Allocation . . . . . . . . . . . . . . . . . . . . . . 12
1.4 Contributions of This Thes is . . . . . . . . . . . . . . . . . . . . . . . . 14
1.4.1 Optimal Power Allocation Policies . . . . . . . . . . . . . . . . . 14
1.4.2 Optimal Transmission Control Policies . . . . . . . . . . . . . . 15
1.4.3 Optimal Rate Allocation Policies . . . . . . . . . . . . . . . . . 15
iii
CONTENTS Page iv
1.4.4 Fair-effort Based Resource Allocation . . . . . . . . . . . . . . . 16
1.5 Thesis Organization . . . . . . . . . . . . . . . . . . . . . . . . . . . . . 17
2 System Models and Some Markov Decision Theory 18
2.1 Basic System Models . . . . . . . . . . . . . . . . . . . . . . . . . . . . 18
2.1.1 Discrete System . . . . . . . . . . . . . . . . . . . . . . . . . . . 19
2.1.2 Transmission Model . . . . . . . . . . . . . . . . . . . . . . . . . 19
2.2 Some Markov Decision Theory . . . . . . . . . . . . . . . . . . . . . . . 21
2.2.1 Markov Decision Processes . . . . . . . . . . . . . . . . . . . . . 22
2.2.2 Optimality Criteria . . . . . . . . . . . . . . . . . . . . . . . . . 24
2.2.3 Stationary Optimal Polices . . . . . . . . . . . . . . . . . . . . . 25
2.2.4 Computation of Optimal Policies . . . . . . . . . . . . . . . . . 28
2.3 Summary . . . . . . . . . . . . . . . . . . . . . . . . . . . . . . . . . . 30
3 Optimal Power Allocation Policies 31
3.1 Channel Model . . . . . . . . . . . . . . . . . . . . . . . . . . . . . . . 31
3.2 Problem Formulation . . . . . . . . . . . . . . . . . . . . . . . . . . . . 34
3.2.1 System Model . . . . . . . . . . . . . . . . . . . . . . . . . . . . 34
3.2.2 Energy Efficient File Transfer with Delay Constraints . . . . . . 35
3.3 Optimal Policy with Average Delay Constraint . . . . . . . . . . . . . . 38
3.3.1 The Stochastic Shortest Path Problem . . . . . . . . . . . . . . 38
3.3.2 Numerical Examples . . . . . . . . . . . . . . . . . . . . . . . . 41
3.4 Optimal Policy with Strict Delay Constraint . . . . . . . . . . . . . . . 48
3.4.1 The Finite Horizon Dynamic Programming Problem . . . . . . . 48
3.4.2 Numerical Examples . . . . . . . . . . . . . . . . . . . . . . . . 49
3.5 Summary . . . . . . . . . . . . . . . . . . . . . . . . . . . . . . . . . . 52
4 Optimal Transmission Control Policies 54
4.1 Problem Formulation . . . . . . . . . . . . . . . . . . . . . . . . . . . . 54
4.2 Average Cost Optimal Policy . . . . . . . . . . . . . . . . . . . . . . . 56
4.3 Property of Optimal Policies . . . . . . . . . . . . . . . . . . . . . . . . 57
4.4 Numerical Examples . . . . . . . . . . . . . . . . . . . . . . . . . . . . 65
iv
CONTENTS Page v
4.5 Summary . . . . . . . . . . . . . . . . . . . . . . . . . . . . . . . . . . 74
5 Optimal Rate Allocation Policies 79
5.1 Problem Formulation . . . . . . . . . . . . . . . . . . . . . . . . . . . . 79
5.2 Monotone Optimal Policies . . . . . . . . . . . . . . . . . . . . . . . . . 83
5.3 A Case Study . . . . . . . . . . . . . . . . . . . . . . . . . . . . . . . . 88
5.3.1 Existence of Stationary Average Optimal Policies . . . . . . . . 88
5.3.2 Choice of Cost Functions . . . . . . . . . . . . . . . . . . . . . . 90
5.3.3 Average Delay Bounds . . . . . . . . . . . . . . . . . . . . . . . 92
5.3.4 Numerical Examples . . . . . . . . . . . . . . . . . . . . . . . . 96
5.4 A Class of Simple Policies . . . . . . . . . . . . . . . . . . . . . . . . . 99
5.4.1 A Class of Threshold-based Simple Policies . . . . . . . . . . . . 100
5.4.2 An Upper Bound for Average Delay . . . . . . . . . . . . . . . . 101
5.4.3 Numerical Examples . . . . . . . . . . . . . . . . . . . . . . . . 104
5.5 Extension to The Existence of Competitions . . . . . . . . . . . . . . . 108
5.5.1 Competition Across Users . . . . . . . . . . . . . . . . . . . . . 109
5.5.2 Extended Problem Formulation . . . . . . . . . . . . . . . . . . 110
5.5.3 Characteristic of Value Function . . . . . . . . . . . . . . . . . . 112
5.5.4 Property of Optimal Policies . . . . . . . . . . . . . . . . . . . . 117
5.6 Summary . . . . . . . . . . . . . . . . . . . . . . . . . . . . . . . . . . 119
6 Fair-effort Based Resource Allocation 120
6.1 Problem Description . . . . . . . . . . . . . . . . . . . . . . . . . . . . 120
6.2 Fair-effort Resource Sharing . . . . . . . . . . . . . . . . . . . . . . . . 123
6.2.1 The Fair-effort Resource Sharing Model . . . . . . . . . . . . . . 123
6.2.2 A Fair-Effort Crediting Algorithm . . . . . . . . . . . . . . . . . 125
6.3 A Resource Allocation Scheme . . . . . . . . . . . . . . . . . . . . . . . 127
6.3.1 Optimal Power Allocation . . . . . . . . . . . . . . . . . . . . . 127
6.3.2 Transmission Scheduling and Rate Allocation . . . . . . . . . . 129
6.4 Numerical Examples . . . . . . . . . . . . . . . . . . . . . . . . . . . . 132
6.5 Summary . . . . . . . . . . . . . . . . . . . . . . . . . . . . . . . . . . 140
v
CONTENTS Page vi
7 Conclusions and Future Work 142
7.1 Conclusions . . . . . . . . . . . . . . . . . . . . . . . . . . . . . . . . . 142
7.2 Some Future Research Directions . . . . . . . . . . . . . . . . . . . . . 144
Bibliography 147
vi
List of Figures
1.1 System model of cellular mobile communications . . . . . . . . . . . . . 2
1.2 UMTS QoS classes and example allocations [22]. . . . . . . . . . . . . . 5
2.1 Transmission model example 1 – A single user transmits with different
transmission powers, represented by different colors in frames. . . . . . 20
2.2 Transmission model example 2 – A single user transmits with different
transmission rates, represented by different number of packets in frames 21
3.1 System model . . . . . . . . . . . . . . . . . . . . . . . . . . . . . . . . 34
3.2 Example realizations of file transfer over a M arkovian fading channel . 36
3.3 Performance comparison of different persistent policies with the optimal
policy (channel states = 8, available actions {0, 6, 8, 10, 12, 14}, β =
1.0, D
c
= 0) . . . . . . . . . . . . . . . . . . . . . . . . . . . . . . . . . 45
3.4 The average total costs of different optimal policies (channel states = 8,
A={0, 6, 8, 10, 12, 14} and β = 1.0). . . . . . . . . . . . . . . . . . . . . 46
3.5 The average total powers of different optimal policies (channel states =
8, A={0, 6, 8, 10, 12, 14} and β = 1). . . . . . . . . . . . . . . . . . . . . 47
3.6 The average total delay of different optimal policies (channel states =
8, A={0, 6, 8, 10, 12, 14} and β = 1). . . . . . . . . . . . . . . . . . . . . 48
3.7 Optimal actions when there are 5 packets left in the buffer for all dec ision
epochs. (c
0
= 500 and c
1
= 2) . . . . . . . . . . . . . . . . . . . . . . . 50
3.8 Optimal actions when there are 10 packets left in the buffer for all deci-
sion epo chs. (c
0
= 500 and c
1
= 2) . . . . . . . . . . . . . . . . . . . . . 51
vii
LIST OF FIGURES Page viii
3.9 Comparisons between different policies within the decision period (T
D
=
30). . . . . . . . . . . . . . . . . . . . . . . . . . . . . . . . . . . . . . 52
4.1 System model . . . . . . . . . . . . . . . . . . . . . . . . . . . . . . . . 55
4.2 Buffer threshold for starting transmission in channel state 1 of a 2-state
Markov channel as a function of channel memory. . . . . . . . . . . . . 70
4.3 Buffer threshold for starting transmission in channel state 1 and 2 of a
4-state Markov channel as a function of channel memory. . . . . . . . . 71
4.4 Buffer threshold for starting transmission in channel state 1, 2 and 3 of
a 8-state Markov channel as a function of channel memory. . . . . . . . 72
4.5 Cost for the 2-state Markov channel as a function of channel memory. . 73
4.6 Cost for the 4-state Markov channel as a function of channel memory. . 74
4.7 Cost for the 8-state Markov channel as a function of channel memory. . 75
4.8 Goodput for the 2-state Markov channel as a function of channel memory. 75
4.9 Goodput for the 4-state Markov channel as a function of channel memory. 76
4.10 Goodput for the 8-state Markov channel as a function of channel memory. 76
4.11 Average buffer occupancy for the 2-state Markov channel as a function
of channel memory. . . . . . . . . . . . . . . . . . . . . . . . . . . . . . 77
4.12 Average buffer occupancy for the 2-state Markov channel as a function
of channel memory. . . . . . . . . . . . . . . . . . . . . . . . . . . . . . 77
4.13 Average buffer occupancy for the 2-state Markov channel as a function
of channel memory. . . . . . . . . . . . . . . . . . . . . . . . . . . . . . 78
5.1 System model — A service rate controlled queueing system. . . . . . . 80
5.2 Optimal policies with respect to different c
0
. . . . . . . . . . . . . . . 96
5.3 Average costs of different p olicies . . . . . . . . . . . . . . . . . . . . . 98
5.4 Average delay and average buffer occupancy of different policies . . . . 99
5.5 Examples of f(r) (Q = 1/(1 + λ) and a = 2λ) . . . . . . . . . . . . . . 105
5.6 Average delay and delay bound of different optimal policies . . . . . . . 106
5.7 Policy value of optimal policies with different number of available actions 107
5.8 Average delay and delay bound of optimal policies with different number
of available actions . . . . . . . . . . . . . . . . . . . . . . . . . . . . . 108
viii
LIST OF FIGURES Page ix
5.9 System model of the extended problem . . . . . . . . . . . . . . . . . . 111
6.1 System model . . . . . . . . . . . . . . . . . . . . . . . . . . . . . . . . 121
6.2 A transmission example in a synchronized CDMA channel . . . . . . . 122
6.3 Different path gain scoring func tions . . . . . . . . . . . . . . . . . . . 130
6.4 Flow chart of the instantaneous data rate allocation algorithm . . . . . 131
6.5 Achievable system capacity vs the number of active users. The system
load increases with the increase of the number of active users . . . . . . 135
6.6 Individual user’s throughput . . . . . . . . . . . . . . . . . . . . . . . . 136
6.7 Worst case analysis of convergence rate . . . . . . . . . . . . . . . . . . 137
6.8 System average delay vs the number of active users. The system load
increases with the increase of the number of active users. . . . . . . . . 138
6.9 Average delay of data users with different locations in stationary scenario
(the number of s imulated data users is labelled below each sub-figure) . 139
6.10 System average delay vs the number of data users. The system load
increases with the increase of the number of users. . . . . . . . . . . . 140
6.11 Average delay of selected individual data users and average delay of all
simulated data users in one run of simulation under mobility scenario
(the number of s imulated data users is labelled below each sub-figure) . 141
ix
List of Tables
1.1 Value ranges of UMTS radio bearer QoS attributes (adapted from [21]) 6
3.1 Channel transition matrix (h
ij
= 0 for all |i − j| > 1, f
d
= 50Hz,
R
s
= 62000 symbols/second,M = 8,
¯
h = 10dB) . . . . . . . . . . . . . . 41
3.2 Channel states and average frame success probabilities (frame length =
5 ms, R
s
= 62000 symbols per second, BCH[31,21,2] and QPSK) . . . . 42
3.3 Optimal actions (β = 1.0, D
c
= 0) . . . . . . . . . . . . . . . . . . . . . 42
3.4 Optimal actions (β = 0.01, D
c
= 0) . . . . . . . . . . . . . . . . . . . . 43
3.5 Average total power consumption and average total transmission delay
(frames) under different initial channel states (β = 1.0, D
c
= 0) . . . . 44
3.6 Average total power consumption and average total transmission delay
(frames) under different initial channel states (β = 0.01, D
c
= 0) . . . . 44
4.1 Optimal Transmission Policies (B = 80) . . . . . . . . . . . . . . . . . 67
4.2 Average Costs Comparison . . . . . . . . . . . . . . . . . . . . . . . . . 68
4.3 Goodput, Occupancy and Delay Comparison . . . . . . . . . . . . . . . 68
5.1 Different Rate Allocation Policies . . . . . . . . . . . . . . . . . . . . . 97
5.2 Performance comparison of different p olicies . . . . . . . . . . . . . . . 98
6.1 Some simulation parameters and their values . . . . . . . . . . . . . . . 133
x
List of Abbreviations
3G The Third Generation Mobile Systems
ACOE Average Cost Optimal Equation
AWGN Additive White Gaussian Noise
BER Bit Error Rate
BS Base Station
CAC Connection Admission Control
CDMA Code Division Multiple Access
CSR Channel State Report
ETSI European Telecommunications Standards Institute
FDMA Frequency Division Multiple Access
FSP Frame Success Probability
GPS Generalized Processor Sharing
GSM Global System for Mobile communication
ITU International Telecommunication Union
MDP Markov Decision Processes
MS Mobile Station
QoS Quality of Services
RLC Radio Link Control
SIR Signal-to-Interference Ratio
SSP Stochastic Shortest Path
TDMA Time Division Multiple Access
UTRA UMTS Terrestrial Radio Access
UMTS Universal Mobile Telecommunication System
WCDMA Wideband CDMA
xi
List of Symbols
∗ Superscript as optimal indication, for example, π
∗
, optimal policy
a An action
A The largest action, e.g., the largest number of packets can be sent
in a frame
A
s
Set of available actions in state s
A System action space, A =
s∈S
A
s
B Buffer limit. B < ∞, a finite buffer; B = ∞, an infinite buffer
C(s, a) Cost structure when the state is s and the action a is selected.
d
t
Decision rule at epoch t
E
π
s
Expected value with respect to policy π conditional on starting state s
f
s
Average frame success probability, either a function or a scalar
N Set of positive integers
N
+
Set of non-negative integers
q(i) Probability of i packets arriving in a frame
Q Geometric distribution parameter
R Set of real numbers
R
+
Set of non-negative real numbers
S System state space
s A scalar system state
s A system state when consisting of more than one component
s
t
State of the system at decision epoch t
T Set of decision epochs
t A decision epoch, often used as a subscript
xii
LIST OF SYMBOLS Page xiii
Tr(s
|s, a) Transition probability that the system occupies state s
at the
next decision epoch if the current state is s and action a is chosen
V
π
(s) Value of policy π with the expected total cost optimal
criterion and starting state s
V
π
ρ
(s) Value of policy π with the expected total discount cost optimal
criterion and starting state s
V
π
(s) Value of policy π with the expected total average cost optimal
criterion and starting state s
π Policy (d
0
, d
1
, ···, d
T −1
), T ≤ ∞
π
∗
Optimal policy
Π Set of all (allowable) policies
µ Stationary policy (d, d, ···) where d
t
= d for all t
ρ Discount factor, 0 ≤ ρ < 1
λ Average number of arrivals in a frame, λ =
i=0
iq(i)
xiii
Abstract
Wireless communications have been progressing steadily in recent years. It is expected
that data traffic generated by services such as web surfing, file transfer, emails and mul-
timedia message services will be dominant in next generation mobile networks. Radio
resource management is very important in that it improves the resource utilization
efficiency while meeting Quality of Service (QoS) requirements. This thesis studies the
design of optimal resource allocation policies for data services in wireless networks. In
particular, this thesis investigates the following resource management issues: power
allocation, transmission control and rate allocation. We first study these issues sepa-
rately from a single user point of view and then jointly from a system viewp oint.
A set of problems is modelled from the stochastic decision theoretic framework
and solved by using the Markov decision processes (MDP) mathematical tool. We first
consider a power allocation problem for transfer of a file by a single sender in a Rayleigh
fading channel. The objective is to minimize the energy required for transfer of the file
while meeting a delay constraint. We show how to convert such a constrained stochastic
optimization problem with an average delay constraint to a standard Markov decision
problem via a Lagrangian approach. It is observed from our numerical results that
transmission power can be substantially reduced with optimal policies which exploit
knowledge of the channel variations to meet the delay constraint.
We next consider a transmission control problem over a time-varying channel and
with general arrival statistics. We show the existence of average cost optimal policies
and explore the properties of the optimal policies. The resulting optimal policies are
proved to have a structural property: when the buffer occupancy is low, the sender can
suspend transmission in some bad channel states to save transmission power; however,
xiv
ABSTRACT Page xv
when the buffer occupancy exceeds some thresholds, the sender has to transmit even
in some bad channel states to avoid increasing the delay cost. We evaluate how the
channel characteristic affects the resulting optimal policies via extensive simulations.
We also consider a rate allocation problem. We prove that the resulting optimal
policies have a monotone property, i.e., the optimal action is nondecreasing with the
system state. We analyze two extreme policies which provide the upper and lower delay
bounds based on the stochastic process comparison technique. A class of one-threshold
based simple policies are proposed to approximate the optimal p olicy and a tight delay
bound is proved. We also extend the rate control problem against the existence of
competitions across users. We then identify the characteristic of the value functions
and the property of optimal policies for such an extended problem
When allocating resource among multiple users, fairness among users is also im-
portant in addition to system utilization efficiency. We propose a new fairness model,
the fair-effort resource sharing model, and a simple credit based algorithm to im-
plement the proposed fairness model. According to our f airness mo del, the resource
share (quota) allocated to a user is proportional to the user’s effort which is consid-
ered as time dependent rather than as fixed. We then present an integrated packet
level resource allocation scheme which consists of optimal power allocation, exhaustive
instantaneous data rate allocation and fair-effort resource sharing. Numerical results
show that fair-effort based fairness is guaranteed with our proposed scheme and that
system efficiency is improved compared to a scheme based on the generalized pro cess or
sharing fairness model.
xv
Chapter 1
Introduction
Cellular mobile communications have been progressing steadily in recent years, f rom
the first and second generation systems to the third generation systems (3G). The ser-
vices that can be supported have also evolved from pure voice service to multimedia
services, including voice, video and data. It is expected that data traffic generated by
services such as web surfing, file transfers, emails and multimedia message service will
be dominant in next generation mobile networks. As different services have different
Quality of Service (QoS) requirements, e.g., delay, error rate, etc., compared to pure
voice services, more flexibility in allocating the radio resources to meet these diverse
requirements is needed. However, radio resources are scarce due to the limited radio
spectrum. Therefore, how to efficiently utilize/allocate radio resources and simulta-
neously to provide the required QoS guarantees is an important topic of research to
enable mobile networks to supp ort heterogeneous services.
1.1 Cellular Mobile Communications
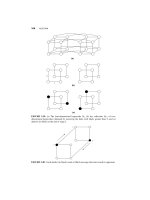
In cellular mobile communications, the geographical area covered by the whole sys-
tem is divided into several contiguous small areas (cells) in which multiple mobile
stations (MS) communicate with a central base station (BS) [65], as shown in Fig. 1.1.
When several mobile stations (mobile users) wish to communicate with the base sta-
tion through a common channel, multiple access techniques are us ed to coordinate the
communications between the mobile stations and the base station. Common multiple
1
CHAPTER 1. Introduction Page 2
Figure 1.1: System model of cellular mobile communications
access techniques are:
• Frequency Division Multiple Access (FDMA)
The radio spectrum is divided into separate frequency bands (channels). Each
mobile station is assigned a unique frequency channel upon successful request,
which is not used by others during the whole course of its communication (con-
nection holding time). Multiple users can communicate with the base station
simultaneously by using different frequency bands.
• Time Division Multiple Access (TDMA)
The time axis is divided into several contiguous timeslots. In each timeslot,
only one user can transmit. However, a user can transmit in several consecu-
tive timeslots (in the same frame) to obtain a high transmission rate via slots
aggregation. Thus multiple users communicate with the base station through a
common frequency channel but in a time-slotted manner.
• Code Division Multiple Access (CDMA)
Each user is assigned a unique code which the base station uses to separate differ-
ent users. The codes are used for either modulating the radio waves or changing
the carrier frequency, i.e., spreading the information radio waves. Multiple users
share the same bandwidth and thus can transmit simultaneously.
The same frequencies and timeslots can be reused in different cells by using FDMA
and TDMA if the distance between the base stations are large enough and interference
2
CHAPTER 1. Introduction Page 3
of the same frequency bands is negligible. Hence more users can be supported and
radio utilization efficiency can be improved in a mobile system. By using CDMA, the
information bearing signal is spread over a bandwidth larger than the signal itself.
Although it is not spectrally efficient for a single user, a CDMA system becomes band-
width effic ient in the multiple user case since it is p ossible for multiple users to share
the same spreading bandwidth at the same time. Usually, FDMA is used together with
TDMA or CDMA to separate the spectrum into smaller bands which are then divided
in a time or co de division manner. The above fundamental techniques can be used
together to form various hybrid schemes.
Some second generation digital cellular systems, such as the Global System of Mo-
bile Telecommunications (GSM), employ a simple form of TDMA scheme that assigns
fixed timeslots to mobile users to support digital voice services. Timeslots aggregation
can be used to support multi-rate services in second generation systems. Most third
generation mobile networks will be based on the Wide-band CDMA (W-CDMA) tech-
nique. However the TDMA component has also been incorporated in 3G standards.
1.1.1 3G and UMTS
The third generation mobile communication system (3G) is standardized and defined
by International Telecommunication Union (ITU) as IMT-2000 (International Mobile
Telecommunication). It comprises a set of standards and recommendations. In Europe,
the 3G system is called Universal Mobile Telecommunication System (UMTS) [40],
which has been specified by the European Telecommunication Standards Institute
(ETSI). The UMTS Terrestrial Radio Access (UTRA) consists of two operational
modes, a frequency division duplex (FDD) mode, and a time division duplex (TDD)
mode [13]. Wideband Code Division Multiple Access (WCDMA) is used for UTRA
FDD and Time Division-Code Division Multiple Access (TD-CDMA) is used for UTRA
TDD. UTRA FDD uses different frequency bands for uplink and downlink, separated
by the duplex distance, while UTRA TDD utilizes the same frequency for both uplink
and downlink. UTRA FDD and TDD are harmonized with respect to the basic system
parameters such as carrier spacing, chip rate and frame length and hence FDD/TDD
3
CHAPTER 1. Introduction Page 4
dual mode operation can be facilitated. UMTS is a hybrid system which enables the
use of FDMA, TDMA and CDMA and their combinations. For more specifications of
UMTS, refer to the ETSI standard series and the text edited by Holma [40].
The most important feature of the UMTS is its high data rate capability, which
is usually summarized as 144 kbps for vehicular speeds, 384 for pedestrian speeds
and 2Mbps for indoor environments. Other main features include global roaming,
diverse services, Internet connection, easy and flexible service b earer configuration,
etc. Finally, we note that both circuit switching and packet switching are allowable in
UMTS. Hence advanced and flexible QoS can be supp orted.
1.2 Resource Allocation in Wireless Networks:
Challenges and Issues
As mentioned earlier, next generation mobile networks need to support heterogeneous
services with different QoS requirements. For example, voice services have strict delay
requirements while data services may tolerate some delays. Although this feature
lends the 3G networks to efficiently utilize resources, it also complicates the design
of resource management policies. On the other hand, due to the hostile transmission
medium in wireless communications, the resource allocation policy should also be fine
tuned to balance between the transmission quality, e.g., meeting the minimum error
rate requirement, and the cost to achieve the quality requirement, e.g., using the least
transmission power. In this section, we briefly overview the wireless QoS issue in the
context of UMTS, summarize the characteristic of the radio channel and introduce
some resource management modules.
1.2.1 Wireless Services and QoS Issues in UMTS
UMTS defines bearer service as the abstraction of the capability for information trans-
fer between access points [20]. The information transfer capabilities and transfer qual-
ities are the two main requirements for bearer services. The characterization of a
bearer service is made by using a set of characteristics, which include traffic type
4
CHAPTER 1. Introduction Page 5
(realtime/non-realtime), traffic characteristics (uni-/bi-directional, broadcast, multi-
cast), information quality (delay, delay jitter, error rate, data rate) and so on. UMTS
allows a user (or application) to negotiate bearer characteristics that are most appro-
priate for its information transfer. It is also possible to change bearer characteristics
via a bearer re-negotiation procedure during an ongoing connection. UMTS uses a lay-
ered structure to map an end-to-end network service into several bearer services [21].
The end-to-end QoS is thus split into several parts and each part should be supported
by one bearer service. The lowest bearer service that covers all aspe cts of the ra-
dio interface transport is the radio bearer service, which uses the UTRA FDD/TDD
services.
UMTS defines four kinds of QoS classes (traffic classes) [21]. They are: conver-
sational, streaming, interactive and background class. The main distinguishing factor
between these QoS classes is how delay sensitive the traffic is. Conversational class is
meant for traffic which is very delay sensitive while background class is the most delay
insensitive traffic class. The first two classes are those real-time traffic which needs
to preserve time relation (variation) between information entities of the stream. The
last two classes are those best-effort traffic which needs to preserve payload content.
A summary of the major groups of example applications in terms of QoS require-
ments is shown in Fig. 1.2, in which the delay values represent the one-way delay [20].
Applications may be applicable to one or more groups.
Figure 1.2: UMTS QoS classes and example allocations [22].
In UMTS, the QoS attributes define some typical parameters (e.g., delay/loss ratio)
for each QoS class. The QoS attributes are used to compose a QoS profile for negotia-
5
CHAPTER 1. Introduction Page 6
tion of the bearer service between the end user and the network. The specification of
UMTS QoS attributes is still ongoing and especially, the bit rate attributes are under
discussion. Different classes have different ranges of the value of some QoS attributes.
Table 1.1 summarizes the typical values for some main QoS attributes. The delivery
order indicates whether the service data unit (SDU) can be delivered in-sequence or
not. The residual bit error ratio indicates the undetected bit error ratio in the deliv-
ered SDUs. The transfer delay is the maximum delay for the 95th percentile of the
distribution of delay for all delivered SDUs during the life time of a bearer service. It
is worth noting that the guaranteed bit rate and the transfer delay are not specified
for the interactive and background classes according to UMTS specifications.
Table 1.1: Value ranges of UMTS radio bearer QoS attributes (adapted from [21])
QoS attributes Conversational Streaming Interactive Background
Maximum bit rate < 2048 kbps < 2048 kbps < 2048 kbps < 2048 kbps
Delivery order yes/no yes/no yes/no yes/no
Residual BER 5 × 10
−2
, 10
−2
, 5 ×10
−2
, 10
−2
, 4 ×10
−4
, 4 × 10
−4
,
5 ×10
−3
, 10
−3
, 5 ×10
−3
, 10
−3
, 10
−5
, 10
−5
,
10
−4
, 10
−6
10
−4
, 10
−5
, 10
−6
6 ×10
−9
6 ×10
−9
SDU error ratio 10
−2
, 7 ×10
−3
, 10
−1
, 10
−2
, 10
−4
, 10
−3
, 10
−4
, 10
−3
, 10
−4
,
10
−3
, 10
−4
, 10
−6
7 ×10
−3
, 10
−5
10
−6
10
−6
Transfer delay 80ms-maximum 250ms-maximum
The separation of the bearer service and QoS profile enables the flexible allocation
and utilization of UMTS network resources. For example, a user (or an application)
can request to use a lower data rate to save trans mission cost during its connection
holding time via the radio bearer negotiation procedure in UMTS. On the other hand,
some distinguishing characteristics of wireless communications also complicate the re-
source management. The following subsection briefly overviews a main distinct feature
particular to wireless communications.
6
CHAPTER 1. Introduction Page 7
1.2.2 Hostile Radio Channel
In a mobile radio environment, radio wave propagation suffers from attenuation be-
tween the mobile station and its serving base station. In general, the received signal
strength is affected by antenna heights, local reflectors and obstacles. Furthermore, the
user mobility pattern, i.e., the speed and the direction, also greatly impacts the received
signal strength. In practice, the path loss cannot be assumed to be computed based
on a simple free-space and line-of-sight model. However, some engineering models can
be used. These engineering models are based on several wave propagation phenomena
such as reflection, diffraction and scattering [65]. Reflection from an object typically
occurs when the wavelength of an impinging wave is much smaller than the object itself,
resulting in the multi-path components. Diffraction causes the wave to bend around
obstacles and can be explained by Huygen’s principle [65]. When a wave travels in a
medium with a large number of elements having smaller dimensions compared to its
wavelength, the e nergy is scattered. Although accurate prediction of ratio propagation
is rather difficult, several engineering radio fading models are widely used in ce llular
mobile communications. The signal fading in a wireless environment is normally con-
sidered to contain three components with different time scales of variations. These
are the large-scale path loss, medium-scale slow fading and small-scale fast fading [65].
Decreased received power with distance, reflection and diffraction constitute the path
loss. These are denoted large-scale since changes appear when moving over hundreds
of meters. A mobile station can be shadowed by, e.g., trees and buildings. The local
mean received power changes when a user moves just a few tens of meters, i.e., on a
medium-scale. Small-scale fast fading or multi-path fading characterizes the effect of
multi-path reflections by local scatterers and changes by the order of wavelengths. For
example, in the absence of a strong non-fading line-of-sight component, the Rayleigh
fading model is often used, in which the envelope S of the received signal follows a
Rayleigh distribution: f
S
(s) =
s
σ
2
e
−
r
2
2σ
2
, s ≥ 0. Note that the received signal power S
2
follows the exponential distribution in this case.
The transmission quality of a connection (or an application) is closely related to
the underlying channel conditions which determine the probability of successful recep-
7
CHAPTER 1. Introduction Page 8
tions and hence determine the QoS of the connection. Many methods can be used
to alleviate the harsh channel conditions, such as power control, error correction cod-
ing, interleaving and so on. However, there are always some costs associated with
the method for alleviating channel conditions. We consider the following example. In
wireless communications, the received signal to noise ratio (SNR, often in the context
of TDMA) or signal to interference plus noise ratio (SINR or SIR, often in the con-
text of CDMA) has a one-to-one mapping to the bit error rate (BER) given a fixed
transmission scheme, i.e., fixed coding and modulation scheme, etc. Let γ denote the
received SNR which can be simply computed as the ratio of the received signal power
to the channel noise, S
2
/σ
2
. Then the famous Shannon capacity of an additive white
Gaussian noise (AWGN) channel can be expressed as [61]:
C = log
2
(1 + γ) bit/sec/Hz (1.1)
This can be interpreted by an increase of 3dB in SNR required for each extra bit per
second per Hertz. Note that (1.1) can also be interpreted as how to maintain the
received SNR for a fixed transmission rate requirement, i.e., adjusting transmission
power according to the time-varying channel path gain. At first glance, increasing
transmission power can improve the received SNR and hence improve the effective
transmission rate of a connection. However, when we consider the transmission power
as the cost to achieve the QoS requirements, it is of course better to use the least
cost to achieve the same QoS requirements. Hence a better (or an optimal) resource
management policy should also address the tradeoff between the QoS requirements and
the costs to achieve the QoS. In the next subsection, we briefly introduce some resource
management tools considered in this thesis.
1.2.3 Some Management Modules
Radio resource management [40, 96], which has always been an important research
area in wireless communications, provides the mechanisms for efficient utilization of
the limited and scarce radio resources while guaranteeing the diverse QoS require-
ments of different services. However, the design of a comprehensive resource man-
agement scheme is rather difficult and, sometimes, almost impossible. Nonetheless,
8