Reliability modeling of ultra thin gate oxide and high k dielectrics for nano scale CMOS devices
Bạn đang xem bản rút gọn của tài liệu. Xem và tải ngay bản đầy đủ của tài liệu tại đây (10.8 MB, 209 trang )
RELIABILITY MODELING OF ULTRA-THIN
GATE OXIDE AND HIGH-K DIELECTRICS FOR
NANO-SCALE CMOS DEVICES
LOH WEI YIP
B. Eng (Hons), NUS
A THESIS SUBMITTED FOR THE
DEGREE OF DOCTOR OF PHILOSOPHY
DEPARTMENT OF ELECTRICAL
AND COMPUTER ENGINEERING
NATIONAL UNIVERSITY OF SINGAPORE
2004
Acknowledgments
First and foremost, my deepest gratitude to my supervisors, Associate
Professor Cho Byung Jin and Professor Li Ming Fu, who have given me guidance
throughout my study in NUS. In particular, it is Assoc. Prof. Cho who have aspired
me to reach for the highest standard in my researches and who have tirelessly
reviewed and guided me in all my publications. It is with his help that I am able to
produce credible results in the area of oxide and high-K reliability. Gratitude also goes
to Prof. Li, who because of his insight and theoretical expertise is able to guide me to
seek for a more theoretical understanding in all my researches. Without Assoc. Prof.
Cho and Prof. Li’s kind and patient guidance, it would be difficult for me to have
completed this thesis.
The advices and guidance of other teaching staffs are also gratefully
acknowledged. In particular, Prof. Kwong DL, Assoc. Prof. Yoo WJ, Dr. Zhu CX, Dr
Lee SJ, Dr. Yeo YC and Mr. Joo MS, have all given me tremendous help, advices and
encouragements. I also wish to express my sincere gratitude to my fellow students in
Silicon Nano Device Lab. (SNDL) and Center for Integrated Circuits Failure Analysis
and Reliability (CICFAR) who have make my stay in NUS a joyful and meaningful
experience. In particular, it is most gratifying to have the support and friendship of
Mr. Kim Sun Jung who has so willing lend a helpful hand in all my experiments and
Dr. Lim Peng Soon who has joined me in many fruitful discussions in both work and
social matters. Thanks also go to all my friends including Wu Nan, Ren Chi, Tony
Low, Chee Keong, Ng TH, Zerlinda, Tan KM, Chen JH, Wang YQ, Yu HY, Whang
SJ, Park CS, and many others who have went out of their way to teach and assist me
in this thesis.
The support and assistance from all the staffs of SNDL and NUS is also
gratefully acknowledged. In particular, Mr. Patrick Tang, Mr. Yong Yu Foo, Mr. Goh
Thiam Pheng, Mrs. Ho Chiow Mooi, and Mr. Walter Lim have greatly assisted me in
all manners of my administrative duties and experiments. Their kind assistances are
greatly appreciated.
Last but not least, I wish to dedicate this thesis to my parents, sister, Sook Fen
and Gabriel and my dearest Tze Chieg. Without their emotional support, care and
concerns, and continuous support and love, I would not have the privilege to even
embark on this journey of my life.
Summary
As complementary metal-oxide semiconductor (CMOS) technology advances,
the dimensions of its various key device components are scaled downward, from its
present day micrometer range and eventually, to its ultimate limit - the nanometer
regime. In this aspect, silicon dioxide (SiO
2
), which forms the gate insulator for the
transistor, is progressively reduced from thick to thin oxide (< 20 Å), ultra-thin (<15
Å) and eventually to high-K dielectrics. For high performance logic applications, gate
oxide thickness scaling is driven by the need for higher switching speed, transistor
drive current and minimization of short channel effects. However, as gate oxide scales
to sub-5 nm regime, various reliability phenomena have become increasing prevalent
and critical. Quasi-breakdown (QB), which is prevalent in sub-5 nm gate oxides, has
become an increasing concern due to its significant impact at low gate voltage and
signal noise increases. In the ultra-thin (< 15 Å) regime, gate oxide does not exhibit
discrete occurrences of gate leakage current but shows progressive breakdown
instead. Moreover, as gate oxide scales even further till sub-nanometer regime, there
are increasing evidences that this scaling will be limited by gate dielectric leakage and
reliability. At one nanometer, conventional silicon dioxide leakage current at
operating voltage, is in the regime of 10 ~ 100 A/cm
2
which may be too high for low
power application. As a result, high-K dielectrics will be needed by the year 2007 for
65 nm technology node. The breakdown mechanisms, pertaining to different
thicknesses of gate dielectrics, have to be well characterized and understood. In the
long term, reliability studies for high-K will be even more challenging due to its
differences in material and electrical properties compared to conventional SiO
2
.
For thin gate oxide, in the 30 ~ 45 Å thickness regime, the formation,
conduction, and evolution of quasi-breakdown are investigated. Using carrier
separation measurements, the electron and hole components of the gate leakage
current at onset of QB, are measured and analyzed. Subsequently, bias and thermal
annealing are performed on post-QB oxides and disparate responses are observed. By
carefully analyzing all the experimental evidences, a unifying defect-induced
Summary iii
breakdown model is presented and verified. As gate oxide scales into ultra-thin
regime (< 15 Å), QB becomes masked by the high gate leakage current and
subsequent multiple QB spots can be observed and tolerated. A statistical study is
conducted on ultra-thin silicon dioxides and a physical model based on multiple
quasi-breakdowns is proposed and experimentally verified.
Eventually, high-K dielectrics are required for continual gate dielectric
scaling. The reliability for high-K stacks is examined and a novel technique for stack
reliability is presented. Polarity dependent charge trapping in HfAl
x
O
y
(Hafnium-
Aluminum-Oxide) stack is observed and this is correlated to preferential breakdown
in the high-K and interfacial layer (IL) stack. Using carrier separation measurements,
breakdowns in high-K stack are attributed to an interface-initiated or bulk layer
breakdown in the high-K dielectric stacks.
Contents
Acknowledgements i
Summary ii
Table of Contents iv
List of Symbols viii
List of Figures x
List of Tables xx
1. Introduction
1.1 Dimension Scaling and Future Trends of Microelectronics 1
1.2 Summary and Motivation of Thesis 5
1.3 Thesis Outline and Original Contributions 6
References 9
2. Literature Review: Gate Dielectric Degradation
2.1 Impact of device scaling on gate dielectric degradation 11
2.2 Electrical Stress-Induced Degradation and Breakdown 14
2.3 Quasi-breakdown Mechanism 16
2.3.1 Direct Tunneling Model [2.10][2.26]-[2.30] 19
2.3.2 Percolation Model [2.40]-[2.43] 21
2.4 Device Scaling and Dielectric Performance 23
2.5 Ultra-thin oxide Reliability 24
2.6 High-K Dielectrics Reliability 27
2.6.1 High-K charge trapping 28
2.6.2 Stack Reliability 28
2.7 Summary 30
References 32
Table of Contents v
3. Measurement Setup and Techniques
3.1 Measurement Techniques 41
3.1.1 Direct Current Current-Voltage (DCIV) Technique 41
3.1.2 Charge Pumping (CP) Measurement Technique [3.14]. 44
3.1.3 Comparison between DCIV and CP Technique 46
3.1.4 Carrier Separation 48
3.2 Summary 50
References 51
4. Bipolar Stressing, Trap Generations and QB Mechanism Study
4.1 Introduction 53
4.1.1 Bipolar and Unipolar Current Stressing 55
4.2 Devices and Experimental Setup 56
4.3 Complete Evolution of Oxide Degradation Stages 57
4.3.1 Trap generation in thin gate oxides 59
4.4 Trap Generation and Fluence dependency 59
4.5 Critical level of trap density at onset of QB 62
4.6 Field and Area Dependency at QB 64
4.7 Comparison of QQB for bipolar and unipolar current stressing. 66
4.8 Carrier Separation Results 69
4.9 F-N and Direct Tunneling Modeling Equations 73
4.9.1Electron Leakage Current 73
4.9.2Hole dominance leakage current after QB 76
4.10 Proposed Model for QB Mechanism 77
4.11 Summary 81
References 82
5. Effect of Bias and Thermal Annealing on QB and its Mechanism Study
5.1 Introduction 85
5.2 Device and Experimental Setup 86
5.3 Characteristics of Electrical Recovery under Bias and Thermal
Annealing 87
5.3.1 Bias Annealing of post-QB oxides 88
Table of Contents vi
5.3.2 Reverse Bias Annealing after QB 90
5.3.3 Thermal Annealing after QB 94
5.3.4 Recoverable and Unrecoverable QB states 99
5.3.5 Combined Annealing Results: Bias and Thermal Anneal
101
5.4 Discussions for bias and thermal annealing 104
5.4.1 Mechanism of thermal and bias anneal 105
5.5 Summary 109
References 110
6. Degradation and Breakdown Mechanism in Ultra-thin Oxides
6.1 Introduction 112
6.2 Device Fabrication and Experimental Setup 115
6.3 Thin Oxide (20 Å) QB Degradation Characteristics 116
6.3.1 Comparison between Thick and Thin oxide: Interface Trap
Enhanced Tunneling (ITET) 116
6.3.2 Direct Correlation between interfacial traps and gate leakage
121
6.3.3 Distinction between ITT and ITET 124
6.3.4 Area dependency of ITET 126
6.4 Ultra-thin (<14 Å) oxide Degradation Mechanism 128
6.4.1 Area Dependency of Progressive Breakdown in Ultra-thin
Oxides 134
6.5 Modeling of Gate Leakage Current in Ultra-thin Oxides 138
6.5.1 Empirical Experimental Fitting 139
6.5.2 Modeling of Multiples Breakdown Spots 139
6.6 Summary 143
References 144
7. High-K Dielectrics Reliability: Charge Trapping and Breakdown
characteristics
7.1 Introduction 148
7.2 Device Fabrication 150
7.3 Carrier Separation and Leakage Path Mechanism 150
Table of Contents vii
7.4 Polarity Dependent Charge Trapping 153
7.5 Experimental Results 154
7.5.1 Charge Trapping in High-K stacks 154
7.5.2 Polarity dependent breakdown characteristics in MOS
capacitors 158
7.5.3 Negative CVS : p-MOSFET 161
7.5.4 Positive CVS : n-MOSFET 166
7.5.5 Statistical Breakdown Results 168
7.6 Proposed Charge Induced Breakdown Model 173
7.7 Summary 175
References 176
8. Conclusion and Recommendations
8.1 Conclusions 181
8.2 Recommendations for Future Work 183
References 186
A List of Publications 187
List of Symbols
A
T
Total gate area
c
e
t
Electron capture coefficient
C
ox
Oxide Capacitance per unit area
D
IT
Interface-state density
E
c
Silicon conduction band edge
E
F
Fermi level
E
g
Silicon bandgap
E
i
Silicon intrinsic energy level
E
ox
Oxide electric field
E
S, max
Surface electric field at maximum base recombination
current
E
v
Silicon valence band edge
F(t) Cumulative probability function
g
m
Transconductance
I
B
Base recombination current
I
B,max
Maximum base recombination current
I
off
Off-state transistor leakage current
I
s
Source current
I
s/d
Current collected from source/drain terminals
I
w
Substrate well current
J
DT
Direct tunneling gate current density
J
FN
Fowler-Nordheim gate current density
J
g
Gate leakage current density
k
Boltzmann constant
K Kelvin
K Dielectric permittivity constant
L Channel length
List of Symbols ix
m
e
Rest mass of electron
n
i
Intrinsic density of state
N
IT
Interface-state density
q Electronic charge of electron
Q Charge fluence
QB Quasi-breakdown
Q
BD
Charge-to-breakdown
Q
f
Oxide fixed charge density
Q
inj
Injected electron fluence
Q
IT
Interface trap charge density
Q
OT
Oxide trapped charge density
Q
QB
Charge-to-quasibreakdown
R
J
Ratio of current density of degraded spot over fresh
current density
T Temperature (in Kelvin)
T
100% Ig
Time-to-100% increment in gate leakage current
T
BD
Time-to-breakdown
T
ox
Gate oxide thickness
T
QB
Time-to-Quasi-breakdown
V
BE
Forward voltage bias for base-emitter
V
d
Drain voltage
V
dd
Supply voltage
V
FB
Flatband voltage
V
g
, V
G
Gate voltage
V
GB
Gate voltage corresponding to maximum base
recombination current
V
ox
Voltage drop across oxide/dielectric layer
V
s
Source voltage
V
th
Threshold voltage
W Channel Width
γ Quantum yield factor
ε
r
Relative permittivity to air
x
Charge Centroid
List of Figures
Fig. 1.1 Geometry scaling for MOSFET device channel length and equivalent oxide
thickness for low power application MOSFETs. Equivalent oxide thickness (EOT)
is used instead of physical oxide thickness due to the potential change in dielectrics
to high-K material for 65 nm technology node 2
Fig. 1.2 Trend in long term reliability requirement for MOSFETs. 1 FITs = 1 failure per 10
9
device hours. 4
Fig. 2.1 Hot carrier generation and various current components in n-MOSFET. (After [2.1]) 11
Fig. 2.2 Schematics of three possible conduction mechanisms leading to SILC leakage
current. (a) Trap-assisted tunneling (TAT) at distinct defect locations with energy
relaxation (b) Trap-assisted tunneling at same defect distribution (c) Tunneling and
recombination at oxide defect sites (RTAT). (After [2.8]) 12
Fig. 2.3 Illustration of differences between (a) Fowler-Nordheim (FN) and (b) direct
tunneling (DT). FN tunneling occurs when V
ox
> Φ
b
while DT occurs when V
ox
<
Φ
b
13
Fig. 2.4 Low-voltage conduction mechanism for thin oxide of various oxide thicknesses.
(After [2.11]) 14
Fig. 2.5 Anode Hole Injection model with an incident electrons arriving at the anode and
transferring its energy to a deep level valence electron and in the process, creating a
hole which is then injected back into the oxide. (After [2.15]) 15
Fig. 2.6 Evolution of gate voltage under constant current stress till complete breakdown. At
quasi-breakdown (QB), gate voltage drops due to enhanced leakage path with gate
voltage magnitude still significantly higher than at complete breakdown 17
Fig. 2.7 I-V characteristics of gate oxide at various stages of stressing – Fresh, SILC, quasi-
breakdown (QB) and complete breakdown. 17
Fig. 2.8 Schematic drawing for (a) electron transport in the ultra thin gate oxide under high
field stress (b) Current path in the oxide after quasi-breakdown. (After [2.10]) 20
Fig. 2.9 Schematic illustration of percolation model for intrinsic oxide breakdown based on
electrons trap generation. Conduction path is indicated by the shaded spheres. (After
[2.33]) 21
Fig. 2.10 Current-voltage characteristics of a MOS capacitor with a 4.2 nm gate oxide. Solid
line is fit obtained with a percolation model. (After [2.43]) 22
List of Figures
xi
Fig. 2.11 Simulated and measured Weibull slope β for charge-to-breakdown QBD as a
function of oxide thickness. (After [2.40]) 23
Fig. 2.12 Gate leakage current for different oxide thickness at fresh unstressed state and after
post-QB. It can be observed that post-QB leakage current for 35 - 45 Å oxides are
actually lower than that of the direct tunneling leakage current of 13 - 20 Å at its
initial unstressed state. 25
Fig. 2.13 Time evolution of gate current before and after onset of QB for ultra-thin oxides
(13.5 Å) under various gate bias CVS. 26
Fig. 3.1 p-MOSFET in top emitter-base configuration with spatial distribution of interface
traps and recombination traps centers as shown. 42
Fig. 3.2 Basic experimental setup for DCIV measurement using p-MOSFET. A vertical
parasitic p/n/p-BJT is used with p+ source as emitter, n-well as base, and p-substrate
as collector. Forward bias condition of V
EB
= + 0.3 V and V
BC
= 0 V is applied and
base recombination current I
B
is monitored as a function of gate voltage V
g
sweep.
Drain can be connected together with source as shown or floated. 44
Fig. 3.3 Basic experimental setup for conventional charge-pumping measurements on p-
MOSFETs. Source and drain are shorted and lightly reversed biased. An ac signal
is applied to gate to alternately drive electrons and holes into the interface traps
located at the SiO
2
-Si interface. During channel accumulation, recombination of
free carrier with the trapped charges cause a net DC substrate current – charge
pumping current I
cp
which is proportional to the areal interface trap density 45
Fig. 3.4 Schematic illustration of CP technique applied to p-channel MOSFETs. (a) Fixed
top level V
gh
with variable V
gb
and (b) fixed base level V
gb
and variable V
gh
. Both
configuration shown with the associated charge pumping current versus the variable
gate voltage as shown in the lower figures. 45
Fig. 3.5 Basic experimental setup for carrier separation measurement on p-channel
MOSFETs under inversion mode. Drain is floated while source and n-well are
grounded. Gate voltage is swept from 0 V to negative 3 V 48
Fig. 3.6 Schematic band diagram (a) of p-channel MOSFET in inversion mode and (b) n-
channel MOSFET measured in inversion mode. [After [3.1]] 49
Fig. 4.1 Measured gate voltage due to application of constant bipolar current pulse of current
density J = +/- 50 mA/cm
2
. 57
Fig. 4.2 Complete evolution of oxide degradation for thin oxide (T
OX
= 45 Å) under bipolar
constant current stress (J
stress
= +/- 10 mA/cm
2
). It can be observed that within QB
there are 2 stages – recoverable and unrecoverable QB. (n-MOSFET, W/L = 10/0.2
µm) 58
List of Figures
xii
Fig. 4.3 I-V characteristics of oxides at various stages of stressing conditions – fresh,
recoverable QB, unrecoverable QB and complete breakdown. (n-MOSFET, W/L =
10/0.2 µm) 58
Fig. 4.4 Peak recombination current I
B,max
versus charge fluence for stressing till quasi-
breakdown. Since peak I
B,max
is proportional to interface trap, it can be observed that
interface trap density is proportional to charge fluence Q
0.52
independent of channel
area and stressing current density. 60
Fig. 4.5 Voltage shift of peak I
B,max
, V
GB
versus charge fluence. Since oxide trap density is
proportional to V
GB
, it can be observed that oxide trap density can be divided into 2
region. At charge fluence < 100 C/cm
2
, oxide trap is proportional to Q
0.043
while
beyond, oxide trap is proportional to Q
0.31
61
Fig. 4.6 Trap generation under constant voltage stressing. Oxide trap N
OT
is proportional to
Q
0.18
while interface trap N
IT
is proportional to Q
0.27
. (p-MOSFET, W/L=10/1 µm,
V
stress
= 6.8 V) 62
Fig. 4.7 Critical level of oxide trap at onset of quasi-breakdown for different channel area as
shown. Oxides are stressed till QB using CVS at different gate bias. It can be
observed that bulk traps as reflected by ∆V
GB
at onset of QB increase with gate bias,
without a single constant level expected for critical bulk defects for percolation
model. 63
Fig. 4.8 Critical level of interface traps at onset of quasi-breakdown for different channel
area. Oxides are stressed to QB using CVS at different gate bias. It can be observed
that a constant level of interfacial traps is obtained irrespective of stressing gate
bias. Similar results have already been reported in [4.9] 64
Fig. 4.9 Voltage shift of peak I
B
versus stress fluence for different stressing current density
(a) J
stress
= 0.5 mA/cm
2
(b) J
stress
= 2 mA/cm
2
(c) J
stress
= 20 mA/cm
2
. It can be
observed that 2 stages exist for bulk trap generation under CCS. The crossover point
is highly dependent on the magnitude of the constant current stress. In the initial
stage, bulk trap generation is much slower and highly dependent on gate bias. In the
second stage, trap generation is much faster and total traps generated as reflected by
the magnitude of voltage shifts appear to be independent of gate bias 65
Fig. 4.10 Charge to quasi-breakdown for small channel area (< 3 µm
2
) using various mode of
constant current stress with different polarity injection, including unipolar and
bipolar CCS. It can be observed that bipolar stressing results in much lower QQB
for the same fluence as compared to unipolar stressing. Each point (differentiated by
sample area) is obtained from 5-10 samples with Q
QB
(63% values) corresponding
to the zero level in the Weibull distribution 67
Fig. 4.11 Charge to quasi-breakdown for big channel area (~100 µm
2
) using various mode of
constant current injection. For large area samples, gate injection unipolar stress
List of Figures
xiii
results in significantly lower Q
QB
compared to substrate injection. Bipolar stressing
for large samples also has low Q
QB
and appears to be limited by the low Q
QB
for gate
injection under negative gate bias. Results are similar to [4.13]. Each point is
obtained from 5-10 samples with Q
QB
(63% values) corresponding to the zero level
in the Weibull distribution. 68
Fig. 4.12 Carrier separation measurement showing gate, source and substrate current
component at fresh, unstressed state. (p-MSOFET, T
ox
= 45 Å, W/L = 10/0.5 µm) 70
Fig. 4.13 Carrier separation measurement at onset of QB, which is attained after 222C/cm
2
of
electron fluency. Sample is still in recoverable QB stage and is the same one used in
Fig. 4.12 71
Fig. 4.14 Carrier separation measurement after post-QB stress (additional electron fluency of
38 C/cm
2
) within recoverable QB stage. Sample used is the same as Fig. 4.12 71
Fig. 4.15 Carrier separation measurement after post-QB stress but stressed to unrecoverable
QB (p-MOSFET, T
ox
= 45 Å, W/L = 10/1 µm, J
stress
= 10 mA/cm
2
) 72
Fig. 4.16 Experimental quantum yield as a function of gate voltage and resulting electron
energy for unstressed gate oxides and post-QB oxides as shown inset. 73
Fig. 4.17 Carrier separation for well current component at fresh and onset of QB state. F-N
current is simulated using (3.5) with varying energy barrier, oxide thickness and
electric field shift. Good fit observed for experimental I
well
and F-N current using
electric field shift V
shift
= 2.2 V 75
Fig. 4.18 Evolution of well current component for post-QB stage under continual stressing.
Good fit observed for well current component with simulated F-N tunneling current.
(T
ox
= 45Å , W/L = 10/0.7 µm, p-MOSFET) 76
Fig. 4.19 Evolution of source current component after QB in hole dominant regime.
Relatively good fit observed between experimental data at QB and direct tunneling
current modeling using (3.6). (T
ox
= 45Å, W/L = 10/0.7µm, p-MOSFET) 77
Fig. 4.20 A schematic drawing of energy band diagram for localized trap region (LTR)
model. Hole trapping at anode results in distortion of energy band and formation of
localized trap region (LTR) causing bandgap narrowing near the anode. (a) In initial
stage, electron conduction by F-N tunneling. (b) Further stressing extends the LTR,
resulting in hole direct tunneling. Electrons and holes are indicted by solid and open
circles, respectively. 79
Fig. 4.21 Schematic illustration of evolution of the localized trap region (LTR) formed by
deep level trapped holes at various stages of QB (A) at onset of QB, within
recoverable QB, LTR is mainly localized at the anode and conduction proceed by
direct tunneling of both holes and electrons. (B) at unrecoverable QB, LTR has
extended the whole oxide forming a direct conduction path. 81
List of Figures
xiv
Fig. 5.1 Schematic illustration of carrier separation measurement setup for electrical bias
annealing experiment 87
Fig. 5.2 Evolution of gate voltage under constant current stress till QB and post –QB
positive bias annealing. (p-MSOFET, T
ox
= 45 Å, W/L = 10/0.5 µm, J
stress
= 50
mA/cm
2
) 88
Fig. 5.3 DCIV spectra of p-MOSFET for Fig. 5.2, with stressing till QB and post-QB. After
onset of QB, it can be observed that the recombination current, I
B
spectra overlaps
with subsequent decrease in the peak amplitude of I
B
accompanied by a slight shift
of VGB for peak IB to the right. (p-MSOFET, T
ox
= 45 Å, W/L = 10/0.5 µm, J
stress
=
50 mA/cm
2
) 89
Fig. 5.4 Quantitative DCIV spectra measurement showing IB, max and ∆VGB versus
injected fluencies. Bulk and interface trap after QB show no further increment. (p-
MOSFET, T
ox
= 45 Å, W/L = 10/0.7 µm, J
stress
= 50 mA/cm
2
) 89
Fig. 5.5 Evolution of gate voltage under constant current stressing. At QB, reverse bias
current J
rev
= 5 mA/cm
2
is applied. (pMOSFET, Tox = 45 Å, W/L = 10/0.25 µm,
J
stress
= 100 mA/cm
2
) 90
Fig. 5.6 Associated I-V characteristics of oxide at various stages of electrical stressing as
shown inset. Reverse bias anneal applied after onset of QB. It can be seen that gate
leakage recovers back to fresh after 500 s of reverse bias anneal. Sample used is the
same as Fig. 5.5 91
Fig. 5.7 DCIV spectra for p-MOSFET oxide at various stages of electrical stressing. The
sample used is the same as Fig. 5.8 92
Fig. 5.8 Associated I-V characteristics at various stages of constant current stressing. After
quasi-breakdown is attained, same polarity stressing is continued before application
of a reverse bias stress. Gate leakage current after application of reverse bias shows
reduction till SILC level. (T
ox
= 45 Å, W/L = 10/0.5 µm, p-MOSFET) 93
Fig. 5.9 Quantitative DCIV spectra measurement at various stages of current stressing. Peak
recombination current I
B
is related to interface traps while the lateral shift of peak I
B
is related to oxide bulk traps. At reverse bias anneal, oxide bulk traps recover to
initial values at fresh state while interface traps remains unchanged. 93
Fig. 5.10 Variation of gate voltage under bipolar constant current density J
stress
= +/- 10
mA/cm
2
at pre-QB and post-QB with successive alternating stressing and bias
annealing. (T
ox
= 45Å, W/L = 10/0.2 µm, n-MOSFET) 94
Fig. 5.11 DCIV spectra of p-MOSFET stressed to QB. Post-QB thermal annealing performed
at various temperatures as shown inset. The thin line linking up the maxima of the
I
B
spectra reflects the level of oxide bulk traps during SILC while the thick line
reflect bulk trap level due to the thermal annealing. It can be observed that thermal
anneal results in both a positive shift in the spectra and reduction in the maxima of
List of Figures
xv
I
B
showing reduction in interface traps and bulk traps.(T
ox
= 45 Å, J
stress
= 50
mA/cm
2
, W/L = 10/1.0 µm, p-MOSFET) 95
Fig. 5.12 Gate current leakage current after QB and with post-QB thermal annealing at
successively higher temperature for 10mins each. (T
ox
= 45 Å, J
stress
= 50 mA/cm
2
,
W/L = 10/1.0 µm, p-MOSFET) 96
Fig. 5.13 DCIV spectra of p-MOSFET stressed to QB. Post-QB thermal annealing carried out
at 200
o
C for varying period of annealing durations from 5 mins to 200 mins. (T
ox
=
45 Å, J
stress
= 20 mA/cm
2
, W/L = 10/1.0 µm, p-MOSFET). 97
Fig. 5.14 Gate leakage current at QB and after post-QB thermal annealing treatment at 200
o
C
for varying period of time as shown inset 98
Fig. 5.15 Carrier separation measurement of source current component (holes current ) for p-
MOSFET under successive thermal anneal. Sample used is the same as Fig. 5.14 98
Fig. 5.16 Carrier separation measurement of well current component (electron current) for p-
MOSFET under inversion conditions after successive thermal anneal. Sample used
is the same as Fig. 5.14 99
Fig. 5.17 Gate I-V characteristics for p-MSOFET stressed till unrecoverable QB with post-
QB thermal annealing at 200
o
C for varying period of durations as shown inset. (T
ox
= 45 Å, J
stress
= 50 mA/cm
2
, W/L = 10/1 µm, p-MOSFET) 100
Fig. 5.18 Carrier separation for source I-V characteristics on the same p-MSOFET used in
Fig. 5.17 with post-QB thermal annealing treatment 100
Fig. 5.19 Carrier separation measurement showing substrate I-V characteristics for p-
MOSFET used in Fig. 5.17 with post-QB thermal annealing treatment 101
Fig. 5.20 Gate leakage current at fresh stage and after electrical stresses. Oxide was stressed
till onset of QB as shown by initial QB and continual stressing result in QB(2)
before being subjected to reverse bias and thermal anneal. The ‘recovered’ oxide
was then subjected to additional electrical stress till second QB as shown by QB(3) 102
Fig. 5.21 Associated DCIV spectra of oxide stressed till QB and subjected to bias and thermal
anneal. It can be observed that the combined effects of bias and thermal anneal
results mainly in a positive shift in the DCIV spectra of the post-QB oxide and
reduces I
B
to a lower level respectively. 103
Fig. 5.22 Evolution of the gate voltage of oxide subjected to CCS till QB as shown in (a) and
subsequently subjected to bias and thermal anneal. (b) shows the subsequent
evolution of the gate voltage when the ‘recovered’ oxide is re-subjected to CCS till
a second QB 103
Fig. 5.23 (1) Microscopic model of hole trapping (A)-(B) forming an E’ center and
detrapping (C) along with charge compensation and bond reformation as proposed
List of Figures
xvi
by Lelis et al. [5.13] (2) Two spatial equivalent trap levels that electrons can tunnel
to, corresponding to the ground and excited state of the E’ center. (After [5.13]) 105
Fig. 5.24 Schematic diagram illustrating (A) Reverse bias annealing (B) Thermal annealing
without bias. With bias anneal, both levels of trapped holes can be annealed while in
thermal annealing, hole trap with energy level above Si conduction band requires
electrons with energy above conduction band to be deactivated 106
Fig. 5.25 (a) Proposed localized trap region (LTR) model: hole trapping predominantly at
anode causes an energy band distortion and results in F-N conduction for electrons
and direct tunneling for holes at the recoverable QB. (b) Thermal annealing results
in electron-hole pair compensation and the reduction of localized trap region (LTR).
The shaded regions represent bandgap narrowing due to formation of LTR while the
thick lines show the resultant oxide energy band. 107
Fig. 6.1 HRTEM cross section of 13 Å gate oxide (left) and C-V measurements and
simulation results (solid lines) fitting to 13 Å oxide thickness by Berkeley QMCV
modeling (right). 116
Fig. 6.2 Evolution of gate voltage under constant current stressing (J
stress
= -50 mA/cm
2
) with
gate injection for thick (45 Å) and thin (20 Å) gate oxide. (T
ox
= 45 Å & 20 Å,
Channel Area = 10 µm
2
, p-MOSFET). 117
Fig. 6.3 (a) Evolution of gate voltage under CCS for thick (45 Å) p-MOSFET oxide after
onset of QB. (b) Associated DCIV spectra measured at interval specified in (a).
Base recombination current increases continuously under stressing till QB. At QB,
DCIV spectra observed to overlap with no further increases. (Channel Area = 10
µm
2
, p-MOSFET). 119
Fig. 6.4 Comparison of DCIV spectra for (a) thick (45 Å)and (b) thin oxide (20 Å) p-
MOSFET under constant current stressing till QBs. (a) For thick oxide (45 Å), base
recombination current increases continuously under stressing till QB. At QB, DCIV
spectra observed to overlap with no further increases. (b) For thin oxide (20 Å),
DCIV spectra increases even after QB with step-like increases in correlation with
gate leakage current. (Locus of I
B,max
and V
g,max
is shown by the dotted lines).
(Channel Area = 10 µm
2
, p-MOSFET) 120
Fig. 6.5 Correlation of gate leakage current I
g
and base recombination current I
B
, which
directly reflect interface trap density N
IT
under constant voltage stressing for (a)
small area samples (W/L = 20/0.5 µm) and (b) large area samples (W/L = 50/50
µm). Inset figure shows the percentage change in I
g
and I
B
. (Tox = 20 Å, p-channel
MOSFET). 122
Fig. 6.6 Correlation of gate leakage current I
g
and peak base recombination current I
B,max
under constant voltage stressing for substrate injection. Similar to negative gate bias
(gate injection), gate leakage current observed to bear one-to-one correspondence to
List of Figures
xvii
base recombination current which is directly correlated to interface traps. (T
ox
= 20
Å, W/L = 20/0.5 µm, p-MOSFET). 123
Fig. 6.7 Percentage change of gate leakage current (I
g
–I
g,initial
/I
g,initial
) for different gate
voltage under constant voltage stressing. The spike for ∆I
g
at gate voltage near to
zero volts is due to background noise. Unlike ITT, ITET occurs throughout the
entire voltage measurement range. (T
ox
= 20 Å, Area = 10 µm
2
, p-channel
MOSFET). 125
Fig. 6.8 Carrier separation showing holes (shown by source current I
s
) and electrons current
(shown by well current I
w
) for small channel area p-MOSFET stressed under
negative constant gate voltage. (T
ox
= 20 Å, Area = 10 µm
2
, p-channel MOSFET). 125
Fig. 6.9 (a) Discrete gate current density increase for different channel areas (b) normalized
gate current increase under constant voltage stress for different channel area ranging
from 10 to 2500 µm
2
. (T
ox
= 20 Å, p-MOSFET). 127
Fig. 6.10 Carrier separation characteristics for 13 Å gate oxide in both depletion and
accumulation. Source, n-well and gate current indicated by I
s
, I
w
and I
g
respectively.
Drain electrode is not connected. (Channel Area = 100 µm
2
, p-MOSFET). 128
Fig. 6.11 (a) Evolution of current-voltage characteristics at fresh and after constant voltage
stressing (V
stress
= -3.0 V). (b) Associated I-V characteristics at onset of progressive
BD and post PBDs. (T
ox
= 13.4 Å, Channel Area = 10 µm
2
, p-MOSFET). 130
Fig. 6.12 Evolution of current-voltage characteristics at fresh and after constant voltage
stressing (V
stress
= + 3.0 V). (T
ox
= 13.4 Å, Channel Area = 10 µm
2
, p-MOSFET). 131
Fig. 6.13 (a) Percentage change in gate leakage current under different stressing gate voltage
in the initial stage of PBDs. (b) In the subsequent PBDs stages, leakage current
proportional to logarithmic of stressing time. It can be observed that gate leakage
current follow a power relation with stressing time in the initial stage (a) and a
linear logarithmic time dependence as shown inset in the subsequent stage (b). 132
Fig. 6.14 Graph showing gate leakage current time dependence parameters A and voltage
dependence parameter, B as defined in (1) for 2nd stage of PBDs versus stressing
gate voltage. (Channel Area = 100 µm
2
, p-MOSFET). 134
Fig. 6.15 (c) Percentage increase in gate leakage current after onset of 2nd stage PBDs for
different sample areas. 136
Fig. 6.16 Degradation rate or defect generation rate defined by Jg = Pg * Qinj where Pg is
the defect generation / gate degradation rate as shown for second stage of PBDs. It
can be observed that gate degradation increase as sample area decreases with
eventual saturation at very small area 137
Fig. 6.17 Lifetime projection versus stressing gate voltage using 100% increase in gate
leakage current as failure criterion. Lifetime for 100% increase in gate leakage t
100%
List of Figures
xviii
Ig
is much shorter than the conventional time-to-complete breakdown t
BD
. (T
ox
=
13.4 Å, p-MOSFET). 138
Fig. 6.18 Evolution of normalized gate leakage current (I
g
– I
g,0
)/I
g,0
on a 13.4 Å gate oxide
when stressed under constant voltage stress (as shown by the solid symbol). Using
(5.6), the cumulative frequency of localized spots occurrence F(t) can be determined
and it’s associated Weibull plot (with various values of Rj) versus logarithmic of
stressing time is as shown ( shown by the various open symbols). It can be observed
that the derived Weibull plots can be separated into 2 regions, A & B. The derived
Weibull shows a good linearity when Rj = 3 for both region A and B, deviating only
at the extreme short and long stressing time due to censoring effects 142
Fig. 7.1 Energy band diagram and tunneling current components for p-MOSFET with metal
gate under (a) inversion (negative gate bias) and (b) accumulation (positive gate
bias) conditions. The dominant components of gate currents under both polarities
are the ones which tunnel through the IL: Js under – V
g
and Jw under +V
g
. 151
Fig. 7.2 J
g
-V
g
characteristics of p-MOSFETs with HfAlO dielectrics. Source and n-well are
grounded. The dominant components of gate currents under both polarities are the
ones which tunnel through the IL: J
s
under – V
g
and J
w
under +V
g
152
Fig. 7.3 Charge trapping characteristics (a) under positive V
g
, and (b) negative V
g
. Positive
bias stress causes electron trapping, while negative bias stress results in hole
trapping for |V
g
| > -3 V. Sample area is 100 x 100 µm
2
155
Fig. 7.4 Inversion capacitance-voltage curves of p-MOSFETs before and after stress under
(a) negative gate bias and (b) positive gate bias for a period of 1000 s and 2000 s. A
flatband voltage shift to the left after negative bias stress shows positive charge
trapping within the dielectric and IL 156
Fig. 7.5 (a) Evolution of gate leakage current in p-MOSC and (b) evolution of current-
voltage characteristics under negative constant voltage stress. It can be observed
that there are at least 2 distinct stages of breakdown as shown by pBD1, pBD2 and
pBD3. Area of sample used is 100 x 100 µm
2
. 159
Fig. 7.6 (a) Evolution of gate leakage current in p-MOSC and (b) evolution of current-
voltage characteristics under positive constant voltage stress. It can be observed that
there are only 1 distinct stages of breakdown. Area of sample used is 100 x 100
µm
2
160
Fig. 7.7 (a) Relative changes of Js and Jw currents during negative CVS (V
g
= -3.0 V) on p-
MOSFET. (b) Identical data with (a) but plotted in wider scale. The high-K bulk
breakdown happens first at the initial stage of breakdown 162
Fig. 7.8 Associated (J-V characteristics) carrier separation measurement of Fig. 6.8, showing
both source and well current component before and after bulk BD and IL BD. It can
be observed that at the first onset of Bulk BD (shown by shaded symbols), J
w
List of Figures
xix
increases significantly throughout the entire range of gate voltage while J
s
, which
reflect the IL condition, increases only marginally. Subsequent occurrence of IL BD
(shown by solid symbols), result in significant increase in both J
s
and J
w
163
Fig. 7.9 (a) Relative changes of J
s
and J
w
currents during positive CVS (V
g
= +3.2 V) on p-
MOSFET. Only interfacial layer breakdown observed after about 470s of stressing,
shown by the larger increase in J
w
. (b) Associated I-V characteristics after positive
CVS but measured under both negative and positive gate voltage regime. The IL
leakage currents have increased by orders of magnitude, while the bulk leakage
current did not increase significantly due to the intact high-K bulk layer. 165
Fig. 7.10 (a) Relative changes of Js and Jw currents during positive CVS (Vg = 3.2 V) on n-
channel MOSFET and (b) its associated J-V characteristics. The dominant electron
current, J
s
, increase faster than that of the subservient well current, J
w
, which reflect
the valence electron current. At onset of breakdown after stressing for 15 s,
interfacial layer breaks down, which translate to much higher leakage current for Js
while the well leakage current J
w
which tunnel through a thicker portion of the high-
K layer is less affected. 167
Fig. 7.11 Weibull distributions for V
BD
under ramped gate voltage sweep for p-channel MOS
capacitors (shown by shaded symbols) and n-channel MOS capacitors (shown by
open symbols) with source/drain implant. The Weibull slope for breakdown voltage
V
BD
under –V
g
sweep is much steeper than that for +V
g
sweep for both n-channel
and p-channel MOS. 169
Fig. 7.12 Weibull distributions for charge-to-breakdown (QBD) (a) under negative constant
voltage stresses and (b) under positive constant voltage stresses. It is observed that
Weibull distribution for +V
g
CVS deviates from the linear line at low QBD for
higher gate bias stressing due to temporal resolution of measurement setup,
especially for early failure devices with low time-to-breakdown. High β (Weibull
slope) value under –V
g
and low β value under +V
g
are observed. Sample area is 100
x 100 µm
2
172
Fig. 7.13 Weibull distributions for charge-to-breakdown (Q
BD
) on p-channel MOS capacitors
under (a) negative constant voltage stresses and (b) under positive constant voltage
stresses. Reasonably high β (Weibull slope) value under –V
g
CVS and low β value
under +V
g
CVS are observed. Sample area is 10
-4
cm
2
. 173
Fig. 7.14 A schematic drawing for a breakdown model using charge trappings at different
spatial locations in high-K/IL stack dielectric with a metal gate structure. (a) For -
V
g
, electron trapping occurs mainly in the bulk while hole trapping occurs near to
the IL. The columbic force of the trapped charges distorts the energy band diagram,
leading to a preferential breakdown in the bulk. (b) For +V
g
, only electron trapping
occurs. The band distortion in the high-K bulk would be smaller, leading to higher
possibilities of interfacial layer breakdown. 174
List of Tables
Table 1.1 Selected data from latest ITRS 2003 update (After [1.2]) …………………………. 3
Table 2.2 Summary of quasi-breakdown conduction mechanism ……………………….……. 19
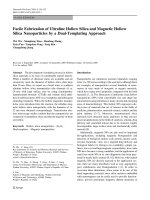
Table 6.1 A summary of criteria for determining the dominant breakdown mechanism for all
the possible combinations of gate bias in both n- and p- MOSFETs ……………… 166
Chapter 1
Introduction
1.1 Dimension Scaling and Future Trends of
Microelectronics
Microelectronics is becoming an important and integral part of modern living.
It is interesting to note that in almost every part of our lives, including medical,
transport, entertainment, communication and military defense, electronics is
invariably present. The increasing miniaturization of electronics to even smaller sizes,
through device scaling, novel process fabrication and device structures to its ultimate
limit - nano dimensions, introduces changes, which were previously unimaginable.
Nanoscience engineering provides new knowledge and capability to design and build
materials at atomic scale. Yet these changes require tremendous engineering
ingenuity, and researches into such new materials and its underlying science, are
imperative.
Integral to the entire electronics chip is the transistor. The first oxidized silicon
metal-oxide-semiconductor field effect transistor (MOSFET) was first proposed and
fabricated by Kahng and Attalla in 1960. Since then, the inherent structure of the
transistor has remained almost unchanged till today. In addition, due to the various
benefits of silicon dioxide as the gate insulator, there has been little or virtually no
change in the gate dielectric material. Ever since then, the technological advancement
in electronic circuitry is achieved merely by reducing device dimensions to achieve
higher speed and higher packing density. Decades of continuous technological
improvements in CMOS technology have made it the present dominant Very Large
Scale Integration (VLSI) technology. Beneficial results from such intense scaling can
be observed in bit-density increase, speed/performance as well as reliability
improvement and defect reduction resulting in significant yield improvement. While
Chapter 1: Introduction 2
Moore’s law
1
has been able to predict the dimension scaling in the microchip very
well over the past decades, there are increasing evidences that certain fundamental
barriers will be approached, which may limit the continuous phenomenal growth in
transistors’ density [1.1].
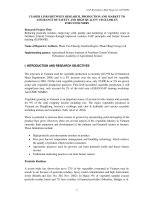
Figure 1.1 shows the device scaling for the last thirty years. It can be seen that
as device channel length is aggressively scaled downward, gate oxide thickness is also
scaled to avoid short channel effect and to maintain drive current capability. There
are, however, increasing evidences that oxide scaling may be reaching a limit due to
the tradeoff in gate leakage and oxide reliability for ultra-thin oxides.
1970 1980 1990 2000 2010 2020
10
0
10
1
10
2
10
3
10
4
Channel Length
Equivalent
Oxide Thickness
Geometry (nm)
Year
Fig. 1.1 Geometry scaling for MOSFET device channel length and equivalent oxide
thickness for low power application MOSFETs. Equivalent oxide thickness (EOT) is used
instead of physical oxide thickness due to the potential change in dielectrics to high-K
material for 65 nm technology node.
Table 1.1 in the next page, shows the technological roadmap for the
semiconductor industry in the coming 10 years [1.2]. It can be observed that there are
a few significant issues that do not have any solutions presently. For accelerated
1
The observation was made in 1965 by Gordon Moore, who found that the number of transistors in integrated circuits expressed
in per square inch, has doubled every year since the integrated circuit was invented. Recently, the pace has slowed down a bit,
with data density doubling approximately every 18 months instead of 12 months.
Chapter 1: Introduction 3
MOSFET gate length scaling to continue, the following key issues shown below have
to be addressed.
• Accelerated need for high-K gate dielectric solution for dealing with
increased MOSFET gate leakage
• Accelerated need for dual metal gate electrodes and next generation
contact solutions due to incompatibility of polysilicon with high-K
dielectrics and poly depletion effect
• Accelerated need for ultra-shallow highly activated extensions
In particular, gate dielectric using gate oxides will face significant challenges
as gate oxide thickness approaches the direct tunneling regime of below 30 Å,
requiring rapid supply voltage derating as shown in Table 1.1. Enhanced direct
Table 1.1 Selected data from latest ITRS 2003 update (After [1.2])
Year of Introduction "
Technology Node"
2003
2004
90nm
2005 2006
2007
65nm
2009
2010
45nm
2013
32nm
Physical gate Length (nm) for
low operating power
65 53 45 37 32 25 22 16
Minimum Supply Voltage
(volts)
1 0.9 0.9 9 0.8 0.8 0.7 0.5 - 0.6
Equivalent Physical Oxide
Thickness (nm)
1.6 1.5 1.4 1.3 1.2 1 0.9 0.8
Gate Dielectric Leakage @ 25
deg C (A/cm
2
)
0.51 1.89 2.22 2.7 5.21 6.67 11 21
Contact maximium resistivity
(x 10
-7
ohms-cm
2
)
1.93 1.62 1.44 1.2 1.05 0.72 0.61 0.171
Drain Extension Xj (nm) 24.8 20.4 17.6 13.8 8 7.2 10.4
Solution Exist Solution bein
g
pursued No known solution
tunneling leakage current due to quantum-mechanical (QM) tunneling probabilities of
electrons results in higher standby leakage current I
off
and anomalous capacitance-
voltage behavior that progressively destroys transistor operation characteristics. This
places a theoretical limit on the usage of SiO
2
, which has leakage current in the excess
of 5 A/cm
2
for the 13Å thickness regime [1.2]. Using electron energy loss
spectroscopy (EELS), it is observed that the two interfacial layers overlap when SiO
2
layer thinner than 13 Å is used [1.3]. At this thickness regime, gate leakage current
Chapter 1: Introduction 4
becomes very large ~ 10
2
A/cm
2
and the insulating nature of SiO
2
is almost
completely lost. As a result, it is obvious that for gate dielectrics with equivalent
oxide thickness of 13Å and below, other materials such as high-K gate dielectrics will
be required [1.3],[1.4].
Besides the excessive gate leakage observed in ultra-thin gate dioxides, other
hosts of problems also arise from this frantic device scaling. In particular, reliability
has currently become an important issue due to several factors. Firstly, although
device dimensions are scaled downward, the applied voltage cannot be scaled
proportionately, due to the presence of a large mixture of logic/digital and
input/output devices in a single chip which have different power requirement. This
non-proportional voltage scaling has resulted in increasing electrical field which is
very detrimental to device lifetime. Higher field has led to increased leakage current,
power dissipation and enhanced device temperature, both of which have very adverse
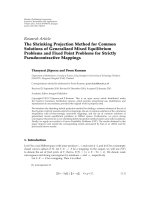
effects on device operation. Fig. 1.2 shows the long term reliability requirement for
the MOSFET device. By the year 2010, long term reliability requirement of a
transistor may need to be lower than 1 Failure-in-Time (FIT). This requirement is
1970 1980 1990 2000 2010
10
-1
10
0
10
1
10
2
10
3
Failure Rate (FITs)
Year
Fig. 1.2 Trend in long term reliability requirement for MOSFETs. 1 FITs = 1 failure per
10
9
device hours.