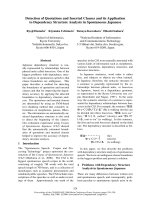
Mixed mode i II III fracture criterion and its application to cement mortar 2
Bạn đang xem bản rút gọn của tài liệu. Xem và tải ngay bản đầy đủ của tài liệu tại đây (462.8 KB, 23 trang )
68
CHAPTER 4 EXPERIMENTAL VERIFICATION OF FRACTURE
CRITERION
In this chapter, the results of three-dimensional mixed mode fracture tests, on
cement mortar specimens, will be reported. A finite element model will be generated to
idealize the laboratory set-up, and the respective pure mode stress intensity factors
determined. As a result of the analyses and laboratory measurements, the proposed
three-dimensional fracture criterion of §2.4, in Chapter 2, will be confirmed. In the
above connection, the choice of cement mortar as the test material will first be justified.
This will be followed by an introduction to the test set-up. The fracture tests on cement
mortar specimens will then follow.
4.1 Test Material and Set-up
4.1.1 Test Material
Based on their constituents, cementitious materials may be classified as paste,
mortar, or concrete. Paste is a mixture of cement and water. Mortar is a mixture of fine
aggregate (usually sand), cement, and water. Concrete is a composite consisting of
cement, fine aggregate, coarse aggregate, and water. The properties of these materials
are influenced by the chemical composition of the constituents, and their micro- and
macro-structures, which are characterized by the amount and distribution of internal
69
pores and cracks.
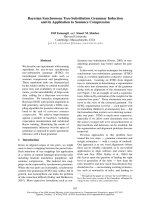
The hierarchy of fracture processes in cement-based material is as presented
in Figure 4.1 (Shah et al, 1995). Since, as shown in Figure 4.1(a), the microstructure of
cement paste is on a scale of nanometres, fracture processes in cement paste would be
influenced by particles and voids on the same scale. It was found that cement mortar is
a highly brittle material (Li and Maalej, 1996) and can be adequately analyzed by the
concept of LEFM (Mai, 1984). The internal structure of mortar is shown in Figure
4.1(b). The use of sands or fine aggregates results in voids in mortar of up to the scale
of a micrometre. As a result, fracture processes in mortars would, also, primarily
involve extension of internal voids on the scale of a micrometre. From this point of
view, it would be valid to consider cement mortar as an isotropic and homogeneous
material. With coarse aggregates, concrete is physically a two-phase material
consisting of the mortar matrix and coarse aggregate. They are bonded together at the
interface. Interfacial cracks and weak interfacial zones (Shah and McGarry, 1971; Jenq
and Shah, 1985b) between matrix and aggregate, on a scale of a millimetre, are major
defects of concrete, as suggested by Figure 4.1(c). Therefore, concrete is an anisotropic
and heterogeneous material, and fracture processes in concrete may depend primarily
on the stability of interfacial cracks and weak interfacial zones.
According to LEFM, the stress at a crack tip would approach infinity.
However, infinite stress cannot develop in a real material, hence, a certain range of
inelastic zone must exist in the vicinity of the crack tip. Since concrete is a
heterogeneous material consisting of different phases, the inelastic zone, which is
dominated by complicated mechanisms, is termed the fracture process zone. By using
70
Figure 4.1 Hierarchy of fracture process in cement-based materials
(a) cement paste
10
µ
m
50
µ
m
(b) mortar
(c) concrete
50mm
71
a scanning electron microscope, Mindess and Diamond (1982) reported that the crack
surface in concrete is tortuous, and the crack process zone is complicated. The fracture
behaviour of concrete would, therefore, be greatly influenced by the presence of the
fracture process zone. Experimental results have indicated that the strength of concrete
usually decreases with increasing size of structures, and then remains constant. This is
known as size effect of concrete, which may be primarily explained by the fracture
process zone (Bazant et al., 1991). It follows that when a concrete structure is loaded,
some of the strain energy produced by the applied load is converted to the energy
consumed to create new fracture surfaces and the energy absorbed in the fracture
process zone. For a large-sized structure, the latter is negligible compared to the former,
whereas for a small-sized structure, these can be comparable. Therefore, the larger the
structural size, the lower the nominal strength. However, the concrete strength
approaches a constant when the size of the concrete structure becomes sufficiently
large.
It is apparent from the preceding discussion that the presence of fracture
process zone generally deters the direct application of LEFM to concrete. One needs to
use nonlinear fracture mechanics to simulate the mechanism and process of the
fracture process zone, or alternatively, to adopt a relatively large specimen to minimize
the size effect, so that LEFM would be applicable. In the cement mortar matrix, on the
contrary, since the size of fine aggregate is much smaller compared to the coarse
aggregate in concrete, the effect of the interfacial crack and non planar crack
propagation in the fracture process zone is insignificant. The typical load-displacement
data of the fracture tests, conducted on various cement mortar specimens with fine
aggregate size less than 1-2mm, showed that a linear elastic relationship would be
72
predominant, and the short non-linear region just before the maximum load was
negligible, such that LEFM would be reasonably applicable to study their fracture
behaviour (Nallathambi et al., 1984; Dasgupta et al., 1998).
Therefore, to start with the investigation of the fracture of concrete, the matrix
(that is, the cement mortar) has been chosen as the test material for the present study.
This would require a relatively small-sized specimen. Ordinary Portland cement and
natural fine-graded river sand, with a specific grading of between No.100 (150µm) and
No.16 (1.18mm) sieves, as defined in ASTM E11-01 (American Society of Testing and
Materials, 2001), were used to cast the cement mortar specimens. The purpose of using
fine-graded sand was to effectively eliminate the effect of aggregate size and reduce
the size of fracture process zone, so that LEFM could reasonably be applied (Mai,
1984). The mix proportions of cement : water : sand was 1.0 : 0.31 : 0.8. The materials
were mixed in a drum mixer for a period of not less than 10 minutes to ensure the
uniformity of the specimen. Stainless steel moulds were used to prepare the specimens,
which were cured in the fog room for 28 days. The procedures for mixing and testing
of samples were in accordance to BS 1881: Parts 125 (British Standards Institution,
1986), 116 (British Standards Institution, 1983a) and 121 (British Standards Institution,
1983b), respectively. The mean compressive cube strength, Young’s modulus and
Poisson’s ratio were measured as 68MPa, 28GPa and 0.2, respectively. The typical
compressive load – axial strain curves for evaluating Young’s modulus and
compressive load - axial and transversal strain curves for Poisson’s ratio are shown in
Figures 4.2 and 4.3, respectively.
73
Figure 4.2 Typical compressive load - axial strain curves for evaluation
of Young’s modulus
0 0.02 0.04 0.06 0.08
Axial s
t
r
ain (10
-6
)
0
40
80
120
160
Comp
r
essive load (kN)
74
Figure 4.3 Typical compressive load - axial and transversal strain
curves for evaluation of Poisson’s ratio
0 200 400 600 800
Mic
r
ost
r
ain (10
-6
)
0
40
80
120
160
Comp
r
essive loa
d
(
k
N)
Transversal strain
Axial strain
75
4.1.2 Test Set-up
In the following fracture testing, the specimens would have a sharp pre-crack
and would be subject to unstable crack propagation, where the load would drop
suddenly once the crack started to propagate. Therefore, the open loop test would be
applied.
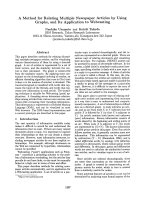
The laboratory tests were conducted on an INSTRON 1334 servo-hydraulic
testing machine, with a maximum 500kN load capacity, and 75mm stroke
displacement of the cross-head (Figure 4.4). The loading rate was maintained at
0.1mm/min, so that inertial effects would be insignificant. The force applied, and
corresponding stroke displacement of the cross-head of the testing machine, were
recorded automatically throughout the test.
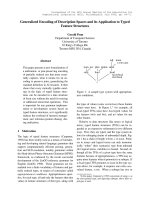
In the following discussion, various fracture tests will be found to require the
application of a groove in the specimen, so that proposed pure or mixed mode fracture
may be guided along the desired direction. The cutting of the groove was carried out
by a Norton Clipper Model ECW “Major” masonry bench saw (Figure 4.5). The
maximum spindle speed of the rotating blade is 2700 rounds per minute. It is designed
for cutting operations of a wide range of masonry, refractory and natural stone
products.
76
Figure 4.4 INSTRON 1334 servo-hydraulic testing machine
77
Figure 4.5 Norton Clipper Model ECW “Major” masonry bench saw
78
4.2 Pure Modes I and II Fracture Testing
Before verification of the proposed mixed mode I–II–III fracture criterion,
given by foregoing equation (2.80) of §2.4, it would be necessary to evaluate the pure
mode I, II and III fracture toughness, K
IC
, K
IIC
and K
IIIC
, respectively, of the test
material. The evaluation of K
IC
and K
IIC
will be dealt with in the following discussion,
while that of K
IIIC
will be addressed in subsequent §4.3.
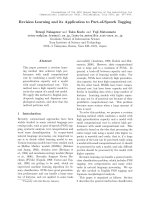
4.2.1 Geometry of Specimen
Beam specimens with centre-notch or pre-crack have been widely used to
study the fracture behaviour of cementitious material (Bazant and Pfeiffer, 1985;
RILEM, 1985; Li and Ward, 1988; Swartz et al., 1988b; Carpinteri and Swartz, 1991).
Accordingly, it has been adopted in the present study, for pure modes I and II fracture
testing. As shown in Figure 4.6, the overall dimensions of the beam specimen are
500mm (length) × 100mm (depth) × 80mm (width). The length of the pre-crack was
chosen to be a
0
= 35mm. The pre-crack was formed by a masonry bench saw, after the
specimen had been cured in the fog room for 28 days. In view of the criterion for pure
mode II fracture by the unified model (§1.1.3), an additional pair of side grooves was
cut from the pre-crack of the test specimen to its opposite end, along both faces of the
specimen and in the direction of the pre-crack, in order to provide a throat segment of
sufficient narrowness to activate and guide the crack extension along the θ
0C
plane.
The thickness of the throat segment was chosen to be t = 15mm.
79
Figure 4.6 Geometry of beam specimens for pure modes I and II
fracture tests
W=80
D=100
1
1
Section 1-1
2
Section 2-2
D=100
2
W=80
groove
pre-crack
crack front
throat
crack front
L=500
(a) Test specimen for pure mode I fracture testing
(b) Test specimen for pure mode II fracture testing
L=500
a =35
a =35
t=15
thickness=1
pre-crack
thickness=1
thickness=1
pre-crack face
80
4.2.2 Laboratory Set-up and Test Procedure
The mode I fracture toughness, K
IC
, was determined by the four-point bending
test (Hashimoto, 1982; Dong, 1984; Li and Ward, 1988) for beam specimens, as shown
in Figures 4.7 and 4.8. Each specimen was loaded symmetrically in the manner shown,
so that only tensile stresses would be induced at mid-span, which would correspond to
pure mode I loading. On the other hand, the mode II fracture toughness, K
IIC
, was
determined by the four-point shear test, as shown in Figures 4.9 and 4.10. In order to
obtain pure mode II loading at the crack tip, the beam specimen was loaded
asymmetrically, so as only to give rise to shear stresses at the mid-span of the beam.
In both cases, the beam specimen was simply-supported. The load was
applied via a load cell of 50kN capacity to a steel I-beam, the latter then transferring
the load to the specimen by means of two rollers. The loading rate was maintained at
0.1mm/min until the specimen failed, so that inertial effects would be insignificant.
4.2.3 Determination of Stress Intensity Factors by Finite Element Analysis
The pure mode I fracture of a beam specimen may be modelled as a
two-dimensional problem. Therefore, a two-dimensional plane strain finite element
model was generated using PATRAN Version 8.5 (The MacNeal-Schwendler
Corporation, 1999). Generally, eight-noded, isoparametric, quadratic quadrilateral
elements were used in the model. Around the crack tip, however, eight collapsed
quarter-point elements were used to simulate the singularity at the crack tip, as
81
Bending moment diagram
I-beam
110
500
11030 110
0.5P
Shear force diagram
0.5P
specimen
crack
0.5P
A
30110
0.5P
0.5P
B
0.5P
P
55P
Note: dimensions are in mm.
Figure 4.7 Schematic diagram of pure mode I fracture test
82
Figure 4.8 Experimental set-up of pure mode I fracture test
83
Note: dimensions are in mm.
Bending moment diagram
36.3P
36.3P
0.33P
30
500
11030 110110 110
Shear force diagram
0.33P 0.33P
crack
0.67P
0.33P
specimen
A
groove
0.67P
B
0.33P
I-beam
P
Figure 4.9 Schematic diagram of pure mode II fracture test
84
Figure 4.10 Experimental set-up of pure mode II fracture test
85
outlined in §3.1.1.
As indicated by Figure 4.6(b), for pure mode II fracture testing, due to the
presence of the side grooves, the problem is, in principle, one of three dimensions.
However, it has been found in similar cases that an equivalent two-dimensional plane
strain mesh, based on pro-rating the Young’s modulus to reflect the local thickness of
the specimen, would provide a satisfactory representation (Tamilselvan, 1998).
Therefore, a two-dimensional mesh was similarly generated in the case of the pure
mode I fracture test specimen, except that the pro-rated Young’s modulus was adopted
for those elements lying in the grooved area. Figure 4.11 shows the FE mesh,
consisting of 262 elements and 867 nodes.
The numerical analyses were carried out by ABAQUS Version 5.8 (Hibbitt,
Karlsson and Sorensen, Inc., 1998) and the stress intensity factors were obtained from
the nodal displacements of the nodes around the crack tip by equations (3.11) and
(3.12), as outlined in §3.1. Since it would be difficult to preset a
0
/D and t/W ratios
exactly for the mortar specimen, the method of K-calibration had to be used to evaluate
the stress intensity factors of each specimen. Accordingly, for each of the pure modes I
and II fracture testing meshes, three values of a
0
/D, namely 0.3, 0.35 and 0.4, and
three values of t/W for pure mode II fracture testing mesh, namely 0.125, 0.25 and
0.375, were so analyzed. As a result, three and nine different cases for pure modes I
and II loading were analyzed, respectively. The variations of the stress intensity factors
with a
0
/D and t/W, plotted from these results, are shown in Figure 4.12.
86
Figure 4.11 Finite element model of beam specimen
crack tip
width of groove (for pure mode II test only)
pre-crack
elements around crack tip
eight quarter-point
(a) FE model of specimen
(b) Detailed view around crack tip
view (b)
groove (for pure mode II test only)
extent of groove
87
Figure 4.12 K-calibrations of stress intensity factors
0.3 0.325 0.35 0.375 0.4
a
0
/D
4
4.5
5
5.5
6
K
I0
(
×
10
-3
mm
-3/2
)
0.3 0.325 0.35 0.375 0.4
a
0
/D
0.4
0.8
1.2
1.6
2
K
II0
(
×
10
-3
mm
-3/2
)
t/W =
0.125
t/W
= 0.25
t/W
= 0.375
(a) Mode I stress intensity factor K
I0
(b) Mode II stress intensity factor K
II0
88
4.2.4 Pure Modes I and II Fracture Toughness
Six cement mortar beam specimens were tested, among which three were
subject to pure mode I loading, and the others to pure mode II loading. In all
specimens, the load was found to rise with stroke displacement of the cross-head of the
testing machine, reaching its maximum value when failure occurred (Figure 4.13).
Fracture took place along the self-similar direction, that is
θ
C
= 0, as shown in Figure
4.14.
The modes I and II fracture toughness, K
IC
and K
IIC
, were determined from
corresponding numerical analysis and laboratory testing. For pure mode I loading,
ICC
F
⋅
=
I0I
KK , (4.1)
while for pure mode II loading,
IICC
F
⋅
=
II0II
KK , (4.2)
where K
I0
and K
II0
are the respective stress intensity factors obtained from
K-calibration curves shown in Figure 4.12, based on the actual a
0
/D and t/W ratios
measured on the specimen at fracture, and the fracture loads, F
IC
and F
IIC
, are
measured in the corresponding tests (refer to the appendix of §A.1). The mean values
of K
IC
and K
IIC
, thus determined, were 0.479MPa√m and 0.759MPa√m, respectively.
The fracture toughness in the mode II of deformation was thus greater than that in
mode I, the ratio of K
IIC
/K
IC
being approximately equal to 1.58.
89
Figure 4.13 Typical load-stroke displacement curves for pure mode I
and II fracture
0.0 0.1 0.2 0.3 0.4 0.5 0.6 0.7 0.8 0.9 1.0
Stroke displacement (mm)
0
2
4
6
8
10
12
14
16
18
Load (kN)
Pure Mode II Fracture
Pure Mode I Fracture
F
IC
F
IIC
90
Figure 4.14 Failure of modes I and II fracture test specimens
(a) Mode I fracture test specimen
(b) Mode II fracture test specimen