Mixed mode i II III fracture criterion and its application to cement mortar 3
Bạn đang xem bản rút gọn của tài liệu. Xem và tải ngay bản đầy đủ của tài liệu tại đây (524.06 KB, 23 trang )
91
4.3 Mixed Mode I – III Fracture Testing
4.3.1 Geometry of Specimen and Loading Fixture
To study the fracture behaviour of cement mortar specimens, under
three-dimensional loading in the laboratory, special considerations would have to be
taken into account, with regard to the ease of preparation of the test specimen, and the
provision of an appropriate test set-up and procedure. The former would include the
casting and de-moulding of the specimen, as well as the formation of its pre-crack and
notch, while the latter would consist of the application of mixed mode loading, and the
design of loading fixtures.
Accordingly, the traditional compact tension specimen was adopted for mixed
mode I – III testing, just as its respective pure mode fracture tests. The advantages of the
corresponding test approach adopted will be discussed in following §4.3.2. Figure 4.15
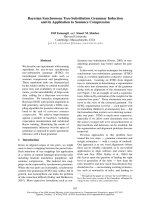
illustrates the design of the mortar specimen. The overall dimensions of the specimen are
160mm × 160mm × 40mm. All the loading holes are of 30mm diameter, while the width
and length of the pre-cast notch are 40mm and 80mm, respectively. A 0.5mm thick steel
plate coated with mould oil was fixed to the mould before casting, to subsequently form
a relatively sharp pre-crack, of 10mm or 12mm length, in the specimen. It was removed
within 3 hours of casting, so as not to adhere to the specimen. Figure 4.16 shows the
mould used to cast the test specimen.
Side grooves were cut into both faces of the specimen, along the self-similar
92
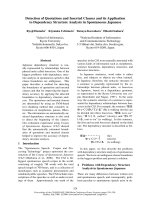
Figure 4.15 Geometrical configuration of mixed mode I – III test specimen
80
160
T=40
1.0 wide groove
30
160
30 3040 30
30
20
30
Plan View
Sectional View
Note: dimensions are in mm.
throat thickness t
pre-crack
length=10 or 22
93
Figure 4.16 Specimen mould for mixed mode I – III fracture test
94
direction of the pre-crack, after the specimen had been cured for 28 days in the fog room.
In pure mode III loading, a crack would extend in the self-similar direction. However,
this is limited to a thin specimen. As shown by Rosenfield and Duckworth (1987), in a
thick specimen, pure mode III loading would cause the crack plane to twist. This
observation was also found prevalent in mixed mode I-III loading. In both cases, the
crack plane would tend to twist into an orientation which is normal to that of the applied
tensile loading. This is because, since the bending stresses across the specimen thickness
induced by mode III loading would be in the opposite sense, across the crack-face,
varying magnitudes of the mode II stress intensity factor K
II0
would develop along the
crack-front. These would be greatest at the specimen surfaces and zero at the neutral axis
– which, in this case, would be at the mid-section of the specimen. As a result, the crack
front would deviate from the self-similar direction, in such a way as to reflect the
variation of K
II0
. Such a re-orientation could give rise to error in analysis, since the
loading, crack front and specimen planes would no longer be orthogonal.
On the other hand, a reduction in the throat thickness would reduce the
longitudinal, tensile and compressive stresses, which would, in turn, mitigate such a
re-orientation. Accordingly, a relatively more uniform stress distribution would thus be
obtained across the crack front. In addition, a groove would reduce the zone of plastic
deformation in front of the crack tip so that brittle fracture would occur more readily.
Also, a grooved specimen would have less resistance to fracture, and thus require a
lower failure load than for a smooth one. Indeed, it would, in principle, ensure that the
specimen would not fail at locations other than the throat. In this connection, a ratio of
throat to smooth specimen thickness of 0.5 was, based on finite element analyses,
estimated to be sufficient for pure mode I and mixed mode I – III fracture testing. Since
95
the pure mode III fracture toughness was expected to be higher than that of pure mode I,
the failure load was expected to be correspondingly higher in pure mode III testing.
Accordingly, a thickness ratio of 0.3 was adopted for such testing, based on preliminary
numerical analysis.
4.3.2 Laboratory Set-up and Test Procedure
The fracture tests were conducted on an INSTRON 1334 servo-hydraulic
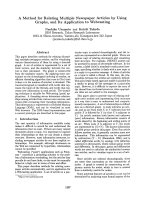
testing machine. A schematic diagram of the test components is shown in Figure 4.17.
The specimen was mounted on a steel loading frame, in two halves, by bolting, and
subjected to pure modes I and III, as well as mixed mode I–III, loading. Two
purpose-built couplings were fabricated, and connected each half of the loading frame to
the INSTRON machine, respectively. This was to prevent the development of moments
at the support points, and thus justify a fully-pinned condition at each point, in the
analysis. The geometrical configuration of the loading fixture is depicted by Figure 4.18.
Differing combinations of modes I and III loading may be achieved by changing the
loading angle α. The five sets of holes on the loading frame correspond to five loading
orientations, namely α=0°, α=22.5°, α=45°, α=67.5° and α=90°. The first and last cases
refer to pure modes III and I loading, respectively, while the rest would be those of
mixed mode I-III loading. A piece of rubber pad was placed between the loading frame
and specimen to mitigate the development of stress concentration.
Figure 4.19 shows the application of mixed mode I-III loading at an angle of
α=45°. The main advantage of the test configuration is that the entire mixed mode I-III
96
Figure 4.17 Schematic diagram of mixed mode I – III test components
loading frame
coupling
specimen
l
o
a
d
i
n
g
a
n
g
l
e
α
F
F
rubber pad
97
Figure 4.18 Geometrical configuration of partial loading fixture and coupling
98
Figure 4.19 Mixed mode I – III fracture test arrangement
(angle of loading of α=45°)
99
spectrum of loading, including pure modes I and III, respectively, may be readily
achieved by the same arrangement of the specimen under co-linear tensile loading.
Accordingly, the coupling is simply connected to the corresponding hole of the loading
frame. Other advantages include the relative ease of specimen preparation, its
compactness, and the ease of setting up and loading. The load was applied
monotonically at a rate of 0.1mm/min, until failure took place in the specimen. The
applied force, and corresponding stroke displacement of the cross-head of the testing
machine, were automatically recorded throughout the test.
4.3.3 Determination of Stress Intensity Factors by Finite Element Analysis
Three-dimensional finite element models representing the experimental set-up
were generated using PATRAN Version 8.5 (The MacNeal-Schwendler Corporation,
1999). Generally, 20-noded, second-order isoparametric, quadratic brick elements were
used in the model. Around the crack front, however, quarter-point, triangular prismatic
elements were used to simulate the strain and stress singularity, as specified in foregoing
§3.1.2. The throat was modelled by 20 layers of elements near the crack front. A typical
FE model of a specimen with a ratio of throat-to-smooth-specimen thickness of t/T=0.5
is depicted in Figures (4.20) – (4.23).
Each half of the loading fixture and coupling were meshed separately with
20-noded brick elements, to which the loading pins were connected (Figure 4.24). The
test specimen was attached to the loading fixture via common nodes with the pins. Five
cases of loading orientation, namely α=0°, 22.5°, 45°, 67.5° and 90°, were modelled.
Figure 4.25 shows the entire assembly for a loading angle of α=45°, which consisted of
100
groove
groove
bottom of groove
throat
Note:
Applying of load is shown in
Figure 4.23
Figure 4.20 Finite element model of mixed mode I – III fracture test specimen
101
Figure 4.21 Mid-sectional view of left half of test specimen
detailed view in
Figure 4.20
102
Figure 4.22 Mid-sectional view showing details at crack front (left half of test specimen)
pre-crack face
half groove width element
at bottom of groove
crack front
103
Figure 4.23 Sectional view of twenty layers of quarter-point triangular prismatic
elements around crack front with cut-out view (left half of test specimen)
crack front
twenty layers of
quarter-point elements
block removed for
cut-out view
half groove width element
at bottom of groove
104
Figure 4.24 Finite element modelling of left half of loading
fixture and coupling
(b) Coupling
rubber
p
a
d
(a) Left half of loading fixture
bolt
bolt
105
Figure 4.25 Finite element model of mixed mode I – III loading (α=45°)
α
F
F
106
3608 elements and 18367 nodes.
In each loading case, the numerical analyses were carried out using the
ABAQUS Version 5.8 (Hibbitt, Karlsson and Sorensen, Inc., 1998) software, and for
each layer of elements across the throat, the stress intensity factors K
I0
, K
II0
and K
III0
,
due to unit loading, were obtained from the nodal displacements at the crack face,
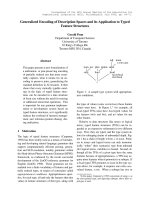
according to equations (3.11), (3.12) and (3.15) respectively. The distributions of stress
intensity factors along the crack front were then obtained. As shown in Figure 4.26, the
distributions of K
I0
and K
III0
were symmetric and relatively uniform in all loading cases,
except near the surface. On the other hand, the values of K
II0
in loading cases 1 to 4 were
distributed anti-symmetrically. It should be emphasized that this development of K
II0
is
not caused by shear loading, but the longitudinal tensile and compressive stresses
induced by bending, due to mode III loading, as specified in preceding §4.3.1.
Nevertheless, the value of K
II0
, at mid-section, would be zero. In addition, based on the
choice of stress intensity factors at mid-section of the specimen, corresponding
experimental results indicated that the effects of K
II0
would not be influential on the
proposed fracture criterion of equation (2.83).
Since it would be difficult to provide for an exact value of t/T ratio for the
mortar specimen, the method of K-calibration had to be used to evaluate the stress
intensity factors of each specimen. Accordingly, for each of the five above-mentioned
loading cases, five values of t/T of specimens were subject to analysis, namely 0.3, 0.4,
0.5, 0.6 and 0.7. In each boundary value problem, the nodal displacements due to unit
loading were determined by finite element analysis, and the values of K
I0
, K
II0
and K
III0
then evaluated. A total of 25 different cases were thus analyzed, and the corresponding
107
Figure 4.26 Distributions of stress intensity factors across throat of specimen (t/T = 0.5)
α = 0°
α = 22.5°
α = 45°
α = 67.5°
α = 90°
-1.0 -0.5 0.0 0.5 1.0
2z/t
-1.0E-002
0.0E+000
1.0E-002
2.0E-002
3.0E-002
4.0E-002
5.0E-002
K
III0
(mm
-3/2
)
-1.0 -0.5 0.0 0.5 1.0
2z/t
-1.0E-002
0.0E+000
1.0E-002
2.0E-002
3.0E-002
4.0E-002
5.0E-002
6.0E-002
K
I0
(mm
-3/2
)
-1.0 -0.5 0.0 0.5 1.0
2z/t
-9.0E-002
-6.0E-002
-3.0E-002
0.0E+000
3.0E-002
6.0E-002
9.0E-002
K
II0
(mm
-3/2
)
108
K-calibration graphs of stress intensity factors, at mid-section of the specimen, versus t/T,
plotted as shown in Figure 4.27.
4.3.4 Comparison of Analytical and Experimental Results
Twenty-nine cement mortar specimens have been tested, among which eight
were subject to pure mode I loading, four to pure mode III loading, and the rest to mixed
mode I-III loading. In all specimens, the load increased monotonically with increase of
stoke displacement of the test machine, and a sudden failure occurred when it reached its
peak value. Fracture was observed to take place along the self-similar direction, that is
θ
C
= 0, as shown in Figure 4.28.
The modes I and III fracture toughness, K
IC
and K
IIIC
, were determined from
numerical analysis and laboratory testing under pure mode loading (in which α=90° and
α=0, respectively), as
CC
F
II0I
KK
⋅
=
(4.3)
and
CC
F
IIIIII0III
KK
⋅
=
. (4.4)
The respective stress intensity factors, K
I0
and K
III0
, were obtained from the
K-calibration curves shown in Figure 4.27, according to the actual throat thickness
measured on the specimen at fracture, where F
IC
and F
IIIC
are the fracture loads recorded
109
Figure 4.27 K
I0
and K
III0
with degree of grooving
0.3 0.4 0.5 0.6 0.7
t/T
0.0E+000
2.0E-002
4.0E-002
6.0E-002
K
I0
(mm
-3/2
)
α = 0°
α = 22.5°
α = 45°
α = 67.5°
α = 90°
0.3 0.4 0.5 0.6 0.7
t/T
0
0.02
0.04
0.06
0.08
K
III0
(mm
-3/2
)
110
in
Figure 4.28 Failure surface of mixed mode I–III fracture test specimen
111
in the corresponding tests. The mean values of K
IC
and K
IIIC
, thus determined, were
0.468MPa√m and 1.12MPa√m, respectively. It is thus apparent that the K
IC
value is very
close to that obtained from the four-point bending test reported in foregoing §4.24, that
is, 0.479MPa√m.
The fracture toughness, in mode III deformation, was thus significantly greater
than that in mode I, the ratio of K
IIIC
/K
IC
being approximately equal to 2.4. This
confirms the observation that cement mortar is more resistant to shear than tensile
deformation. A similar relationship has been reported for other brittle materials, like
hot-pressed silicon nitride and glass, for which the ratios were found to be 1.5 and 3.59
respectively (Petrovic, 1985).
For each of the mixed mode loading cases, K
Iθ
and K
IIIθ
(where θ=0) were
determined as
C
F
⋅
=
I0Iθ
KK (4.5)
and
C
F
⋅
=
III0IIIθ
KK , (4.6)
where F
C
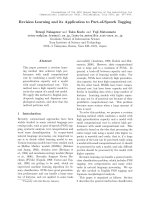
was the fracture load measured in the corresponding tests. The tests results are
depicted in the plot between the normalized unified pure mode I and III stress intensity
factors, K
Iθ
/K
IC
and K
IIIθ
/K
IIIC
, respectively, of Figure 4.29. The figure also shows the
unified fracture envelope, specified by equation (2.83), superimposed on the results of
112
the fracture tests. Accordingly, there is agreement - within 10% - between the predicted
and experimental results.
The experimental and numerical results of each tested specimen are presented
in the appendix of §A.2.
113
Figure 4.29 Comparison of unified fracture criterion with mixed mode
I–III fracture test results
0.0 0.2 0.4 0.6 0.8 1.0
K
I
θ
/ K
I
C
0.0
0.2
0.4
0.6
0.8
1.0
K
III
θ
/ K
III
C
Test results
(
K
I
θ
K
IC
)
2
+
(
K
III
θ
K
IIIC
)
2
= 1