Effect of muscarinic agents on sclera fibroblast and their role in myopia
Bạn đang xem bản rút gọn của tài liệu. Xem và tải ngay bản đầy đủ của tài liệu tại đây (433.79 KB, 9 trang )
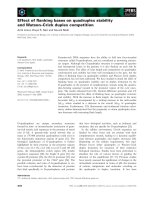
Fig 3.
Sclera from myopic eye Sclera from non myopic control eye
Fig3A. Chick sclera from experimentally myopic and non myopic control eye.
The outer fibrous layer thinned while the inner cartilaginous layer thickened.
Atropine receiving myopic eye Atropine receiving non myopic control eye
Fig3B. Chick sclera of atropine treated experimentally myopic and control eye.
Atropine increased thickness of fibrous layer and decreased cartilaginous layer.
The change was towards to a structure of sclera from non myopic eye.
Fig 8A. Effect of atropine inhibiting SF cell proliferation in culture.
Chick SF were incubated with atropine. Phase contrast photomicrographs were taken after 24
hrs (magnification x100).
A. Control culture without atropine.
B. Atropine 100 µM caused a significant growth inhibition.
The cell morphology appeared to be undisturbed.
Fig8B. Effect of atropine on DNA integrity (TUNNEL assay).
Chick SF were grown on chamber slides and incubated with atropine (0.1-100 µM). TUNNEL
assay was performed after 24 hrs and photomicrographs are taken (magnification x100).
Positive control D. Atropine 10 µM
(control culture stimulated to undergo
apotosis produced dark brown stain
in apoptic nuclei)
B. Atropine 0.1 µM E. Atropine 100 µM
C. Atropine 1 µM
Fig10A. Immumocytochemistry of mAchR subtypes in human SF in culture. Subtype selective
antibodies bound to cultured SF demonstrates the presence of m1, m2, m4 receptors (shown in
green). When secondary FITC labeled antibody was used without the primary antibody no
significant binding was observed (negative control).
m1 m4
m2 negative control
Fig10B. Protein corresponding to mAchR subtypes m1,m2,m4, and m5 identified in mouse
sclera by immunoblotting. Subtype selective antibodies bound to specific protein bands in
mouse sclera extract. Sepcific bands did not appear in the control experiments, in which the
primary antibody is omitted. Numbers on left of panels are molecular mass markers (Kd).
M1 Negative control
M2 M4
M5
Fig 21A. Chick sclera protein extract and SF cell lysates were analysed by gelatin zymography.
1 2 3 4
Lane 1 and 2; chick sclera fibroblast cell lysate,
Lane 3 and 4; chick sclera protein extract
Fig19B. Westernblot ananlysis of chick sclera protein extract and SF cell lysate using antihuman
MMP-2 antibody.
1 2 3
Lane 1 ;MMP-2 standard,
Lane 2 ; chick sclera fibroblast cell lysate
Lane 3 ; chick sclera protein extract
Fig19C. Western blot analysis of chick sclera protein extract and SF cell lysate using anti human
MMP-9 antibody.
1 2 3
Lane 1: chick sclera fibroblast cell lysate
Lane 2: chick sclera protein extract
Land 3: MMP-9 standard
Diagram 1. Mechanism of growth factor action and related events
Diagram 2. Interaction between muscarinic and EGF receptors in growth regulation.
Diagram 3. Mechanism of G protein coupled m1 receptor.