ielts writing task 1 viet general statement cho line graph
Bạn đang xem bản rút gọn của tài liệu. Xem và tải ngay bản đầy đủ của tài liệu tại đây (246.49 KB, 4 trang )
VnDoc - Tải tài liệu, văn bản pháp luật, biểu mẫu miễn phí
IELTS WRITING TASK 1
VIẾT GENERAL STATEMENT CHO LINE GRAPH
Liệu các bạn có thắc mắc revise Introductory expressions cho phần General Statement
trong bài report biểu đồ của bài thi IELTS Writing, mời các bạn tham khảo một vài cách
nhận biết thông tin để viết general statement cho line graph nhé!
Cách viết General Statement cho Line Graph
1. Useful Introductory expressions for IELTS WRITING TASK 1
It is clear from the graph that….
As can be seen, …
The most striking feature from the graph is that…
As is illustrated in the graph, …
It can be clearly seen that …
In general/ Generally speaking, …
It is noticeable that…
As is highlighted in the graph, …
2. Different ways to identify the most striking feature in a line graph of IELTS
Writing Task 1
2.1 Nếu line graph có 1 xu hướng chung, hãy mô tả xu hướng đó
>>> Cấu trúc:
………….the general trend was upward/downward.
………… something experienced/witnessed/saw (a similar) upward/downward
trend(s) over the given period.
…………there was/were (a similar) upward/downward trend(s)in something
(time phrase).
VnDoc - Tải tài liệu, văn bản pháp luật, biểu mẫu miễn phí
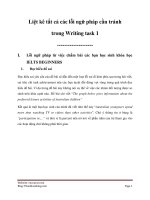
Line graph 1: Upward trend
Kết hợp với phần Expressions of prediction các bạn sẽ có
>>> Ví dụ:
Eg1: It is clear that the figures for these countriesare estimated to see upward
trends over the given period.
Eg2: As can be seen, after noticeable rises in thefirst 70 years, the forecast is that
there will be upward trends in the figures for these countries in the rest of the given
period.
2.2 Nếu line graph có 2 xu hướng đối lập nhau, hãy mô tả cả 2 nhóm xu hướng đó
>>> Cấu trúc:
It can be clearly seen that there was (a/an) upward/downward trend(s) in…….,
while/whereas ……… witnessed (a/an) downward/upward trend(s).
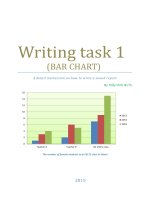
Line graph 2: Two general trends – Upward and downward
>>> Ví dụ:
It can be clearly seen that there were upward trends in the amounts of Hamburger
and Fish&Chips consumption, whereas the figure for Pizza witnessed a downward
trend over the given period.
2.3 Nếu line graph không có chung xu hướng rõ ràng, và thứ tự các đường là phân
biệt, hãy mô tả đường cao nhất
>>> Cấu trúc 1:
Sử dụng so sánh hơn kém khi có 2 đường: As is highlighted in the
graph, ……A… was generally higher/more popular than … B……
VnDoc - Tải tài liệu, văn bản pháp luật, biểu mẫu miễn phí
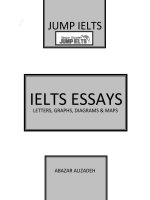
Line graph 3: No general trend – Comparative
>>> Ví dụ:
As is highlighted in the graph, Pop Parade was generally more popular than Music
Choice over the given period.
>>> Cấu trúc 2:
Sử dụng so sánh bậc nhất khi có nhiều hơn 2 đường: It is noticeable
that … A… was generally highest/ most popular ……
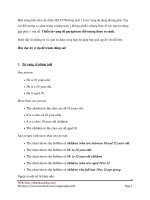
Line graph 4: Many lines – Different trends – Superlative
>>> Ví dụ:
It is noticeable that the amount of goods transported by road was highest in this
period.
VnDoc - Tải tài liệu, văn bản pháp luật, biểu mẫu miễn phí
2.4 Nếu line graph không có xu hướng chung rõ ràng và các đường có giao cắt rõ
ràng chia cắt thành các giai đoạn, hãy mô tả thời điểm đạt giá trị lớn nhất của từng
đường
>>> Cấu trúc:
As is shown in the graph,… A… was highest at/on…. (timephrase),
whereas …… B… was most popular at/on…. (time phrase)…
Line graph 5 – no general trend with clear small periods of comparison
>>> Ví dụ:
As is shown in the graph, the percentage of radio listeners was highest at about 8
A.M, whereas TV was most popular at 9 P.M.