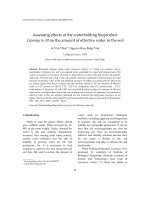
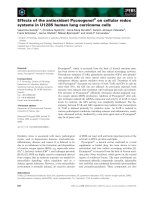
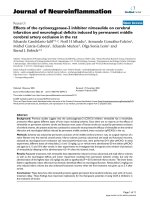
effects of magnesiumphosphoruspotassium containing in water on molting, growth and survival rate of the white shrimp (litopenaeus vannamei) juveniles, reared in low salinity water
Bạn đang xem bản rút gọn của tài liệu. Xem và tải ngay bản đầy đủ của tài liệu tại đây (6.94 MB, 70 trang )
CAN THO UNIVERSITY
COLLEGE OF AQUACULTURE AND FISHERIES
EFFECTS OF MAGNESIUM-PHOSPHORUS-POTASSIUM
CONTAINING IN WATER ON MOLTING, GROWTH AND
SURVIVAL RATE OF THE WHITE SHRIMP (Litopenaeus
vannamei) JUVENILES, REARED IN LOW SALINITY WATER
By
TRAN THI BE GAM
A thesis submitted in partial fulfillment of the requirements for the degree
of Bachelor of Aquaculture
Can Tho, 12/2013
CAN THO UNIVERSITY
COLLEGE OF AQUACULTURE AND FISHERIES
EFFECTS OF MAGNESIUM-PHOSPHORUS-POTASSIUM
CONTAINING IN WATER ON MOLTING, GROWTH AND
SURVIVAL RATE OF THE WHITE SHRIMP (Litopenaeus
vannamei) JUVENILES, REARED IN LOW SALINITY WATER
By
TRAN THI BE GAM
A thesis submitted in partial fulfillment of the requirements for the degree
of Bachelor of Aquaculture
Supervisor
MSc. HUYNH TRUONG GIANG
Can Tho, 12/2013
i
ACKNOWLEDGEMENT
Foremost, I would like to express my sincere gratitude to my supervisor, MSc. Huynh
Truong Giang for the continuous support of my study, for his invaluable guidance,
advice, encouragement, and immense knowledge. His guidance helped me in all the
time of research and writing of this thesis. I want to dedicate my great appreciation to
Ms. Phan Thi Cam Tu for her kind help in finishing the research.
Many thanks are also giving to all other doctors of the college of aquaculture and
fisheries, and especially to those of the Department of Applied Hydrobiology for
providing me with great working and learning conditions.
I would love to express my sincere appreciation to many of my friends, especially
Pham Thi Trang Nhung, Le Phuoc Dai, Bui Doan Luan, and Tran Trung Giang for
their unconditionally kind help throughout the experimental period.
Last but not the least, I really want to thank my family for their great life-time support
which makes everything possible for me.
Tran Thi Be Gam
ii
APPROVEMENT
The thesis “Effect of Mg-P-K levels containing in water on molting, growth, and
survival rate of the white shrimp L. vannamei juveniles, reared in low salinity
water” was completed base on my results.
Supervisor’s signature Student’s signature
iii
ABSTRACT
The objective of the present study was to evaluate the effects of several aqueous
magnesium, potassium, and phosphorus on survival, growth, and molting interval of
L.vannamei at salinity 2‰. The study consisted of two experiments. The study
consisted of two experiments. For the first experiment with postlarvae 15-day, aqueous
Mg-K-P were supplemented directly into water at three different levels (10-5-5; 20-10-
10; 40-20-20 mg/L) and a treatment with no supplemented minerals severed as the
control group. In the second experiment, concentrations of minerals added in the
treatments were the same as the first experiment but conducted with juvenile shrimp
(4.7±0.02 g). Each treatment comprised of 14 shrimp. Each shrimp was individually
cultured in a small net cage. Fourteen small net cages were allocated in a composite
tank with a capacity of 1 m
3
. Molting interval, survival, growth rate were recorded.
Results from the first experiment indicated no significant differences (p>0.05) in
survival and growth of shrimp among treatments. Results from the second experiment
reveal a significant difference in survival between 10-5-5 treatment (14.29%) and all
other treatments (28-36%). The results showed highest weight gain (1.7±0.27 g),
length gain (1.81±0.29 cm), SGR (1.71±0.35% day
-1
) and DWG (0.08±0.016 g day
-1
)
in 20-10-10 treatment. However, no differences in molting interval were observed.
These results suggest supplementation of mineral are common in low salinity water.
Keywords: Litopenaeus vannamei, low salinity, magnesium, phosphorus, potassium,
molting.
iv
TABLE OF CONTENTS
Pages
ACKNOWLEDGEMENT i
APPROVEMENT ii
ABSTRACT iii
TABLE OF CONTENTS iv
LIST OF TABLES vii
LIST OF FIGURES viii
LIST OF FIGURES viii
LIST OF ABBREVIATIONS ix
LIST OF ABBREVIATIONS ix
Chapter 1 1
INTRODUCTION 1
1.1 Problem identification: 1
1.2 Objective: 2
1.3 Research content: 2
Chapter 2 3
LITERATURE REVIEW 3
2.1. Biological characteristics of white shrimp (Litopenaeus vannamei): 3
2.1.1. Classification: 3
2.1.2. Distribution: 3
2.1.3. Life cycle: 3
2.1.4. Growth characteristics: 4
2.1.5. Molting cycle: 4
2.1.6. Nutrition demand: 6
v
2.2 Osmoregulation of shrimp 7
2.3 Effect of low salinity on the growth and survival rates of white shrimp
(L.vannamei) 8
2.4 White shrimp (L. vannamei) production in the world: 8
2.5 White shrimp (L. vannamei) production in Vietnam: 9
Chapter 3 10
MATERIALS AND METHODS 10
3.1 Time and location 10
3.2 Materials 10
3.2.1. Shrimp culture 10
3.2.2. Equipment and chemicals 10
3.3 Research design and experimental approaches 10
3.3.1 Experiment 1: Effects of Mg-P-K supplemented in water on growth and
survival rate of white shrimp (L. vannamei) 10
3.3.2. Experiment 2: Effects of Mg-P-K supplemented on molting intervals of
white shrimp L. vannamei (4-5 g) that reared in low salinity water 12
3.4 Data analysis 13
Chapter 4 14
RESULTS AND DISCUSSIONS 14
4.1 Experiment 1: Effects of Mg-P-K supplemented in water on growth and survival
rate of white shrimp (L. vannamei) 14
4.1.1 Water quality 14
4.1.1.1 Temperature (
o
C) and pH 14
4.1.1.2 Total ammonia nitrogen (TAN), Nitrite (N-NO
2
-
), and Phosphate (P-
PO
4
3-
) 14
4.1.1.3 Calcium (Ca
2+
), Magnesium (Mg
2+
), Potassium (K
+
) concentrations and Mg:Ca
ratios 15
vi
4.1.2 Growth performance 16
4.1.2.1 Weight Gain (WG), Daily Weight Gain (DWG), Specific Growth Rate
(SGR) 16
4.1.2.2 Length Gain (LG), Daily Length Gain (DLG), Specific Growth Rate
(SGR) 17
4.1.3 Survival rate (%) 17
4.2 Experiment 2: Effects of Mg-P-K supplemented on molting intervals of white
shrimp L. vannamei that cultured in low salinity water 19
4.2.1 Water quality 19
4.2.1.1 Temperature, pH 19
4.2.1.2 Total ammonia nitrogen (TAN), Nitrite (N-NO
2
-
), Phosphate (P-PO
4
3-
)
19
4.2.1.3 Calcium (Ca
2+
), Magnesium (Mg
2+
), Potassium (K
+
), and Mg:Ca ratios
20
4.2.2 Growth performance of white shrimp L. vannamei 21
4.2.2.1 Molting intervals of white shrimp L. vannamei 21
4.2.2.2 Weight gain of white shrimp after molting 22
4.2.2.3 Length gain of white shrimp after molting 23
4.2.2.4 Growth performance of white shrimp at the end of experiment 24
4.2.2.5 Survival rate 25
Chapter 5 27
CONCLUSIONS AND RECOMMENDATIONS 27
5.1 Conclusions 27
5.2 Recommendations 27
REFERENCES 28
vii
LIST OF TABLES
Table 1: Events of possible technological significance occurring in the molting cycle
of shrimp 5
Table 2: Ionic composition of seawater and freshwater 7
Table 3: Production of white shrimp in North, Central and South of Viet Nam in 20099
Table 4: Methods for water quality sampling and analysis 11
Table 5: Temperature and pH in Experiment 1 14
Table 6: TAN, N-NO
2
-
and P-PO
4
3-
in Experiment 1 15
Table 7: K
+
, Mg
2+
and Ca
2+
concentrations in Experiment 1 15
Table 8: Hardness and Mg:Ca ratios for white shrimp reared in low salinity water in
Experiment 1 16
Table 9: Growth performance indices of white shrimp L.vannamei that reared in
salinity 2‰ with different Mg-K-P supplemented levels in Experiement 1 17
Table 10: Initial length (cm), final length (cm), daily length gain (cm day
-1
), specific
growth rate (% day
-1
), and length gain (g) for L.vannamei reared in salinity 2‰ in
Experiment 1 17
Table 11: Temperature and pH in Experiment 2 19
Table 12: TAN, Nitrite, and Phosphate for white shrimp reared in low salinity water in
Experiment 2 20
Table 13: Potassium, magnesium, and calcium for white shrimp reared in low salinity
water in Experiment 2 20
Table 14: Hardness and Mg:Ca ratios for white shrimp reared in low salinity water in
Experiment 2 21
Table 15: Weight gain (g), daily weight gain (g day
-1
), specific growth rate (% day
-1
)
of shrimp reared in low salinity water in Experiment 2 25
Table 16: Length gain (cm), daily length gain (cm day
-1
), specific growth rate (% day
-
1
) of shrimp reared in low salinity water in Experiment 2 25
viii
LIST OF FIGURES
Fig. 1: White shrimp (Litopenaeus vannamei) 3
Fig. 2: Life cycle of Litopenaeus vannamei 4
Fig.3. Net cage used in Experiment 2 13
Fig.4: Survival rate (%) of shrimp that reared in low salinity (2‰) at different Mg-K-P
supplements. Each bar represents the mean value from 3 replicates with a standard
error 18
Fig.5: Molting intervals of white shrimp (L.vannamei) 22
Fig.6: Weight gain of L.vannamei after molting 22
Fig.7: Mean weight of shrimp after each molting 23
Fig.8: Length gain of L.vannamei after each molting 23
Fig.9: Mean length of shrimp after each molting 24
Fig. 10: Survival rate (%) of shrimp in Experiment 2 26
ix
LIST OF ABBREVIATIONS
L.vannamei Litopenaeus vannamei
Mg Magnesium
P Phosphorus
K Potassium
Ca Calcium
Ex. Experiment
Trt. Treatment
MT Metric tons
TAN Total ammonia nitrogen
FAO Food and Agriculture Organization
NO
2
-
Nitrite
Fig.: Figure
Wt. Weight
Lt. Length
WG Weight gain
LG Length gain
DWG Daily weight gain
DLG Daily length gain
SGR Specific growth rate
1
Chapter 1
INTRODUCTION
1.1 Problem identification:
White shrimp (Litopenaeus vannamei) had been exploited and appeared on the
consumer market of the United State since 1709. Currently, they are widely cultured in
countries of Asia-Pacific. The introduction of white shrimp to Asia has given rise to a
bloom in farming of this species in China, Thailand, Indonesia and Viet Nam in the
last decade, resulting in an almost complete shift from the native black tiger shrimp
(Penaeus monodon) to this introduced species in Southeast Asia. In the year 2010,
global aquaculture for this species reached 2.7 million metric tons (MT) (FAO, 2012).
In Viet Nam, cultivation of white shrimp L. vannamei culture has been growing
rapidly and become an important economic activity in Mekong Delta. In fact, white
shrimp production has been increasing since 2000 and the export value reached 676.6
million USD (177,817 MT) in 2012 (VASEP, 2013).
There are many problems which farmer needs to care for culturing white shrimp.
Requirement nutrients of white shrimp, especially minerals, are most important.
Around twenty-two minerals, both macro and micro, have been found essential to
animals, fish and shrimp. However, unlike fin-fishes, there is relatively fewer
information on the mineral needs of shrimps. Most of the information available for
mineral requirements has been done under laboratory conditions using purified or
semi-purified diets and scanty information is available on elemental requirements
under practical culture conditions (Tacon, 1987).
White shrimp L. vannamei has rapid growth, short molting cycle cause high demand
minerals. Molting, especially, is fundamental for growth in shrimps. Shrimp generally
lose most of their body content of minerals during molt and replace it from the water.
White shrimp live in an environment that is hypertonic and continually drink small
amounts of water and thus they can absorb some minerals directly from the water via
the gills, skin or both (Tacon, 1987). Although minerals are very important, the study
of mineral requirements of white shrimp has been quite neglected. Besides that, the
ability of white shrimp L.vannamei to tolerate a wide range of salinities (0.5-40 ‰)
has made it a popular species for low salinity culture. However, in low salinity water,
problems still arise from deficiencies in minerals of pond water. Therefore, direct
supplementation of macro-minerals as magnesium, phosphorus, and potassium in the
water instead of food are of primary concern. In this study, molting stage durations,
growth performance indices and survival rate of white shrimp L. vannamei were
examined.
2
1.2 Objective:
This study was undertaken on L.vannamei to evaluate the effect of Mg-P-K levels
containing in low salinity water in molting cycle, growth, and survival rate in order to
propose potential use for white shrimp L. vannamei culture in low salinity area in
Mekong Delta.
1.3 Research content:
- Research on effects of different Mg-P-K levels on growth and survival rate in
white shrimp L. vannamei postlarvae.
- Research on effects of different Mg-P-K levels on molting intervals of white
shrimp L. vannamei juveniles.
3
Chapter 2
LITERATURE REVIEW
2.1. Biological characteristics of white shrimp (Litopenaeus vannamei):
2.1.1. Classification:
Phylum: Arthropoda
Subphylum: Crustacea
Class: Malacostraca
Order: Decapoda
Family: Penaeidae
Genus: Litopenaeus
Species: L. vannamei
Fig. 1: White shrimp (Litopenaeus vannamei)
(Source: www.fao.org)
2.1.2. Distribution:
The white shrimp is native to the Eastern Pacific coast from Sonora, Mexico in the
North, through Central and South America as far South as Tumbes in Peru, in areas
where water temperatures are normally >20 °C throughout the year. White shrimp L.
vannamei live in tropical marine habitats (FAO, 2006).
2.1.3. Life cycle:
Adult Litopenaeus vannamei spawn in the ocean, releasing their eggs into the water.
The eggs hatch into a non-feeding nauplius larva, which lasts about two days, before
molting into a zoea stage (4-5 days), a mysis stage (3-4 days) and a postlarva (10-15
4
days) (Barnes 1983; FAO, 2011 – stage durations are given for unspecified
aquaculture conditions). Postlarvae and juveniles tend to migrate into estuaries, while
adults return to the sea for spawning (FAO, 2011).
Fig. 2: Life cycle of Litopenaeus vannamei (Bailey-Brock and Moss, 1992)
2.1.4. Growth characteristics:
Males become mature from 20 g and females from 28 g onwards at the age of 6–7
months. L. vannamei weighing 30–45g will spawn 100,000–250,000 eggs of
approximately 0.22 mm in diameter. Hatching occurs about 16 hours after spawning
and fertilization. The first stage larvae, termed nauplii, swim intermittently and are
positively phototactic. Nauplii do not feed, but live on their yolk reserves. The next
larval stages (protozoea, mysis and early postlarvae respectively) remain planktonic
for some time, eat phytoplankton and zooplankton, and are carried towards the shore
by tidal currents. The postlarvae change their planktonic habit about 5 days after
molting into postlarvae, move inshore and begin feeding on benthic detritus, worms,
bivalves and crustaceans (FAO, 2012).
2.1.5. Molting cycle:
Molting in shrimp is a phenomenon that always occurs in the process of shrimp culture. The
size of shrimp meat grew while the outer shell does not grow large, so for the adjustment,
the shrimp will release the old shell and reshape a new shell with conducted by calcium.
This molting process resulted in increased body size periodically. After a hard outer shell,
shrimp body size remains until the next molting cycle.
Duration of the molting cycle depends on the species and age of the shrimp. Molting
frequency on white shrimp decreased along with increasing the size of shrimp. The
larval stage, the white shrimp molting every 40 hours at 28
o
C while juveniles
5
weighing 1-5 g, molting every 4-6 days. The next on the weight of 15 g, the period of
molting occurs every 2 weeks (Cortell, 2012).
Molting phase is the most important phase for shrimp, because at this phase, the
shrimp in a most weak condition and not yet hardened outer shell layer, so making it
very susceptible to diseases infection and attacked by other shrimps (cannibalism) and
predators. Besides susceptible to diseases and predators, in molting phase, the shrimps
are also very vulnerable to environmental changes, whether environmental changes
that occur in ponds and the changes that occur because of weather changes.
Shrimp have to face the pervasive influence of the molt cycle on their internal
environment during their entire life cycle (Passano, 1960; Bliss, 1985; Garcia, 1988;
Franco et al., 2006).
Table 1: Events of possible technological significance occurring in the molting cycle of shrimp
(Cobb and Bryant F, 1977)
Stage of molt Status of cuticle Events
Postmolt Initially soft becoming
increasingly harder
- Continued water absorption
- Tissue growth begins
Intermolt Hard - Main tissue growth
- Accumulation of melanin
precursor (storage form of
N-acetyldopamine) and
other organic reserves
Premolt Hard but gradually thinned
- Epidermal and
hepatopancreas activation
- Activation of N-
acetyldopaamine precursor
- Epicuticle formation begins
utilizing N-acetyldopamine
- Major portion of skeletal
re-absorption
- Ecdysial sutures open
Molt Soft - Beginning water absortion
6
2.1.6. Nutrition demand:
- Protein: Protein, which is required for growth and maintenance, is an expensive
component in a diet. Salinity also is among the factors known to influence the protein
requirement of shrimp (Boonyaratpalin, 1996). Some studies comparing the optimum
dietary protein level for shrimp. For juveniles, Colvin and Brand (1977) reported less
than 30% to be the protein requirement while Kureshy and Davis (2002) found a
maximum protein requirement at 32% for juveniles and sub-adults of L. vannamei.
The first report of protein requirement for post-larvae, raised in tanks during one
month (Colvin and Brand, 1977), indicated 30-35%.
- Phospholipids and cholesterol are two essential lipids for penaeid shrimp.
Cholesterol is an essential lipid that is closely involved in the process of molting in
shrimp (Kanazawa et al. 1975) and is important in enhancing shrimp growth (Gong et
al. 2000). Phospholipids may be contributive to facilitating molting process as well.
Cholesterol requirement can be lowered as dietary phospholipid level increases. A
combination of 0.05% cholesterol and 5% phospholipid is recommended for intensive
L. vannamei culture (Gong et al., 2001).
- Minerals: Marine shrimps absorb minerals from their aquatic environment aside
from the minerals that come from the food they eat (F. Piedad-Pascual, 1989).
Minerals are essential components of bones, teeth, fin, and exoskeleton. These are
necessary for maintenance of osmotic pressure, acid-base balance, thus the regulation
of pH of blood, haemolymph, urine, and other body fluids. They are also components
of soft tissues, enzymes, some vitamins, hormones and respiratory pigments and are
essential for muscle contraction and transmission of nerve impulses (Davis, 1996).
Shrimps need minerals for growth because of repeated molting wherein minerals are
lost (Kanazawa, 1985).
Phosphorus: Phosphorus is an element shrimp cannot find in reasonable
amount in seawater. In contrast to calcium, phosphorus has to be added to the
diet, but according to the pH of the anterior part of the stomach differences are
expected in relation to the nature of the phosphate salt (Velasco et al., 2001).
As a component of these important biological substances, phosphorus plays a
central role in energy and cell metabolism.
Magnesium: magnesium plays a role in the normal metabolism of lipids,
proteins, and carbohydrates serving as a cofactor in a large number of
enzymatic and metabolic reactions (Davis and Lawrence, 1997). Seawater
typically contains high levels of magnesium is excreted by marine crustacean
and fish, resulting in blood levels lower than of the external medium (Dall and
Moriarty, 1983). Cheng et al. (2005) reported a dietary Mg
2+
requirement for
7
optimal growth of 2.6-3.46 g Mg
2+
kg
-1
for L.vannamei reared in low salinity
waters.
Potassium: Compared with the other essential ions, potassium is a minor
constituent in brackish and freshwater (Horne, 1969), but it plays important role
in normal growth, survival, and osmoregulatory function of crustaceans (Mantel
and Farmer, 1983). When reared in potassium deficient seawater, L.vannamei
displayed anorexia, low activity, poor growth and even death (Zhu et al., 2004).
Calcium: the calcium requirement may be totally or partially met though
absorption of calcium from the water (Deshimaru and Yone, 1978). The
regulatory mechanism for calcium is obviously presented with an added
challenge during the molt cycle of crustaceans, when there are large fluxes of
calcium. Among various species, the concentration of total calcium consistently
shows an increase during the period prior to the molt (Greenaway, 1985).
Table 2: Ionic composition of seawater and freshwater
Ingredient
Concentration (mg/L)
in freshwater
Concentration (mg/L)
in sea water
Magnesium (Mg
2+
) 4 1,294
Calcium (Ca
2+
) 15 412
Potassium (K
+
) 2 399
Phosphorus (P) 20 35
(Source: Nicol, 1960; Burton, 1976; Liss, 1976)
2.2 Osmoregulation of shrimp
Osmoregulation is an essential physiological process for the majority of aquatic
crustaceans since it enables them to cope with the changes or discrepancies between
the ion concentrations within their bodies and the aquatic environments they inhabit.
The degree of the osmoregulatory response is largely salinity dependent, the actual
strength is highly species-specific (Romano and Zeng, 2012).
Huong and Wilder (2008) reported hemolymph osmolality of the shrimp (Litopenaeus
vannamei) exposed to salinities of 0.5‰ or 1‰ decreasing rapidly from 800 mOsm to
540 mOsm after 6 hours. Levels also dropped dramatically from 800 mOsm to 560
mOsm in shrimp exposed to 3‰ after 6 hours and 1 day. Hemolymph osmolality of
the white shrimps changed after exposure to low salinities, showing hyper-
osmoregulatory behavior in low salinities. The white shrimp (Litopenaeus vannamei)
can not survive in low salinities (<1‰) because it loses the capacity to osmoregulate.
8
2.3 Effect of low salinity on the growth and survival rates of white shrimp
(L.vannamei)
The ability of L.vannamei to tolerate a wide range of salinities (0.5-40 ppt) has made it
a popular species for low salinity culture (McGraw et al., 2002; Samocha et al., 1998;
2002). The high tolerance of L.vannamei to low salinity and the year-round availability
of healthy postlarvae make this species an excellent candidate for inland farming.
Therefore, recently, farmers have been focusing effort on culturing L.vannamei in low
salinity environments.
In lower salinity culture, there is an osmotic pressure between the shrimp body and the
surrounding water, resulting in automatic water uptake mainly through gills and
intestine. With lower salinity the shrimp face more difficulties to uptake minerals from
the water. As nutrient intake directly and indirectly influences shrimp’s tolerance of
stress, the supplementation of selected minerals and lipids above the levels typically
used in marine shrimp feeds, beside supplementation in water directly.
There is evidence from short-term exposures in culture tanks that both potassium and
magnesium additions to well water will enhance survival and growth of postlarvae
(Davis et al. 2005; Roy et al. 2007a). Roy et al. (2007a) reported an increase in shrimp
growth when potassium levels were raised in low salinity waters. To date, several
authors have established that when raising shrimp and other marine species in low
salinity waters it is important to maintain sodium to potassium ratios (Na : K) at levels
similar to seawater diluted to the same salinity (Fielder et al. 2001; Davis et al. 2004;
Zhu et al. 2004; Roy et al. 2007a).
2.4 White shrimp (L. vannamei) production in the world:
Litopenaeus vannamei was introduced into Asia experimentally from 1978-1979, but
beginning in 1996, L. vannamei was introduced into Asia on a commercial scale. This
started in Mainland China and Taiwan Province of China and subsequently spread to
the Philippines, Indonesia, Viet Nam, Thailand, Malaysia and India (RAP, 2004).
In 2008, 67% of the world production of cultured penaeid shrimp (3,399,105 tones)
consisted of L. vannamei (2,259,183 tones). Such dominance was attributed to an 18-
fold increase of production in Asia, from 93,648 MT in 2001 to 1,823,531 MT in
2008, which accounts for 82% of the total world production of L. vannamei. China
leads the world cultured L. vannamei production from 33% in 2001 to 47% in 2008
(1,062,765 MT), among which 51% (542,632 MT) were produced in inland freshwater
pond (Liao and Chin, 2011). Thailand produced 299,000 tones, Vietnam 100,000 MT,
Indonesia 103,874 MT of L.vanamei in 2005 (Kongkeo, 2007).
9
2.5 White shrimp (L. vannamei) production in Vietnam:
Table 3: Production of white shrimp in North, Central and South of Viet Nam in 2009
Area Yield (MT) Percentage
North
6,058 7.2%
Central
63,554 75.4%
South
14,708 17.4%
Total 84,320
(MARD - Ministry of Agriculture and Rural Development)
In Viet Nam, white shrimp cultured from 2000 but low production, reached 84,320
MT (MARD, 2009). However, in recent year, cultivation of white shrimp L. vannamei
culture has been growing rapidly and become an important economic activity. In 2012,
total exports of white shrimp were valued at 676.6 million USD (VASEP, 2013). In
Mekong Delta, white shrimp reached 77,830 MT with 15,727 ha (VASEP, 2013).
10
Chapter 3
MATERIALS AND METHODS
3.1 Time and location
The research was carried out in the Department of Applied Hydrobiology, College
Aquaculture and Fisheries from July 2013 to November 2013. Water sample was
analyzed at the Laboratory for Water Quality Study, College Aquaculture and
Fisheries, Can Tho University.
3.2 Materials
3.2.1. Shrimp culture
Postlarval L.vannamei were obtained from a hatchery in Can Tho, and transport to the
laboratory of the Department of Applied Hydrobiology, College Aquaculture and
Fisheries, Can Tho University. Shrimp were acclimated down to low salinity water (2
‰) over a week at 27
o
C. During acclimation period, shrimp were fed to satiation
twice daily with commercial feed diet 40% protein. During the first three days,
postlarval were offered a combination of Artemia.
3.2.2. Equipment and chemicals
Chemicals: Na
2
S
2
O
3
, Na
2
[Fe(CN)
5
NO].2H
2
O, Fe(NH
4
)(SO
4
)
2
.6H
2
O, C
2
H
5
OH,
NaOH, C
6
H
5
OH, EDTA, NaOCl, Patton-Reeder indicator, SnCl
2
, H
2
SO
4
, Bradford
solution, BSA are purchased from Merck (Germany) and Sigma (St Louis, MO,
USA). The other chemicals and reagents used are of analytical grade.
Equipment: aerators, 100L-tanks, bucket, hand net, substrates, pumping
machine; thermometer, microscope ZX21, refactormeter, multiparameter YSI
556, spectrophotometer UV-Vis Thermo Helios (USA), quartz and glass 1 cm
cuvettes, digital camera microscope, and others.
3.3 Research design and experimental approaches
3.3.1 Experiment 1: Effects of Mg-P-K supplemented in water on growth and survival
rate of white shrimp (L. vannamei)
This experiment includes four treatments with four different levels of Mg-P-K added.
- Treatment 1: without Mg-P-K supplemented (control)
- Treatment 2: Mg-P-K at 10-5-5 (mg/L)
- Treatment 3: Mg-P-K at 20-10-10 (mg/L)
- Treatment 4: Mg-P-K at 40-20-20 (mg/L)
Fifty shrimp (PL
15
, mean initial weight, 0.005 g) were stocked in water with the
capacity of 250 liters. Each treatment was done in triplicate and equipped with an
11
aeration system. Magnesium, phosphorus and potassium were also determined before
shrimp were stocked. Shrimp were fed their respective diets at 7:00, 14:00, and
21:00h. Amount of feed based on shrimp feeding requirement through observation of
feeding activity of shrimp. Salinity water was 2‰. At the end of the 45-day, shrimp
were harvested and survival and growth were assessed.
Preparation of test solution
Mg
2+
test solutions were prepared by dissolving 8.4 g MgCl
2
.6H
2
O in 20 mL of
distilled water to prepare 1,000 mg/L Mg
2+
stock solution. Similarly, P and K
concentration in the tanks were prepared by dissolving 3.87 g NaH
2
PO
4
and 1.91 g
KCl respectively to make 1,000 mg/L for each stock solution.
Then, these stock solutions were diluted with seawater to make various concentrations
corresponding to each treatments using the equation CV=C’V’ at salinity of 2‰.
Water quality parameters were tested:
Temperature, pH, salinity, TAN, NO
2
-
, PO
4
3-
, Ca
2+
, Mg
2+
, K
+
concentrations base on
the methods as described in Table 4.
Table 4: Methods for water quality sampling and analysis
Parameter Sampling frequency Method
Temperature Everyday pH meter YSI 556
pH Everyday pH meter YSI 556
Salinity Weekly Refactormeter
TAN Weekly
Phenate method (APHA
et al., 1999)
NO2- Weekly
Diazonium method
(APHA et al., 1999)
Ca
2+
+ Mg
2+
Weekly
EDTA titrimetric method
(APHA et al., 1999)
Phosphorus Weekly
Stannous Chloride
(APHA et al., 1999)
K+ Weekly AAS (APHA et al., 1999)
Growth performance
indices
End of the experiment
Survival rate (%) End of the experiment
12
Shrimp performance indices are measured:
- Weight gain, WG:
WG (g) = W
f
- W
i
- Length gain, LG:
LG (cm) = L
f
- L
i
- Daily weight gain, DWG:
if
if
1
TT
WW
)day(gDWG
Where: W
i
is the mean initial wet body weight in g at the day T
i
; W
f
is the mean final
wet body weight in g at the day T
f
.
- Daily length gain. DLG:
if
if
1
TT
LL
)day(gDLG
Where: L
i
is the mean initial length in cm at the day T
i
; L
f
is the mean final length in
cm at the day T
f
.
- Specific growth rate, SGR:
100
TT
LnWLnW
)day (%SGR
if
if
1
Where: SGR (% day
-1
) is the specific (relative) growth rate as a percentage (assuming
exponential growth); W
i
is the mean initial length/weigh in g at day T
i
; W
f
is the mean
final length/weigh in g at day T
f
; and Ln denotes natural logarithm (base e).
- Survival rate, SR:
100
N
NN
(%)SR
i
fi
Where: N
i
: mean initial total number of shrimp; N
f
: mean of total number of shrimp at
the end of experiments.
3.3.2. Experiment 2: Effects of Mg-P-K supplemented on molting intervals of white
shrimp L. vannamei (4-5 g) that reared in low salinity water
This experiment was conducted with four treatments and each treatment comprised of
14 shrimp.
- Treatment 1: without Mg-P-K supplemented (control)
- Treatment 2: Mg-P-K: 10-5-5 (mg/L)
- Treatment 3: Mg-P-K: 20-10-10 (mg/L)
- Treatment 4: Mg-P-K: 40-20-20 (mg/L)
Five hundred white shrimp L. vannamei were obtained from an intensive shrimp farm
in Bac Lieu province. Upon arrival, shrimp were stocked and acclimated from 15 ‰ to
13
low salinity water (2 ‰) over a week in a composite tank. Shrimp were fed ad libitum
twice daily with a commercial shrimp diet 40% protein (Grobest Co. Ltd, Vietnam).
The weight of the shrimp range 4.47±0.02 g, averaging with no significant size
difference among treatments. Only healthy shrimp were used for the study.
Each treatment comprised of fourteen shrimp. Each shrimp was individually cultured
in a net cage. Fourteen small net cages were allocated in the composite tank with the
capacity of 1 m
3
. Therefore, total was four tanks in this experiment. Experimental cage
design described as Fig. 3.
Fig.3. Net cage used in Experiment 2
Water was renewed weekly. Before shrimp was allocated in experimental tanks, water
samples were collected for water quality test (parameters are showed in Table 4).
Shrimp were fed at 7:00, 14:00 and 21:00 h. Amount of feed based on shrimp feeding
requirement through observation of feeding activity of shrimp. Salinity water was 2‰.
Determination of molting intervals of shrimp:
Molting of shrimp were recorded daily at 7~8:00 AM through the old shell in the net
case. Shrimp molting interval as expressed as days between 1
st
molting and next
molting. Two molting intervals were recorded.
Water quality parameters were tested: temperature, pH, Mg, P, K. Sampling frequency
and methods for examination for these parameters are the same as those of
Experiment 1 (Table 4).
3.4 Data analysis
A multiple-comparison test (Tukey’s) was used to examine if significant differences
among treatments using the SAS computer software (SAS Institute, Cary, NC, USA).
All values in percentage (survival rate) are arcsine-transformed to satisfy the
requirement for the normal distribution. Statistical significance of differences required
that the p values are less than 0.05.
14
Chapter 4
RESULTS AND DISCUSSIONS
4.1 Experiment 1: Effects of Mg-P-K supplemented in water on growth and
survival rate of white shrimp (L. vannamei)
4.1.1 Water quality
4.1.1.1 Temperature (
o
C) and pH
Temperature ranged from 25.2-28.8
o
C and no significant difference was found among
treatments. pH ranged from 7.5-8.6 (Table 5). Wyban et al. (1995) suggest that
temperature optimum is about from 25 to above 30
o
C. Moreover, Wang et al. (2004)
recommended the favorable pH range of 7.6-8.6 for L.vannamei. Hence, temperature
and pH in treatments were suitable for shrimp growth.
Table 5: Temperature and pH in Experiment 1
Temp. (
o
C) pH
Treatment
Mor. Aft. Mor. Aft.
Control
27.4±0.8
(25.5 - 28.8)
27.4±0.7
(25.7 - 28.6)
8.3±0.16
(7.6 - 8.5)
8.3±0.17
(7.8 - 8.5)
10-5-5
26.9±0.7
(25.2 - 28)
27.5±0.7
(25.7 - 28.8)
8.2±0.17
(7.7 - 8.4)
8.3±0.16
(7.8-8.5)
20-10-10
27.1±0.7
(25.3 - 28.2)
27.8±0.6
(25.7 - 28.5)
8.2±0.12
(7.7 - 8.3)
8.3±0.16
(7.8 - 8.5)
40-20-20
27.2±0.6
(25.7 - 28.6)
27.6±0.7
(25.7 - 28.7)
8.2±0.18
(7.5 - 8.4)
8.3±0.18
(7.7 - 8.6)
Values represent the Mean ± Standard deviation (Min-Max) during experiment
4.1.1.2 Total ammonia nitrogen (TAN), Nitrite (N-NO
2
-
), and Phosphate (P-PO
4
3-
)
TAN concentration fluctuated largely over the study period. TAN concentrations
ranged from 0.06 to 0.76 mg L
-1
. In the treatment 40-20-20, TAN concentration
reached in the 21
st
day then gradually declined at the end of the experiment. N-NO
2
-
ranged from 0.001 to 5.87 mg L
-1
. The highest average N-NO
2
-
concentration was
found in treatment 40-20-20 with a value of 1.49±2.17 mg L
-1
while treatment 10-5-5
and 20-10-10 were 1.12±1.16 and 1.12±1.15 mg L
-1
. A suitable range of nitrite for
marine shrimp culture is below 1.0 mgL
-1
(Boyd, 1998). Thus, NO
2
-
concentrations in
the present experiment did not cause any shrimp mortality. TAN and N-NO
2
-
concentrations are shown in Table 6.