A review of lean six sigma and malcolm baldrige national quality award and a proposal for the future
Bạn đang xem bản rút gọn của tài liệu. Xem và tải ngay bản đầy đủ của tài liệu tại đây (719.3 KB, 83 trang )
A REVIEW OF LEAN SIX SIGMA AND MALCOLM BALDRIGE
NATIONAL QUALITY AWARD AND A PROPOSAL FOR THE
FUTURE
PNG CHANG LIANG
NATIONAL UNIVERSITY OF SINGAPORE
2014
A REVIEW OF LEAN SIX SIGMA AND MALCOLM BALDRIGE
NATIONAL QUALITY AWARD AND A PROPOSAL FOR THE
FUTURE
PNG CHANG LIANG
(B.Eng.(Hons.), NUS)
A THESIS SUBMITTED
FOR THE DEGREE OF MASTER OF ENGINEERING
DEPARTMENT OF INDUSTRIAL AND SYSTEMS
ENGINEERING
NATIONAL UNIVERSITY OF SINGAPORE
2014
!
""!
!
!
DECLARATION
!
I hereby declare that the thesis is my original work and it
has been written by me in its entirety. I have duly
acknowledged all the sources of information which have
been used in the thesis.
This thesis has also not been submitted for any degree in
any university previously.
___________________________
Png Chang Liang
27 March 2015
!
!
!
!
!
!
!
!
"""!
#$%&'()*+,*-*&./!
The completion of this research is heavily indebted to my research supervisor Professor Goh Thong Ngee.
I wish to thank him first for providing the initial frame of mind for this research that allowed me to
embark on this incredible journey of discovery. His expertise and wisdom along the way has guided me
and taught me not just academic research but also the process of critical thinking. This tool is something I
will be able to keep with me after this research has been completed.
I wish to also acknowledge all my peers in the Industrial and Systems Engineering Department who has
helped me along the way to refine my ideas and criticize them when I have been blinded to it.
!
"0!
.#1)*!'2!$'&.*&./!
!"#$%&'()*(+($, /////////////////////////////////////////////////////////////////////////////////////////////////////////////////////////////////////.000!
SUMMARY./////////////////////////////////////////////////////////////////////////////////////////////////////////////////////////////////////////////////////.10!
LIST OF TABLES./////////////////////////////////////////////////////////////////////////////////////////////////////////////////////////////////////////.1000!
LIST OF FIGURES./////////////////////////////////////////////////////////////////////////////////////////////////////////////////////////////////////////.02!
1. INTRODUCTION.////////////////////////////////////////////////////////////////////////////////////////////////////////////////////////////////////////.3!
2. LITERATURE REVIEW./////////////////////////////////////////////////////////////////////////////////////////////////////////////////////////////.4!
2.1 QUALITY PARADIGM!333333333333333333333333333333333333333333333333333333333333333333333333333333333333333333333333333333333333333333333333333333333333333333!4!
2.2 LEAN SIX SIGMA!333333333333333333333333333333333333333333333333333333333333333333333333333333333333333333333333333333333333333333333333333333333333333333333333!5!
2.3 MALCOLM BALDRIGE NATIONAL QUALITY AWARD!33333333333333333333333333333333333333333333333333333333333333333333333333333333333333333!6!
2.4 COMPETITIVENESS!3333333333333333333333333333333333333333333333333333333333333333333333333333333333333333333333333333333333333333333333333333333333333333333!78!
3. METHODOLOGY.//////////////////////////////////////////////////////////////////////////////////////////////////////////////////////////////////////.34!
4. CONTRAST OF LEAN SIX SIGMA AND MALCOLM BALDRIGE.///////////////////////////////////////////////////////.35!
5. FACTORS LEADING TO QUALITY COMPETITIVENESS.///////////////////////////////////////////////////////////////////.36!
5.1 LITERATURE!33333333333333333333333333333333333333333333333333333333333333333333333333333333333333333333333333333333333333333333333333333333333333333333333333333!76!
5.2 FORTUNE 100 COMPANIES’ STATED FACTORS!333333333333333333333333333333333333333333333333333333333333333333333333333333333333333333333333!79!
6. POTENTIAL ENHANCEMENTS FOR LEAN SIX SIGMA AND MALCOLM BALDRIGE TOWARDS
QUALITY COMPETITIVENESS.//////////////////////////////////////////////////////////////////////////////////////////////////////////////////.74!
6.2 POTENTIAL ENHANCEMENTS IN LEAN SIX SIGMA!3333333333333333333333333333333333333333333333333333333333333333333333333333333333333333333!:5!
6.3 POTENTIAL ENHANCEMENTS IN MBNQA!3333333333333333333333333333333333333333333333333333333333333333333333333333333333333333333333333333333!:;!
7. SELECTING 1 AREA OF POTENTIAL ENHANCEMENT TO DISCUSS.//////////////////////////////////////////////.78!
8. DISCUSSION ON INNOVATION.//////////////////////////////////////////////////////////////////////////////////////////////////////////////.76!
8.1 THEORIES OF INNOVATION!333333333333333333333333333333333333333333333333333333333333333333333333333333333333333333333333333333333333333333333333333333!:6!
Schumpeter’s Innovation Theory! !27!
Rosenberg’s Innovation Theory! !28!
Nelson and Winter’s Innovation Theory! !29!
8.2 RELATIONSHIP BETWEEN INNOVATION AND QUALITY COMPETITIVENESS!33333333333333333333333333333333333333333333333333333!48!
8.3 RELATIONSHIP BETWEEN INNOVATION AND LEAN SIX SIGMA!333333333333333333333333333333333333333333333333333333333333333333333333!44!
8.4 RELATIONSHIP BETWEEN INNOVATION AND MBNQA!333333333333333333333333333333333333333333333333333333333333333333333333333333333333!4<!
9. KEY PROPOSITIONS.////////////////////////////////////////////////////////////////////////////////////////////////////////////////////////////////.49!
9.1 PROPOSED CONCEPTUAL INNOVATION PROCESS!333333333333333333333333333333333333333333333333333333333333333333333333333333333333333333333!4=!
10. DISCUSSION OF RESEARCH./////////////////////////////////////////////////////////////////////////////////////////////////////////////////.53!
10.1 IMPLICATIONS OF RESEARCH!3333333333333333333333333333333333333333333333333333333333333333333333333333333333333333333333333333333333333333333333333!<7!
10.2 LIMITATIONS OF RESEARCH!333333333333333333333333333333333333333333333333333333333333333333333333333333333333333333333333333333333333333333333333333!<4!
10.3 FUTURE RESEARCH!3333333333333333333333333333333333333333333333333333333333333333333333333333333333333333333333333333333333333333333333333333333333333333!<<!
11. CONCLUSION.//////////////////////////////////////////////////////////////////////////////////////////////////////////////////////////////////////////.58!
12. BIBLIOGRAPHY.//////////////////////////////////////////////////////////////////////////////////////////////////////////////////////////////////////.58!
APPENDIX A.//////////////////////////////////////////////////////////////////////////////////////////////////////////////////////////////////////////////////.87!
!
0!
APPENDIX B.//////////////////////////////////////////////////////////////////////////////////////////////////////////////////////////////////////////////////.88!
APPENDIX C.//////////////////////////////////////////////////////////////////////////////////////////////////////////////////////////////////////////////////.67!
!
! !
!
0"!
SUMMARY
Background
Quality as a means of competition among organizations and businesses has been a topic of research since
the 1970s (Douglars & Miller, 1974). Competitiveness is broadly defined as a firm’s ability to do better
than comparable firms in sales, market shares, or profitability (Lall, 2001). There have been various
perspectives on how quality helps an organization increase its competitive advantage. There has been
numerous frameworks which seek to help firms enhance their level of quality so as to help them be more
competitive in the marketplace. Two particular frameworks have enjoyed much success over the last two
decades. They are Lean Six Sigma and the Malcolm Baldrige National Quality Award (MBNQA)
(Anthony & Preece, 2002). However, the distinctions of Quality and competitiveness today has evolved
since the 1980s when these frameworks became popular (Yong & Wilkinson, 2002). It is my research
interest to find out what potential enhancements, if any, might be required in Lean Six Sigma and
MBNQA to make them more effective in helping companies stay competitive in today’s context. I hope
to provide conceptual considerations supporting these potential enhancements and provide a background
for future research in this area.
Methodology
There are three parts to this research. In the first part, I provided a contrast of Lean Six Sigma and
Malcolm Baldrige National Quality Award to further our intrinsic understanding of these two frameworks.
In the second part of the research, I sought out to identify gaps, if any, within the existing Lean Six Sigma
and MBNQA framework in helping an organization increase its quality competitiveness. This is done so
through two methods – a review of existing literature and an analysis of factors identified by Fortune 100
companies. In the third part, I selected one area of potential enhancement and discuss in depth its
relationship with quality competitiveness, Lean Six Sigma, MBNQA and how it can potentially be
integrated into these two existing frameworks.
!
0""!
Results of Research
This research identified Innovation, Technology, Risk Controls and Agility as four contributing factors of
Quality Competitiveness that could be integrated into Lean Six Sigma and MBNQA to enhance their
effectiveness in driving Quality Competitiveness. An in-depth discussion on how Innovation can be
integrated into Lean Six Sigma and MBNQA is presented in this research.
Value of Research
No other researchers have conducted a systematic analysis like this to uncover additional elements that
could be integrated within the Lean Six Sigma and MBNQA framework to drive Quality Competitiveness.
Through this research, Consumer Focus is identified as the most important factor driving business
competitiveness in the near future, according to reports from Fortune 100 companies. A conceptual model
of the basic innovation process consisting of four stepsis proposed based on my understanding and
recognition of patterns within the innovation literature. It is a model not articulated or presented by past
researchers.
Conclusion
This work raised more questions on what areas of potential enhancements could be supplemented to Lean
Six Sigma and MBNQA and offered directions for future research in these fields.
! !
!
0"""!
LIST OF TABLES
Table
Title
Page
Table 2.2.1
Common Lean Tools and Their Functions
7
Table 2.2.2
Integration of Lean Tools in the DMAIC
Framework
8
Table 4.1
Comparing Lean Six Sigma and Malcolm
Baldrige National Quality Award on a Conceptual
Basis
17
Table 4.2
Comparing Lean Six Sigma and Malcolm
Baldrige National Quality Award on an Execution
Basis
18
Table 4.3
Comparing Lean Six Sigma and Malcolm
Baldrige National Quality Award on an Impact
Basis
19
Table 5.1.1
Quality Criteria Affecting Firm’s Competitive
Advantage
20
Table 5.2.1
List of Twenty Three Factors Affecting
Organizational Competitiveness From Analysis of
Annual Reports
22
Table 5.2.2
Empirical Evidence Demonstrating That Factor
Leads to Quality Enhancement
24
Table 6.1
Supporting Evidence that Lean Six Sigma and
MBNQA Affects Factors of Quality
Competitiveness
27
Table 6.2
Empirical Evidence Showing Lean Six Sigma and
MBNQA Effect on Company-Stated Quality
Competitiveness Factors
28
Table A.1
List of Fortune 100 Companies Analyzed Ranked
According to Revenue
67
Table A.2
Terminologies of Competitive Factors Used by
Each Company in Their Annual Report
71
Table A.3
Definition of Each Competitive Factor
77
!
! !
!
">!
LIST OF FIGURES
Figure
Title
Page
Figure 2.3.1
Malcolm Baldrige National Quality Award Causal
Model
10
Figure 2.3.2
Number of Baldrige Applicants from 1988 to 2013
11
Figure 2.4.1
A Conceptual Model of Firm Competitiveness
13
Figure 5.2.1
Cumulative Frequency of Each Competitive Factor
Presented in Annual Reports of Fortune 100
Companies
23
Figure 9.1
An Illustration of the Triz Innovation Process
42
Figure 9.1.1
Conceptual Model of Innovation Process
47
!
!
!
7!
1. INTRODUCTION
Quality as a means of competition among organizations and businesses has been a topic of research since
the 1970s (Douglars & Miller, 1974; Johnson & Myatt, 2003; Ma & Burgess 1993; Grossman, 1989;
Andrea et al., 2009). There has been numerous definitions on Quality from various pioneering Quality
gurus and researchers (Donabedian, 1985). It has been defined as value (Abbott, 1955; Feigenbaum,
1951), conformance to specifications (Gilmore, 1974; Levitt, 1972), conformance to requirements
(Crosby, 1979), fitness for use (Juran, 1951), loss avoidance (Ross, 1989) and meeting and/or exceeding
customers’ expectations (Gronroos, 1983; Parasuraman et al., 1985).
Competitiveness, or sometimes closely associated with the term “competitive advantage”, is broadly
defined as a firm’s ability to do better than comparable firms in sales, market shares, or profitability (Lall,
2001). Cook & Bredahl (1991) argue that competitiveness can be viewed from a choice of geographic
area, product or time. Beck (1990) states that competitiveness can be interpreted as the ability of firms to
cope with structural change. For the purpose of this research, competitiveness is understood simply as a
firm’s ability to do better than similar firms in their respective area of competition that might be unique to
that industry.
There have been various perspectives on how quality helps an organization increase its competitive
advantage. Some argue that emphasis on quality enhances the direct profit returns of a company by
driving increased sales on a better product than one’s competitors (Bharadwaj & Menon, 1993; Buzzell &
Gale, 1987; Hendricks & Singhal, 1996; Kuzma & Shanklin, 1992; Powell, 1995). Some argue that the
emphasis on product quality reduces the risk of systematic variance and unexplained variance in returns
(Lubatkin & Rogers, 1989). In Kroll & Heiens (1999), that may be because superior quality tends to
increase customer loyalty and decrease a firm’s vulnerability to price wars. Having loyal customers also
helps a firm reduce its cost of acquiring new customers while maintaining consistent repeat sales
(Reichheld & Sasser,1990; Rust et al.,1995). Whether directly or indirectly, there is little doubt that
improving a firm’s product or service quality has a positive impact on their competitiveness.
!
:!
There has been numerous frameworks which seek to help firms enhance their level of quality so as to help
them be more competitive in the marketplace. Examples of the more successful frameworks, non-
exhaustively listed, are Lean Production, Six Sigma, Malcolm Baldrige National Quality Award
(MBNQA), Total Quality Management (TQM) and ISO 9001 (Anthony & Preece, 2002). Their ‘success’
is qualified typically by the results of their effective applications and the level of application worldwide.
Among these frameworks, Six Sigma and Malcolm Baldridge National Quality Award have their formal
beginnings in year 1987. Six Sigma was pioneered by Motorola at that time to reduce their defect in
manufacturing (Antony & Banuelas, 2002). MBNQA was introduced in 1987 to help US companies be
more competitive (Bell & Keys, 1998; Decarlo & Sterett, 1990). The success of Six Sigma and MBNQA
towards improving the Quality aspect of a company has been researched by numerous authors (Kong et
al., 2006; Wisner & Eakins, 1994). More recently, Lean and Six Sigma have been more closely associated
because of the complimentary nature of their outcomes (Shah & Linderman, 2008; Arnheiter & Maleyeff,
2005). Lean focuses on reduction of process inefficiencies and waste while Six Sigma focuses on
achieving consistent product or service specifications through the use of statistical methods (Smith, 2003).
Collectively, these two frameworks have been termed Lean Six Sigma and have been the topic of research
for many scholars. The success of Lean Six Sigma has been closely related to how it is linked to business
strategy and customer satisfaction (Coronado & Antony, 2002). The success of MBNQA has been closely
related to strong leadership and use and analysis of business information (Wilson & Collier, 2000).
The distinctions of Quality and competitiveness today has evolved since the 1980s (Yong & Wilkinson,
2002; Shroeder et. al 2005; Langlois & Steinmueller, 1999). There is a possibility that Lean Six Sigma
and MBNQA might not be as effective as it was during the late 1980s and early 1990s due to changing
demands. It is my research interest to find out what potential enhancements, if any, might be required in
Lean Six Sigma and MBNQA to make them more effective in helping companies stay competitive in
today’s context. I hope to provide conceptual considerations supporting these potential enhancements and
provide a background for future research in this area.
!
4!
2. LITERATURE REVIEW
2.1 QUALITY PARADIGM
Quality is a concept that has its meaning evolved over the last four decades (Yong & Wilkinson, 2002;
Shroeder et al., 2005). Initially, it was a framework that focuses on inspecting products in production
systems to ensure uniform quality in products going to customers (Sims & Sims, 1995). Subsequently, the
meaning of quality changed when companies realize that customers only paid attention to product defects
or in statistical terms, the products that are outside specification limits. This led to the concepts of
statistical quality control, pioneered by Shewhart (Bank, 1992; Lewis & Smith, 1994). It was around this
time that Japanese automobile companies are trying to grow during the period of post-war devastation.
They began producing products that have very low defect rate at the same levels of operational cost or
even lower (Maguad, 2006). Soon, producing products at low defect rate became the relative norm, and
the focus of quality shifted to product design and imbuing a quality culture within the company. Quality
management became the key for companies at this time (Smith, 2001; Snee 2004; Hahn et al., 2000). This
spurred the development of frameworks like Total Quality Management, Design for Six Sigma and
Quality Planning where quality became an organization-wide responsibility instead of just the
manufacturing or quality department’s responsibility.
Quality has been a loosely defined concept that different authors have differing agreements on the actual
meaning of it (Pepper & Spedding, 2010). The early thinkers and proponents in the field of quality
include Deming, Juran and Ishikawa (Heckman & Wageman, 1995). There are many more but for the
purpose of this literature review, we will limit our discussion to these three leaders. These key thinkers of
Quality Management and Quality Control and their principles are discussed here to provide a context of
the subject matter. This will help us gain a clearer picture of what it is and what it is not, and provide us a
language of discussing the topic in further depth.
Deming is one the earliest pioneers in the use of statistical methods towards improving a company’s
quality (Lynn & Osborn, 1990). In Deming’s own words, “if you can’t describe what you are doing as a
!
<!
process, you don’t know what you’re doing.” Statistics is Deming’s way of measuring and describing the
process in an organization (Gitlow & Gitlow, 1987). Deming prescribed his 14 principles of management
for improving the effectiveness of an organization and within it includes key ideas like constant
improvement, eliminating slogans, removing barriers that rob the hourly worker of his right to pride of
workmanship, cease dependence on inspection to achieve quality and build quality into the product in the
first place (Deming, 1982).
Juran presents his framework for achieving quality excellence through the cyclical process of Quality
Control, Quality Improvement and Quality Planning (Juran, 1988). He believes that quality is
systematically achieved by first bringing the process under control. This is commonly associated with
eliminating defects and correcting the existing process. The next step involves quality improvement
where fundamental changes to the process are instituted for long term and significant change. Finally,
quality has to be built into the product design process and through all the essential processes within an
organization to ensure that quality is maintained at each step in the product development cycle: market
research, product design, vendor relations, manufacturing, delivery and service. This is the stage of
Quality Planning (Juran, 1992; Juran, 1993; Saraph et al., 1989).
Ishikawa emphasized total quality control (Ishikawa, 1990; Saraph et. al., 1989) He advocated the use of
cause-and-effect diagram, also commonly termed the Ishikawa diagram, to identify quality issues within a
company. He stresses the importance of training employees for the improvement of quality (Hill, 1991).
Applying these key concepts from early thinkers, researchers have developed and continuously improved
upon frameworks that are useful in guiding an organization to improve on their level of quality. Examples
of these key frameworks are Lean, Six Sigma, Total Quality Management, ISO and MBNQA. For the
purpose of our research, a literature review of Lean Six Sigma and MBNQA will be discussed in greater
detail.
!
5!
2.2 LEAN SIX SIGMA
Six Sigma is a framework first applied at Motorola with the goal of reducing defects of its products
(Neuman & Cavanagh, 2000). The inherent meaning of Six Sigma is a variability goal of a production
process (Pyzdek & Keller, 2003). Six Sigma represents that the mean of a production process is six
standard deviations from the upper and lower specification limits of a measurement of a product
component. This means that the likelihood of producing an item that is outside the specification limits is
3.4 per million opportunities.
It has achieved widespread success at Motorola and has since been applied by a number of companies
who have claimed outstanding returns, such as General Electric, Caterpillar and Bank of America (Snee
& Hoerl, 2003; Byrne et al., 2007; Kwak & Anbari, 2006).
The practice of Six Sigma is simply formulated in the DMAIC framework, which breaks down to mean
Define – Measure – Analyze – Improve – Control. It is a five-step process to be applied to projects with a
clear measurable goal as the objective of the process. The Define phase identifies key process
characteristics. The Measure phase establishes the existing performance level of that process. The
Analyze phase breaks down key causes of variability within that process, and the Improve phase provides
solutions to enhance the performance of the process. Finally, the Control phase is where the process is
maintained at a new level of standard. Within each step of the process, there are critical tools that can be
used to guide the practitioner (Lynch et al., 2003; Tang et al., 2007; De Mast & Lokkerbol, 2012).
The practice of Six Sigma requires the knowledge of basic and advanced statistical tools, and formal
trainings are often instituted within an organization that practices Six Sigma (Ingle & Roe, 2001). The
practitioners of Six Sigma are categorized by belt levels (Green, Black, Master Black) according to their
level of expertise, experience and responsibility that they undertake for the organization’s Six Sigma
improvement projects (McCarty et al., 2004; Taylor, 2008).
!
;!
Since its first application by Motorola in 1987, Six Sigma has evolved from a purely defect reduction
methodology to include complementary frameworks that are effective in dealing with other aspects of the
quality process. Two of these frameworks are Lean Production and Design for Six Sigma (Montgomery,
2008; Montgomery, 2007). For the purpose of this research, I will limit my scope to Lean and provide a
review of how the integration of Lean and Six Sigma occurs to become what is now known as Lean Six
Sigma.
Lean production is a method of organizational change and improvement that focuses on cost reduction
and efficiency (Holweg, 2007). While Six Sigma tackles process specific variation, Lean is concerned
with streamlining movement of goods or information between processes and reducing any wasted time,
money or resources deemed non-value adding (Dahlgaard& Dahlgaard-Park, 2006). The performance
measures within a Lean framework typically includes throughput, cycle time and waste (Lewis, 2000). It
could be argued that the principles behind Lean Production originated from Toyota’s Production System,
where items are moved from point to point and utilized immediately with no delay (Liker & Morgan,
2006; Christopher, 2000; Hines & Rich, 2004) The end result is a smoothly run chain of processes that
maximises output.
The implementation of Lean includes tools like value-stream map, bottleneck analysis and Root Cause
Analysis. A brief outline of some of the more popular tools and their use is provided in Table 2.2.1.
Table 2.2.1 Common Lean Tools and Their Functions
Lean Tool
Function
5S
Organize the work area and eliminate time and resources wasted from
a poorly organized work area
Bottleneck Analysis
Improves the throughput by improving the slowest or weakest process
in the production process
Continuous Flow
Eliminates waste by getting rid of unnecessary buffers in-between
production processes
!
6!
Kanban
Eliminates waste from overproduction by using tools to indicate the
need for goods downstream
Value Stream
Mapping
Reveals processes within a business unit that are non-value-adding.
Root Cause Analysis
Finding the root cause of the problem to eliminate the problem
completely instead of its symptoms.
Some authors have taken the initiative to integrate Lean and Six Sigma and provided a cohesive
framework where Lean tools can be applied within the DMAIC framework (Snee, 2005). An example of
such application is provided in Table 2.2.2.
Table 2.2.2 Integration of Lean Tools in the DMAIC Framework
Define
Measure
Analyze
Improve
Control
Lean Tools
Value
Mapping
Project
Charter
Process
Mapping
Cause and
Effect Matrix
FMEA
Bottleneck
Analysis
Production
Smoothing
Kaizen
Events
Standard
Work
5S
Poka-Yoke
Source: Snee (2005)
2.3 MALCOLM BALDRIGE NATIONAL QUALITY AWARD
In 1987, the US government launched the Malcolm Baldrige National Quality Award (MBNQA) to
recognize firms achieving excellence in quality products and processes. MBNQA is a framework
structured to help firms understand their exisiting levels of quality performance thorugh a series of
questions that firms will reflect upon and give a score on for critical areas within a firm (Wilson & Collier,
2000; Curkovic et al., 2000; Winn & Cameron, 1998). Since then, most firms in USA and public
organizationas have implemented various quality programmes, including 44 states in USA (Lee et al.,
2007).
Since its introduction in 1987, the MBNQA framework has evolved to reflect changes in concepts of
Quality and new competitive strategies required to adapt to the changing global environment. Annual
!
=!
reviews were conducted for the improvement of the framework to ensure that they remain up to date (Lee
et al., 2006)
The first version in 1988 consisted of 62 examination items distributed over 42 subcategories. It began
mostly presciptive in nature, suggesting companies the right practices to follow (Lee et al., 2007). It
consisted of elements such as leadership, planning, human resource and management practices (Brown,
1997) The focus then was on measuring and controlling process quality via the collection and analysis of
data. It was consistent with the US’s ‘singular need to improve the quality of products and services’
(Hertz, 1997) to compete with foreign manufacturing firms.
The 1992 revision introduced new categories that served to direct a company towards the most valued
category and outcome “Customer Focus and Satisfaction”. There were altogether 7 key categories. There
were categories like Leadership; Information and Analysis; Strategic Quality Planning; Human Resource
Development and Management; Management of Process Quality and Quality and Operational Results.
The 1997 revision was argued to be the most extensive to date (Brown, 1997). There was a key change
from “Customer Focus and Satisfaction” as the most valued outcome to other important accomplishments
like financial results, productivity, safety and employee morale (Lee et al., 2007). It was grouped into two
main sections: Leadership (leadership, strategic planning and customer and market focus) and Results
(human resource focus, process management and business results). The number of subcategories reduced
from the original 42 to 20 in 1997.
There was another minor revision conducted in 2003. This revision presented minor change in headings
and no significant fundamental change in the context of its application.
The MBNQA framework today has extended its application to beyond businesses and has specific guides
for Education and Health Care organizations (Badri et al., 2006; Goldstein & Schweikhart, 2002). The
fundamentals remain the same, with seven key categories guiding the success of an organization. These
seven categories are Leadership, Strategic Planning, Customer and Market Focus, Measurement, Analysis
!
9!
and Knowledge Management; Human Resource Focus; Process Management; and Business Results. They
are cohesively integrated in a causal model as shown in Figure 2.3.1.
Source: Malcolm Baldrige National Quality Award Criteria 2013, page 1
Figure 2.3.1 Malcolm Baldrige National Quality Award Causal Model
In 2013, however, there were no applicants for the categories of Manufacturing, Service and Small
Businesses for the first time in the history of the award. The number of applicants have also steadily
declined over the last 25 years as shown in Figure 2.3.2. This begs us to question the relevancy of the
framework today as it was two decades ago. Is the framework out-dated that no companies want to
implement it for their own organizational competitiveness? What enhancements, if any, could help
MBNQA restore its effectiveness in helping firms be more competitive? That is a question I will explore
in this research.
!
78!
Source:
Figure 2.3.2 Number of Baldrige Applicants from 1988 to 2013
2.4 COMPETITIVENESS
The understanding of competitiveness requires understanding of the definition of competitiveness, the
types of competitiveness, the models of competitiveness and the factors affecting competitiveness.
Competitiveness is a multi-dimensional concept that refers to the ability to create sustainable competitive
advatage that can be used at the national, industry and firm level (Vilanova et al., 2009). As Vilanova et al.
(2009) describes, competitiveness can be viewed at from three levels: national, industry and firm. For the
purpose of my research, I will be focusing on firm competitiveness or firm competitive advantage.
Firm Competitiveness is defined as the ability to produce goods and services creating value or to act
against the rivalry originated in the relationship with other firms (Porter, 1996). The relative position
against rival agents is a key determinant of what makes a successful or unsuccessful organization (Porter
& Kramer, 2006). The indicators of competitiveness varies among authors, and they commonly include
measures such as productivity (Noble, 1997; Ross, 2002; Sharma & Fisher, 1997), customer satisfaction
8!
5!
78!
75!
:8!
:5!
48!
45!
<8!
<5!
58!
79==!
79=9!
7998!
7997!
799:!
7994!
799<!
7995!
799;!
7996!
799=!
7999!
:888!
:887!
:88:!
:884!
:88<!
:885!
:88;!
:886!
:88=!
:889!
:878!
:877!
:87:!
:874!
$:;<=>.?@.ABCD>EF=.!GGCEHBIJK.L3MMNO7P34Q.
-?@AB?CDAE"@F! /GE0"CG! /H?II!1AJ"@GJJ!
!
77!
(Sharma & Fisher, 1997; Tracey et al., 1999), market share (Anderson & Sohal, 1999; Li, 2000; Sharma
& Fisher, 1997).
Models on competitiveness among researchers have helped us to breakdown and understand this elusive
concept. The following three models are starkly different and each provide a unique perspective on
competitiveness. They are presented here in this review.
An industrial competitiveness model was proposed by Oral (1986) that suggests competitive advantage of
a company is driven by its industrial mastery of its respective craft, cost superiority against its rivals and
the firm’s political and economic environment. Industrial mastery is in turn driven by operational mastery
and strategic proficiency. This model provides a conceptual explanation of how Six Sigma and Lean can
potentially affect competitiveness – by improving a firm’s operational mastery and thus industrial
mastery. A figure of Oral (1986)’s model is shown in Figure 2.4.1.
Source: Oral (1986)
Figure 2.4.1 A Conceptual Model of Firm Competitiveness
!
7:!
Porter (1979) presented a 5-factor model on understanding the competitiveness landscape of a firm. In
Porter’s model, threat of new entrants, bargaining power of suppliers, threat of substitutes, bargaining
power of buyers and intensity of competitive rivalry dictates a firm’s competitiveness environment. And
the firm’s ability to mitigate and control these five factors are key to what will make them competitive.
The third model proposes that a firm’s competitiveness can be understood from a Asset-Process-
Performance perspective. A firm’s competitiveness involves a combination of Assets (a firm’s resources)
and Processes (operational processes), where processes transform assets to achieve economic gains
(Performance) from customers (Momaya, 2000). For a detailed review of the theory and models of firm
competitiveness, refer to Ambastha & Momaya (2004).
Some authors propose that the factors which affect a firm’s competitiveness are Price/Cost, Delivery
Dependability, Product Innovation and Time to Market (Koufteos et al, 1997; Tracey et al, 1999; Li et al.,
2006). Charharbaghi & Feurer (1994) suggests that customer values which leads to competitiveness is
driven by Cost, Speed, Flexibility and Dependability. Sharma & Gadenne (2008) draws a relationship
between quality management factors, customer satisfaction and improved competitive position of a
company. Porter (1979) describes two distinct competitive advantages: low cost and differentiation,
which may include quality, features, delivery, follow-up service, ease of use and other non-cost means of
differentiating a firm from its competitors. Hayes & Wheelwright (1984) suggest that there are five
manufacturing-based competitive advantages: low cost, high quality, dependability, flexibility and
innovativeness.
It seems consistent that many authors have cited quality as a factor leading to a firm’s competitiveness
(Garvin, 1988; Douglas & Judge, 2001; Lakhal, 2009; Reed et al., 2000). From the review of literature,
we can be certain that it is not the only factor which will drive a firm’s competitiveness. However, it is
also a factor that cannot be ignored for its direct impact on competitiveness or indirect impact on
customer satisfaction and cost reduction, which eventually lead to a firm’s competitive advantage.
!
74!
For the purpose of this research, I have focused the discussion to quality-centric competitiveness. This
means competitive advantage of a company that are indirectly or directly caused by the quality attributes
of an organization. Among the researchers on quality competitiveness, Kumar et. al. (1999) provides a
most comprehensive discussion on the quality factors that lead to firm competitiveness. They combined
the key researchers in the field of Quality (Ahire et al., 1994; Andersen et al., 1994; Berry, 1991; Black &
Porter, 1996; Crosby, 1979; Dean & Bowen, 1994; Deming, 1982; Flynn et al., 1994; Juran & Gryna,
1993; MBNQA, 1993; Saraph et al., 1989; Wilkinson, 1993) and summarized nine factors that contribute
to the quality attributes of a firm. These nine factors are - Integration of Quality into Operations Strategy,
Quality Leadership, Customer Satisfaction, Employee Empowerment, Quality Cost System, Problem
Solving, Lean Manufacturing, Continuous Improvement and Quality Measurement. They further
proposed a framework to measure the Quality Competitiveness Index of a firm, a numer ranging from 0 -
1 which provides information on how effectively the quality policies of a company have contributed to
the competitiveness of a firm.
In my discussion in the further section, I will be using Kumar (1999)’s framework as a foundation for
analyzing the potential enhancements that could be supplemented to the Lean Six Sigma and MBNQA
frameworks.
3. METHODOLOGY
There are three parts to this research. In the first part, I provided a contrast of Lean Six Sigma and
Malcolm Baldrige National Quality Award to further our intrinsic understanding of these two frameworks.
In this research, I have used the method presented by Watson-Hemphill & Bradley (2012) and Tummala
& Tang (1996) as the basis of critiquing and analysing quality frameworks. The understanding gained
from this contrast will be used for the second part of the research.
In the second part of the research, I sought out to identify gaps, if any, within the existing Lean Six Sigma
and MBNQA framework in helping an organization increase its quality competitiveness. To identify gaps,
!
7<!
I first established the factors that are essential in helping an organization increase its quality
competitiveness. This is done so through two methods – a review of existing literature and an analysis of
factors identified by Fortune 100 companies. The method of selection and analysis of factors proposed by
Fortune 100 companies will be presented in the next section.
These factors are then qualitatively compared to the factors that Lean Six Sigma and MBNQA inherently
affects. Factors which are deemed to drive an organization to be competitive in the quality aspect, and
which are not inherently affected by Lean Six Sigma or MBNQA, will be identified as gaps and areas of
potential enhancements.
In the third step, I selected one area of potential enhancement and discuss in depth its relationship with
quality competitiveness, Lean Six Sigma, MBNQA and how it can potentially be integrated into these
two existing frameworks. This will provide meaningful conceptual considerations for companies who are
considering to enhance their implementation of Lean Six Sigma and MBNQA. For future researchers, it
provides the foundation to undertake empirical analyses on the propositions stated. References from
existing literature and case examples are used to support my argument in this third step of my research.
Finally, discussion on the implications and limitations of my research will be presented, followed by
directions for future research.
4. CONTRAST OF LEAN SIX SIGMA AND MALCOLM BALDRIGE
When comparing these two frameworks, it is essential to first provide the basis of their comparison.
Methods of critiquing and analyzing quality frameworks have been presented from multiple earlier works
and they are adapted here for my purpose (Watson-Hemphill & Bradley, 2012; Tummala & Tang, 1996).
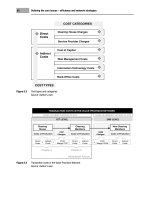
Categorization techniques have been applied to the factors in which these two frameworks will be
contrasted. This is to organize the numerous factors of comparison into meaningful segmented groups for
easier comprehension. Such techniques is not novel and have been applied by previous authors (Roman et
al., 2012). The first category is called the CONCEPTUAL factors, where the theoretical and philosophical
!
75!
essence of these two frameworks are compared and examined. Conceptual analyses of frameworks have
been previously conducted by other authors for other quality tools like Total Quality Management (Ford
& Schellenberg, 1982; Montes et al., 2003). The second category is called the EXECUTION factors,
where the frameworks are compared based on how they are deployed and implemented. Empirical studies
have categorized factors that can be used to analyze the effective implementation of these frameworks
(Denis & Gary, 2000). The third category is called the IMPACT factors, where the results of the
implementation of these two frameworks are contrasted. Similarly, studies conducted on Quality
frameworks have used Impact factors as a means of analysis and they are adapted here for this research
(McAdam, 1999; Shortell et al., 1995) These three categories are presented in Table 4.1, Table 4.2 and
Table 4.3 respectively.
Table 4.1 Comparing Lean Six Sigma and Malcolm Baldrige National Quality Award on a
Conceptual Basis
Areas of
Comparison
Lean Six Sigma
Malcolm Baldrige National
Quality Award
Fundamental
Philosophy
Usage of scientific data to
guide decisions and
improvement in an
organization
Qualitative comparison of an
organization’s performance
against an optimum benchmark
Focus
Action and actual improvement
Assessment and compliance
Scope
Specific processes
Entire business system
Purpose
Improve specific outcomes
within an organization
National recognition and
holistic view of company
performance
Role of Leader
Ensures successful execution
Reflection and inspection
Role of Data
Critical
Secondary
Motivation of
Change
Evidential
Experiential