chapter 8 profit maximization and competitive supply
Bạn đang xem bản rút gọn của tài liệu. Xem và tải ngay bản đầy đủ của tài liệu tại đây (336.53 KB, 58 trang )
Chapter 8
Profit Maximization
and Competitive
Supply
Chapter 8 Slide 2
Topics to be Discussed
Perfectly Competitive Markets
Profit Maximization
Marginal Revenue, Marginal Cost, and
Profit Maximization
Choosing Output in the Short-Run
Chapter 8 Slide 3
Topics to be Discussed
The Competitive Firm’s Short-Run
Supply Curve
Short-Run Market Supply
Choosing Output in the Long-Run
The Industry’s Long-Run Supply Curve
Chapter 8 Slide 4
Perfectly Competitive Markets
Characteristics of Perfectly Competitive
Markets
1) Price taking
2) Product homogeneity
3) Free entry and exit
Chapter 8 Slide 5
Perfectly Competitive Markets
Price Taking
The individual firm sells a very small share
of the total market output and, therefore,
cannot influence market price.
The individual consumer buys too small a
share of industry output to have any impact
on market price.
Chapter 8 Slide 6
Perfectly Competitive Markets
Product Homogeneity
The products of all firms are perfect
substitutes.
Examples
Agricultural products, oil, copper, iron,
lumber
Chapter 8 Slide 7
Perfectly Competitive Markets
Free Entry and Exit
Buyers can easily switch from one supplier
to another.
Suppliers can easily enter or exit a market.
Chapter 8 Slide 8
Profit Maximization
Do firms maximize profits?
Possibility of other objectives
Revenue maximization
Dividend maximization
Chapter 8 Slide 9
Profit Maximization
Do firms maximize profits?
Implications of non-profit objective
Over the long-run investors would not
support the company
Without profits, survival unlikely
Long-run profit maximization is valid and does
not exclude the possibility of altruistic
behavior.
Chapter 8 Slide
10
Marginal Revenue, Marginal Cost,
and Profit Maximization
Determining the profit maximizing level
of output
Profit ( ) = Total Revenue - Total Cost
Total Revenue (R) = Pq
Total Cost (C) = Cq
Therefore:
π
)()()( qCqRq −=
π
Chapter 8 Slide
11
Marginal revenue is the additional
revenue from producing one more unit
of output.
Marginal cost is the additional cost from
producing one more unit of output.
Marginal Revenue, Marginal Cost,
and Profit Maximization
Chapter 8 Slide
12
Comparing R(q) and C(q)
Output levels: 0- q
0
:
C(q)> R(q)
Negative profit
FC + VC > R(q)
MR > MC
Indicates higher
profit at higher
output
0
Cost,
Revenue,
Profit
($s per year)
Output (units per year)
R(q)
C(q)
A
B
q
0
q
*
)(q
π
Marginal Revenue, Marginal Cost,
and Profit Maximization
Chapter 8 Slide
13
Comparing R(q) and C(q)
Question: Why is profit
negative when output is
zero?
Marginal Revenue, Marginal Cost,
and Profit Maximization
R(q)
0
Cost,
Revenue,
Profit
$ (per year)
Output (units per year)
C(q)
A
B
q
0
q
*
)(q
π
Chapter 8 Slide
14
Comparing R(q) and C(q)
Output levels: q
0
-
q
*
R(q)> C(q)
MR > MC
Indicates higher
profit at higher
output
Profit is increasing
R(q)
0
Cost,
Revenue,
Profit
$ (per year)
Output (units per year)
C(q)
A
B
q
0
q
*
)(q
π
Marginal Revenue, Marginal Cost,
and Profit Maximization
Chapter 8 Slide
15
Comparing R(q) and C(q)
Output level: q
*
MR = MC
Profit is maximized
R(q)
0
Cost,
Revenue,
Profit
$ (per year)
Output (units per year)
C(q)
A
B
q
0
q
*
)(q
π
Marginal Revenue, Marginal Cost,
and Profit Maximization
Chapter 8 Slide
16
Comparing R(q) and C(q)
Output levels beyond q
*
:
MC > MR
Profit is decreasing
Marginal Revenue, Marginal Cost,
and Profit Maximization
R(q)
0
Cost,
Revenue,
Profit
$ (per year)
Output (units per year)
C(q)
A
B
q
0
q
*
)(q
π
Chapter 8 Slide
17
C - R =
π
Marginal Revenue, Marginal Cost,
and Profit Maximization
q
R
MR
∆
∆
=
q
C
MC
∆
∆
=
Chapter 8 Slide
18
or
q
C
q
R
0
q
: whenmaximized are Profits
=
∆
∆
−
∆
∆
=
∆
∆
π
MC(q)MR(q)
MCMR
=
=− thatso0
Marginal Revenue, Marginal Cost,
and Profit Maximization
Chapter 8 Slide
19
The Competitive Firm
Price taker
Market output (Q) and firm output (q)
Market demand (D) and firm demand (d)
R(q) is a straight line
Marginal Revenue, Marginal Cost,
and Profit Maximization
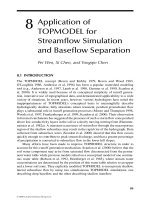
Demand and Marginal Revenue Faced
by a Competitive Firm
Output
(bushels)
Price
$ per
bushel
Price
$ per
bushel
Output
(millions
of bushels)
d$4
100 200 100
Firm Industry
D
$4
Chapter 8 Slide
21
The Competitive Firm
The competitive firm’s demand
Individual producer sells all units for $4
regardless of the producer’s level of
output.
If the producer tries to raise price, sales
are zero.
Marginal Revenue, Marginal Cost,
and Profit Maximization
Chapter 8 Slide
22
The Competitive Firm
AR = MR = P
Profit Maximization
MC(q) = MR = P
Marginal Revenue, Marginal Cost,
and Profit Maximization
Chapter 8 Slide
23
Choosing Output in the Short Run
We will combine production and cost
analysis with demand to determine
output and profitability.
Chapter 8 Slide
24
q
0
Lost profit for
q1 < q
*
Lost profit for
q
2
> q
*
q
1
q
2
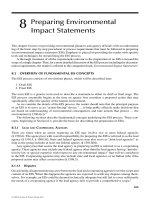
A Competitive Firm
Making a Positive Profit
10
20
30
40
Price
($ per
unit)
0 1 2 3 4 5 6 7 8 9 10 11
50
60
MC
AVC
ATC
AR=MR=P
Output
q
*
At q
*
: MR = MC
and P > ATC
ABCDor
qx ATC) -(P
*
=
π
D
A
B
C
q
1
: MR > MC and
q
2
: MC > MR and
q*: MC = MR but
MC falling
Chapter 8 Slide
25
Would this producer
continue to produce
with a loss?
A Competitive Firm
Incurring Losses
Price
($ per
unit)
Output
AVC
ATC
MC
q
*
P = MR
B
F
C
A
E
D
At q
*
: MR = MC
and P < ATC
Losses = (P- ATC) x
q
*
or ABCD