Bài giảng topic 7(b) oligopoly
Bạn đang xem bản rút gọn của tài liệu. Xem và tải ngay bản đầy đủ của tài liệu tại đây (435.15 KB, 32 trang )
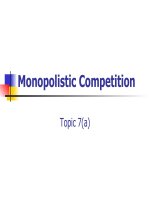
Oligopoly
Topic 7(b)
OLIGOPOLY
Contents
1. Characteristics
2. Game theory
3. Oligopoly Models:
a. Kinked Demand Curve
b. Price leadership
c. Collusion
d. Cost-plus pricing
4. Assessment of Oligopoly
In this topic we will consider the behaviour
of firms when the industry is made up of
only a few firms: oligopoly.
A crucial feature of oligopoly is the
interdependence between firms’ decisions.
Oligopoly
In oligopoly, the industry is made up of only
a few firms.
Each of these firms makes up a significant
part of the total market.
Each can exercise some market power (eg.
their output decisions influence the market
price).
Therefore, each firm’s decisions influence
the decisions made by the other firms.
In other words, firms’ decisions are
interdependent.
Interdependence between
firms
Characteristics of Oligopoly
Small mutually interdependent number of
firms controlling the market
Significant market power
One firm cut the prices => others are affected
Homogenous or differentiated products
High barriers to entry
Examples
Non-price competition…
is common in oligopoly, such as:
advertising, product innovation, improvement of service to
customers.
is preferred to price wars which usually
bring losses to all parties.
2. Game Theory
A model of strategic moves and
countermoves of rivals.
Firms chooses strategies based on their
assumptions about competitors likely
behaviour or response.
Strategies could relate to pricing, advertising, product range,
customer groups etc.
Game theory provides a framework or model
to help analyse this behaviour.
2. Game Theory –
a two-firm Payoff matrix
Two airlines competing for the domestic air
travel market
Vietnam Airlines
Jetstar
Assume two airlines choose their strategy
independently (ie. No collusion)
Payoffs are the outcomes (or profits) for the
2 firms for each combination of strategies.
2. Game Theory –
a two-firm Payoff matrix (1)
Vietnam Airlines’ options
Jet Star’s options
High fare Low fare
High
fare
A
VA’s profit = $15m
JS’s profit = $15m
B
VA’s profit = $20m
JS’s profit = $5m
Low
fare
C
VA’s profit = $5m
JS’s profit = $20m
D
VA’s profit = $8m
JS’s profit = $8m
2. Game Theory –
MAXIMIN strategy
Firms maximise the minimum expected payoff.
For Vietnam Airlines:
if they choose a Low Fare option, they will receive either
$8m or $20m profit, depending on the option chosen by
JS – so the worse VA will make $8m profit.
If they choose a High Fare option, they will receive
either $5m or $15m – the worse is $5m profit
The maximum (the best) of these two minimums is
$8m, so VA will choose the Low Fare option.
2. Game Theory –
MAXIMIN strategy
For Jetstar:
if they choose a Low Fare option, they will receive
either $8m or $20m profit, depending on the option
chosen by VA – so the worse Jetstar will make $8m
profit.
If they choose a High Fare option, they will receive
either $5m or $15m – the worse is $5m profit
The maximum (the best) of these two minimums is
$8m, so JS will also choose the Low Fare option.
Both firms choose the Low Fare option if act
independently.
There is an incentive to collude
2. Game Theory –
a two-firm Payoff matrix (2)
Vietnam Airlines’ options
Jet Star’s options
High fare Low fare
High
fare
A
VA’s profit = $20m
JS’s profit = $10m
B
VA’s profit = $15m
JS’s profit = $2m
Low
fare
C
VA’s profit = $12m
JS’s profit = $8m
D
VA’s profit = $10m
JS’s profit = $5m
2. Game Theory –
MAXIMIN strategy
For VA:
Low Fare: Min. $10m profit ; Max. $15m profit
High Fare: Min. $12m profit; Max. $20m profit
=> VA choose High Fare option
For JS:
Low Fare: Min. $5m profit; Max. $8m profit
High Fare: Min. $2m profit; Max. $10m profit
=> JS choose Low Fare option
Possibly, they cater for different market
segments. There is no incentive to collude
3. Oligopoly Models
Kinked Demand Curve Model
D1: When the firm changes
prices => other firms react
similarly
There is no substitution effect
demand will change but not by
much
demand is price inelastic
D2: When the firm changes
price => other firms don’t
follow.
There is substitution effect
Change in demand more
sensitive to price changes
Relatively elastic curve
Rivals
ignore
Rivals
match
fig
Kinked demand curve for a firm
under oligopoly
$
Q
O
P
1
Q
1
D
B
A
Assumptions:
•
Independent among firms
(ie. no collusion)
•
Rivals will
match price
decreases
and
ignore price
increases
The
MR
curve
$
Q
O
P
1
Q
1
D = AR
a
MR
B
$
Q
O
P
1
Q
1
MR
a
b
D = AR
The
MR
curve
3. Oligopoly Models
Kinked Demand curve
As long as MC
shifts within C1 &
C2, the optimum
output is Qo &
price is Po
=> stable price
Stable price under conditions of a
kinked demand curve
$
Q
O
P
1
Q
1
MC
2
MC
1
MR
a
b
D = AR
Kinked Demand Curve Model
Assumptions:
All firms are independent (ie. no collusion)
Rivals match price decreases and ignore price increases
Implication of Kinked Demand Curve: Stable Price
If a firm raises price, it will lose customers and sales to other firms
If it reduces price, other firms will match => a price war.
Therefore, firms tend to maintain the same price.
Substantial cost changes will have no effect on output and price as long
as MC shifts between C1 & C2. Another reason why price is stable.
Limitations
It does not explain the determination of current price
Sometimes prices rise substantially during inflation period, which is
contrary to the stable price conclusions of Oligopoly
3. Oligopoly Models
b)
Price Leadership Model
Assumes implicit collusion
Follow the leader
dominant firm makes prices changes
most efficient, oldest, most respected, largest
others follow
Usually
prices don’t change very often
price changes are very public
price may be low to act as barrier to entry
fig
$
Q
O
AR = D
market
Price leader aiming to maximise profits
for a given market share
fig
$
Q
O
AR = D
leader
AR = D
market
Assume constant
market share
for leader
Price leader aiming to maximise profits
for a given market share
fig
$
Q
O
MR
leader
AR = D
leader
AR = D
market
Price leader aiming to maximise profits
for a given market share
fig
$
Q
O
MC
MR
leader
AR = D
leader
AR = D
market
Price leader aiming to maximise profits
for a given market share