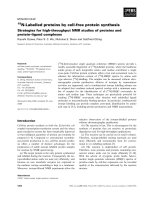
analysis of proteins and protein complexes by chemical cross linking and mass spectrometry
Bạn đang xem bản rút gọn của tài liệu. Xem và tải ngay bản đầy đủ của tài liệu tại đây (35.34 MB, 249 trang )
This thesis has been submitted in fulfilment of the requirements for a postgraduate degree
(e.g. PhD, MPhil, DClinPsychol) at the University of Edinburgh. Please note the following
terms and conditions of use:
•
•
•
•
•
This work is protected by copyright and other intellectual property rights, which are
retained by the thesis author, unless otherwise stated.
A copy can be downloaded for personal non-commercial research or study, without
prior permission or charge.
This thesis cannot be reproduced or quoted extensively from without first obtaining
permission in writing from the author.
The content must not be changed in any way or sold commercially in any format or
medium without the formal permission of the author.
When referring to this work, full bibliographic details including the author, title,
awarding institution and date of the thesis must be given.
3D proteomics: Analysis of proteins and
protein complexes by chemical cross-linking
and mass spectrometry
Zhuo A. Chen
Thesis for the Degree of Doctor of Philosophy
The University of Edinburgh
August 2011
DECLARATION
I hereby declare that the work presented in this thesis was carried out by me under
the supervision of Prof. Juri Rappsilber at the University of Edinburgh between April
2007 and May 2011. No part of this thesis has been previously submitted at this or
any other university for any other degree or professional qualification
Zhuo Chen
August 2011
I
ACKNOWLEDGEMENTS
First and foremost I would like to thank my supervisor Prof. Juri Rappsilber
for his kind guidance, advice and continuous support during my Ph.D. It has
been a great experience to be his student.
I also would like to thank everyone in the Rappsilber lab who has immensely
contributed to my professional and personal time at the University of
Edinburgh.
Thanks to Lutz, Andy, Adam, Heather, Jimi, Karen, Lauri,
Salman and Sally for correcting my writings. And thanks to everybody who
helped me with my Ph.D.
I would like to thank my second supervisor, Professor Paul N Barlow, for his
generous help on the C3 and C3b project.
Thanks to Professor Patrick
Cramer and his group for the collaboration on the Pol II-TFIIF project. I thank
Dr.Kevin Hardwick, Sjaak van der Sar and Dr. Paul McLaughlin for their
support on my work with the affinity purified protein complexes.
Big love to my family, especially my mum, without their support, I would not
have managed my Ph.D.
II
CONTENTS
DECLARATION
I
ACKNOWLEDGEMENTS
II
LIST OF FIGURES
X
LIST OF TABLES
ABBREVIATIONS
XIII
ABSTRACT
XV
Chapter 1 INTRODUCTION
1.1 Integrated structural biology and 3D proteomics
1
1
1.1.1 Integrated structural analysis of large protein complexes and
assemblies
1
1.1.2 Applications of mass spectrometry in protein structural
analysis
3
1.1.3 3D proteomics
4
1.2. Chemical cross-linking
1.2.1 Cross-linking reagents
1.2.1.1 Cross-linking chemistry
8
8
8
1.2.1.2 Cross-linking reagent design
15
1.2.1.3 Functionalized cross-linking reagents
16
1.2.2 Cross-linking reaction
18
1.2.3 In vivo cross-linking
20
1.3 Enrichment of cross-linked peptides
20
1.3.1 Separation and digestion of cross-linked protein samples
20
1.3.2 Enrichment of cross-linked peptides
23
1.4 Analysis of cross-linked peptides by mass spectrometry
24
III
1.4.1 Mass spectrometric analysis of cross-linked samples
24
1.4.2 Fragmentation of cross-linked peptides
27
1.5 Identification of cross-linked peptides
30
1.6 Current application of 3D proteomics
33
1.7 Project aim
36
Chapter 2 METHODS AND MATERIALS
2.1 Cross-linking analysis of synthetic peptides
37
37
2.1.1 Cross-linking of synthetic peptides
37
2.1.2 Strong cation exchange (SCX) fractionation
38
2.1.2.1 SCX-HPLC fractionation
38
2.1.2.2 SCX-StageTip fractionation
39
2.1.3 Analysis via Mass spectrometry
40
2.1.3.1 Sample preparation
40
2.1.3.2 LC-MS/MS analysis
40
2.1.4 Database searching
2.2 Cross-linking analysis of Pol II and Pol II-TFIIF complexes
42
44
2.2.1 The Pol II complex and the Pol II-TFIIF complex
44
2.2.2 Cross-linking titration of Pol II and Pol II-TFIIF complexes
45
2.2.3 Cross-linking of Pol II and Pol II-TFIIF complexes
48
2.2.4 Sample preparation for mass spectrometric analysis
48
2.2.5 Mass spectrometry
49
2.2.6 Database searching
50
2.3 Quantitative 3D proteomic analysis of C3 and C3b samples
51
2.3.1 Protein cross-linking for quantitative analysis
51
2.3.2 Sample preparation for mass spectrometric analysis
52
IV
2.3.3 Mass spectrometric analysis
52
2.3.4 Identification of cross-linked peptides
53
2.3.5 Quantitation of cross-linkages
53
2.3.6 Comparison between cross-linking data and crystal
structures
54
2.4. Structural analysis of affinity purified protein complexes by
3D proteomics
54
2.4.1 Affinity purified tagged endogenous protein complexes
54
2.4.2 ‘On-beads’ cross-linking procedure
55
2.4.3 Sample preparation for mass spectrometric analysis
55
2.4.4 Mass spectrometric analysis
56
2.4.5 Database searching
56
2.4.6 Surveillance of inter-complex cross-links
57
2.5 Supplementary Information and experimental procedures
58
2.5.1 Supplementary Information
58
2.5.1.1 Supplier information
58
2.5.1.2 StageTips
58
2.5.2 Preparation of trypsin digested E.coli extract
58
2.5.2.1 Preparation of E.coli extract
58
2.5.2.2 In gel digestion of E.coli extract
59
2.5.3 Preparation of trypsin digested yeast extract
59
2.5.4 Protocol for silver staining
59
2.5.4.1 Solutions for silver staining
59
2.5.4.2 Silver staining procedure
60
V
Chapter 3 DEVELOPMENT OF A 3D PROTEOMICS
ANALYTICAL WORKFLOW
61
3.1 Summary
61
3.2 Introduction
63
3.3 Analysis of cross-linked peptide library
65
3.3.1 Design of a cross-linked peptide library
65
3.3.2 LC-MS/MS analysis scheme for cross-linked peptides
67
3.3.3 Data base searching for cross-linked peptides
69
3.4 CID fragmentation of cross-linked peptides
70
3.4.1 Manual annotation of cross-linked peptide fragmentation
spectra
70
3.4.2 High resolution fragmentation spectra of cross-linked
peptides
70
3.4.3 The influence of different cross-linkers on the fragmentation
of cross-linked peptides
74
3.4.4 The impact of resolution for MS2 spectra on interpretation
and identification of fragmentation spectra of cross-linked
peptides
3.4.5 Automated interpretation of MS2 spectra of cross-linked peptides
3.5 Validation of cross-linked peptide identification
74
79
79
3.5.1 Confidence criteria of cross-linked peptide identification
79
3.5.2 A large dataset of cross-linked peptides
80
3.6 Charge based enrichment strategy for cross-linked peptides
82
3.6.1 Strong cation exchange chromatography and cross-linked
peptides enrichment
84
VI
3.6.2 Selective fragmentation of highly charged precursor ions in
mass spectrometric analysis increases detection of crosslinked peptides
85
3.7 Cross-linked peptide library and advanced 3D proteomics analytical
workflow
3.8 Other applications of the cross-linked peptide library
89
89
Chapter 4 ARCHITECTURE OF THE RNA POLYMERASE II-TFIIF
COMPLEX REVEALED BY 3D PROTEOMICS
91
4.1 Summary
91
4.2 Introduction
92
4.3 3D proteomics analysis of the Pol II complex
96
4.3.1 Cross-linking/MS analysis of the Pol II complex
96
4.3.2 Cross-linking and protein-protein interactions
98
4.4 Cross-linking/MS analysis of the Pol II-TFIIF complex
4.4.1 Cross-linking/MS data of the Pol II-TFIIF complex
99
99
4.4.2 Yeast TFIIF domain structures
102
4.4.3 Location of TFIIF on Pol II
104
4.4.4 Possible conformation changes of Pol II in the Pol II –TFIIF
complex
4.5 Discussion
4.5.1 Architecture of the Pol II-TFIIF complex and TFIIF functions
109
112
112
4.5.2 Study architectures of large multi-protein complexes using
3D proteomics
115
VII
Chapter 5 QUANTITATIVE 3D PROTEOMICS DETECTED
CONFORMATIONAL DIFFERENCES BETWEEN C3
AND C3B IN SOLUTION AND GAVE INSIGHT INTO
THE
CONFORMATION
OF
SPONTANEOUSLY
HYDROLYZED C3
117
5.1 Summary
117
5.2 Introduction
118
5.3 Quantitative 3D proteomics analysis of C3 and C3b samples
122
5.3.1 Cross-linking of C3 and C3b
122
5.3.2 Identification and quantitation of Cross-linked peptides
124
5.3.3 Quantified cross-linkages suggested differences between C3
and C3b samples
128
5.4 Quantitative cross-link data is in agreement with the crystal
structures of C3 and C3b
129
5.4.1 Cross-linking data and the crystal structures agreed on
residue proximity
129
5.4.2 Cross-linking data confirmed in solution the structural
similarities and differences between C3 and C3b
characterized by crystal structures
131
5.5 Quantitative cross-link data uncovered hydrolyzed C3 in the
presence of C3 and C3b
136
5.6 Domain architecture of C3(H2O)
141
5.7 Flexibility of the TED domain in C3b and C3(H2O)
143
5.8 Cross-link data contradicts a false C3b crystal structure
144
5.9 Discussion
146
VIII
5.9.1 C3b-like functional domain arrangement and the function of
C3(H2O)
5.9.2 Outlook for quantitative 3D proteomics
146
147
Chapter 6 STRUCTURAL ANALYSIS OF TAGGED PROTEIN
COMPLEXES BY 3D PROTEOMICS
148
6.1 Summary
148
6.2 Introduction
149
6.3 Cross-linking analysis of TAP-tagged endogenous protein
complexes
150
6.3.1 ‘On-beads’ cross-linking and digestion procedure
150
6.3.2 SILAC control experiments
153
6.4 Cross-links observed from low microgram amounts of
endogenous protein complexes
155
6.4.1 Composition of purified tagged protein complex samples
155
6.4.2 Identification of cross-linked peptides from affinity purified
complex samples
159
6.5 Organization of the Mad1-Mad2 complex
163
6.6 Cross-link data revealed a conserved loop region in Ndc80.
167
6.7 From AP-MS to AP-3DMS
172
Chapter 7 SUMMARY AND PERSPECTIVE
174
7.1 Summary
174
7.2 Perspective
176
IX
178
APPENDIX
A.1 Observation of C3 contamination in the C3b sample
A.1.1 Detection of C3 contamination
A.1.1.1 Experimental procedure
178
178
178
A.1.1.1.1 Denaturing gel electrophoresis
178
A.1.1.1.2 Mass spectrometric analysis
178
A.1.1.2 Results
A.1.2 Quantitation of C3 contamination
179
180
A1.2.1 1 Experimental procedure
180
A1.2.2 Results
180
A.1.3 Discussion
180
A.2 Supplementary figures
184
A.3 Supplementary Tables
188
A.4 Publications
211
CITED LITERATURE
212
X
LIST OF FIGURES
Figure 1.1
Analytical strategies for 3D proteomics
5
Figure 1.2
Amine-reactive cross-linkers
10
Figure 1.3
Reaction scheme of sulfhydryl-reactive cross-linking with
maleimides
11
Figure 1.4
Reaction schemes of a ‘zero-length’ cross-linker EDC
including the reaction in combination with sulfo-NHS
12
Figure 1.5
Reaction schemes of most commonly used photoreactive
cross-linking reagents
13
Figure 1.6
Chemical structures of four photoreactive amino acid
analogues
14
Figure 1.7
Chemical structures of deuterated amine-reactive crosslinker BS3-d4 in comparison with its unlabelled analogue
BS3-d0
17
Figure 1.8
Nomenclature of common products of chemical crosslinking reactions.
22
Figure 1.9
Fragment ions observed in MS2 spectrum
28
Figure 2.1
Titration of BS3 cross-linking reactions for Pol II complex
and Pol II-TFIIF complex
47
Figure 3.1
Design of the cross-linked peptide library
66
Figure 3.2
LTQ-Orbitrap hybrid mass spectrometer
68
Figure 3.3
Annotation of fragmentation spectra of cross-linked
peptides
71
Figure 3.4
Peptide fragmentation patterns are similar in cross-linked
and linear status
73
Figure 3.5
Impact of cross-linker on fragmentation
75
Figure 3.6
High and low resolution MS2 spectra of cross-linked
peptides
77
Figure 3.7
Validation of cross-linked peptide fragmentation spectra
matches
81
XI
Figure 3.8
Cross-linked peptide enrichment by SCX chromatographic
fractionation
87
Figure 3.9
Precursor charge selection and cross-linked peptide
enrichment
88
Figure 4.1
Important domains of Pol II
95
Figure 4.2
3D proteomics analysis of the Pol II complex
97
Figure 4.3
3D proteomics analysis reveals predominantly direct
pairwise interaction between Pol II subunits.
100
Figure 4.4
Cross-linking reaction of Pol II –TFIIF complex
101
Figure 4.5
Cross-links observed within TFIIF and structures of TFIIF
domains
103
Figure 4.6
Cross-links between Pol II and TFIIF
105
Figure 4.7
Cross-linking footprints of TFIIF subunits on the surface of
Pol II structure
106
Figure 4.8
Alternative position of Tfg2 C-terminal region (linker, WH
domain and C-terminal) on the Pol II surface
108
Figure 4.9
Architecture of Pol II-TFIIF in preinitiation complex
110
Figure 4.10
Cross-links within Pol II observed in Pol II-TFIIF complex
111
Figure 5.1
The experimental scheme of quantitative 3D proteomics
analysis of C3 and C3b conformational changes in solution
123
Figure 5.2
Cross-linking of the C3 and C3b samples
125
Figure 5.3
Quantitation of cross-links
127
Figure 5.4
Cross-links observed in C3 and C3b samples
130
Figure 5.5
Quantitative cross-link data reflects similarities and
differences between C3 and C3b
133
Figure 5.6
Domain architectures of C3 and C3b as derived from
cross-link data
135
Figure 5.7
Quantitative cross-link data suggested that an alternative
conformation existed in the C3 sample
137
Figure 5.8
Domain architecture of C3(H2O)
142
XII
Figure 5.9
Cross-link data contradicts a fraudulent C3b crystal
structure
145
Figure 6.1
Workflow of the ’on-beads’ process for 3D proteomics
analysis
151
Figure 6.2
Scheme of SILAC control experiment for monitoring the
occurrence of inter-complex cross-links
154
Figure 6.3
Validation of cross-linked peptide identification in MS1
spectra
160
Figure 6.4
Spectra of cross-links between Mad1 molecules in the
Mad1-Mad2 complex
165
Figure 6.5
Organization of the S. cerevisiae Mad1-Mad2 complex
166
Figure 6.6
Internal architecture of the S. cerevisiae Ndc80 complex
170
Figure 7.1
Draft of expected versatile applications of 3D proteomics in
the future
177
Figure A1.1
SDS-PAGE gel image of the C3 and C3b
183
Figure A1.2
An example MS1 spectrum of C3a peptide
183
Figure S1
Mass accuracy of Orbitrap mass analyzer at different
resolutions
185
Figure S2
Inconsistency between crystallographic and cross-linking
data on the Pol II complex
186
XIII
LIST OF TABLES
Table 1.1
Commonly used techniques for characterizing structures of
protein complexes and protein assemblies
2
Table 2.1
SCX-StageTip fractionation
39
Table 2.2
Mass spectrometric acquisition methods for cross-linked
synthetic peptide samples
42
Table 2.3
Search parameters for linear peptides samples in Mascot
search
43
Table 2.4
Search parameters for cross-linked peptides samples in
Xmass search
44
Table 2.5
Experimental plan for Pol II complex cross-linking titration
45
Table 2.6
Experimental plan for Pol II-TFIIF complex cross-linking
titration
46
Table 2.7
Acquisition parameters for mass spectrometric analysis of
the cross-linked Pol II and Pol II-TFIIF samples using the
LTQ-Orbitrap mass spectrometer
50
Table 2.8
Search parameters used for database search for crosslinked peptides in Xi
51
Table 3.1
Summary of manually annotated cross-linked peptide
identifications
83
Table 5.1
Interpretation of clustered cross-links
140
Table 6.1
Composition of affinity-purified protein complex samples
157
Table 6.2
Influence of sample amount on cross-linking detection
162
Table A.1.1
Identified C3a peptides from the C3b sample
181
Table A.1.2
Proteins identified from the C3b sample using Mascot
181
Table A1.3
Quantitation of cross-linker modified C3a peptides
182
Table S1
List of 49 synthetic peptides
189
Table S2
List of high confidence cross-links observed from the Pol II
complex sample
191
Table S3
List of high confidence cross-links observed from the Pol
194
XIV
II-TFIIF complex sample
Table S4
Quantified cross-linkages in conformational comparison of
C3 and C3b by quantitative 3D proteomics
204
Table S5
Ten most intense proteins identified from the affinity
purified S. cerevisiae Mad1-Mad2 complex
206
Table S6
Ten most intense protein identified from the affinity purified
S. cerevisiae Ndc80 complex
206
Table S7
List of cross-links observed from the affinity purified S.
cerevisiae endogenous Mad1-Mad2 complex
207
Table S8
List of cross-links observed from the affinity purified S.
cerevisiae endogenous Ndc80 complex
209
XV
ABBREVIATIONS
1D
1 dimension
3D
3 dimension
ABC
ammonium bicarbonate
ACN
acetonitrile
AP-MS
affinity purification-mass spectrometry
BS2G
Bis[sulfosuccinimidyl] glutarate
BS3
Bis[sulfosuccinimidyl] suberate
CID
collision-induced dissociation
DEB
1,3-diformyl-5-ethynylbenzene
DMF
N,N-dimethylformamide
DMSO
dimethyl sulfoxide
DPI
dual polarization interferometry
DSG
disuccinimidyl glutarate
DSS
disuccinimidyl suberate
DTT
dithiothreitol
EDC
1-ethyl-3-[3-dimethylaminopropyl]carbodiimide
hydrochloride
EM
electron microscope
ESI
electrospray ionization
ET
electron transfer
ETD
electron-transfer dissociation
FDR
false discovery rate
FP
fluorescence polarization
FRET
fluorescence resonance energy transfer
FT
Fourier transform
FTICR
Fourier transform ion cyclotron resonance mass
spectrometry
HPLC
high-performance liquid chromatography
IAA
iodoacetamide
LC-MS/MS
liquid chromatography–tandem mass spectrometry
LIT
linear ion trap
LRET
luminescence resonance energy transfer
XVI
LTQ
linear trap quadrupole
MALDI
matrix-assisted laser desorption/ionization
MES
2-(N-morpholino)ethanesulfonic acid
MOPS
3-(N-morpholino)propanesulfonic acid
MS
mass spectrometry
MS/MS
tandem mass spectrometry
MS1
full scan (spectrum)
MS2
fragmentation scan (spectrum)
NHS-ester
N-hydroxysuccinimide ester
NMR
nuclear magnetic resonance
PIC
preinitiation complex
PIR
protein interaction reporter
Pol II
RNA polymerase II
PTM
post translational modification
-Q-
quadrupole
RNA
ribonucleic acid
SBC
N-succinimidyl p-benzoyldihydrocinnamate
SCX
strong cation exchange
SDS-PAGE
sodium dodecyl sulfate polyacrylamide gel
electrophoresis
SILAC
stable isotope labelling with amino acids in cell culture
Stage-Tip
stop-and-go-extraction tips
Sulfo-SMCC
sulfosuccinimidyl-4-(N-maleimidomethyl)cyclohexane1-carboxylate
TEA
thriethanolamine
TFA
trifluoroacetic acid
TFIIB
transcription factor IIB
TFIID
transcription factor IID
TFIIF
transcription factor IIF
-TOF
time-of-flight mass spectrometry
Tris
2-Amino-2-hydroxymethyl-propane-1,3-diol
UV
ultraviolet
XDB
cross-link database
XVII
ABSTRACT
The concept of 3D proteomics is a technique that couples chemical cross-linking with mass
spectrometry and has emerged as a tool to study protein conformations and protein-protein
interactions. In this thesis I present my work on improving the analytical workflow and
developing applications for 3D proteomics in the structural analysis of proteins and protein
complexes through four major tasks.
I. As part of the technical development of an analytical workflow for 3D proteomics,
a cross-linked peptide library was created by cross-linking a mixture of synthetic peptides.
Analysis of this library generated a large dataset of cross-linked peptides. Characterizing the
general features of cross-linked peptides using this dataset allowed me to optimize the
settings for mass spectrometric analysis and to establish a charge based enrichment strategy
for cross-linked peptides. In addition to this, 1185 manually validated high resolution
fragmentation spectra gave an insight into general fragmentation behaviours of cross-linked
peptides and facilitated the development of a cross-linked peptide search algorithm.
II. The advanced 3D proteomics workflow was applied to study the architecture of
the 670 kDa 15-subunit Pol II-TFIIF complex. This work established 3D proteomics as a
structure analysis tool for large multi-protein complexes. The methodology was validated by
comparing 3D proteomics analysis results and the X-ray crystallographic data on the 12subunit Pol II core complex. Cross-links observed from the Pol II–TFIIF complex revealed
interactions between the Pol II and TFIIF at the peptide level, which also reflected the
dynamic nature of Pol II -TFIIF structure and implied possible Pol II conformational changes
induced by TFIIF binding.
III. Conformational changes of flexible protein molecules are often associated with
specific functions of proteins or protein complexes. To quantitatively measure the
differences between protein conformations, I developed a quantitative 3D proteomics
strategy which combines isotope labelling and cross-linking with mass spectrometry and
XVIII
database searching. I applied this approach to detect in solution the conformational
differences between complement component C3 and its active form C3b in solution. The
quantitative cross-link data confirmed the previous observation made by X-ray
crystallography. Moreover, this analysis detected the spontaneous hydrolysis of C3 in both
C3 and C3b samples. The architecture of hydrolyzed C3 -C3(H2O) was proposed based on
the quantified cross-links and crystal structure of C3 and C3b, which revealed that C3(H2O)
adopted the functional domain arrangement of C3b. This work demonstrated that
quantitative 3D proteomics is a valuable tool for conformational analysis of proteins and
protein complexes.
IV. Encouraged by the achievements in the above applications with relatively large
amounts of highly purified material, I explored the application of 3D proteomics on affinity
purified tagged endogenous protein complexes. Using an on-beads process which connected
cross-linking and an affinity purification step directly, provided increased sensitivity through
minimized sample handling. A charge-based enrichment step was carried out to improve the
detection of cross-linked peptides. The occurrence of cross-links between complexes was
monitored by a SILAC based control. Cross-links observed from low micro-gram amounts of
single-step purified endogenous protein complexes provided insights into the structural
organization of the S. cerevisiae Mad1-Mad2 complex and revealed a conserved coiled-coil
interruption in the S. cerevisiae Ndc80 complex.
With this endeavour I have demonstrated that 3D proteomics has become a valuable
tool for studying structure of proteins and protein complexes.
XIX
Chapter 1
INTRODUCTION
1.1 Integrated structural biology and 3D proteomics
1.1.1 Integrated structural analysis of large protein complexes and assemblies
Protein complexes and their network of interactions play essential roles in cellular function
and regulation.
Structural characterization of protein complexes and large protein
assemblies underline the mechanistic understanding of cellular processes.
To properly
characterize the structure of a protein complex or assembly, the following information is
required:
1) Characters of all subunits
2) Stoichiometry of subunits in the protein complex (protein assembly)
3) Assembling of subunits
4) Structural dynamics of the protein complex (protein assembly).
Rarely, single structural biology techniques alone can achieve such comprehensive
characterization, especially for large protein complexes and assemblies. However, these
structural information can be gathered using different techniques. These include high and
low resolution structural biology techniques such as X-ray crystallography, nuclear magnetic
resonance (NMR), electron microscopy, electron tomography, small angle scattering, mass
spectroscopy and advanced light microscopy. In addition a wide range of physical, chemical,
biochemical, molecular biological characterization and computational techniques can be
used (Sali et al., 2003) (Table 1.1). Moreover, computational tools that can integrate all this
CHAPTER 1
1
information for modelling structures of protein complexes and assemblies have become
available in recent years (Sali et al., 2003; Alber et al., 2007).
Table 1.1 - Commonly used techniques for characterizing structures of protein
complexes and protein assemblies.
Structural features
Subunit primary
sequence
Characters
of subunits
PTMs
Commonly used techniques
Edman sequencing, Mass spectrometry
Mass spectrometry
X-ray crystallography, NMR, Electron microscopy,
Subunit shape
Electron tomography, Protein structure prediction, Small
angle scattering, Ion mobility-mass spectrometry.
Subunit structure
Stoichiometry of subunits
X-ray crystallography, NMR, Protein structure prediction
X-ray crystallography, Quantitative proteomics analysis,
Quantitative immuno-blotting.
X-ray crystallography, NMR, Electron microscopy,
Electron tomography, Mass spectrometry, Chemical
Subunit-subunit contact
cross-linking/MS, Affinity purification-mass
spectrometry, FRET, Site-directed mutagenesis, Yeast
two-hybrid system, Computational docking
X-ray crystallography, Electron microscopy, Electron
Assembling
Subunit proximity
of subunits
tomography, Immuno-eletron microscopy, Chemical
cross-linking/MS, Affinity purification-mass
spectrometry, FRET, Yeast two-hybrid system
Assembly structure
Assembly shape
X-ray crystallography
X-ray crystallography, NMR, Electron microscopy,
Electron tomography, Small angle scattering
X-ray crystallography, NMR, Electron microscopy,
Assembly symmetry
Electron tomography, Immuno-eletron microscopy, Small
angle scattering
Compositional
Dynamics of
assemblies
dynamics
Conformational
dynamics
CHAPTER 1
Affinity purification-mass spectrometry, Quantitative
proteomics
X-ray crystallography, NMR, Electron microscopy,
Electron tomography, Small angle scattering, Chemicalcross-linking/MS, Light microscopy techniques
2
1.1.2 Applications of mass spectrometry in protein structural analysis.
Today mass spectrometry plays important roles in structural biology studies.
Mass
spectrometry based proteomics has been very successful in identifying proteins in complexes
and organelle, and hundreds of proteins can now be analyzed in a single experiment
(Aebersold and Mann, 2003).Additionally, mass spectrometry has also been able to reveal
protein post-translational modifications (PTMs) (Mann and Jensen, 2003) which often play
important roles in dynamics of protein structures. Consequentially mass spectrometry has
become a key tool for studying primary protein structures. Its combination with affinity
purification (AP-MS) has significantly advanced our understanding of protein complex
composition (Gingras et al., 2007).
However, applications of mass spectrometry have not been restricted to analyzing
protein primary sequences. Mass spectrometric analysis of intact and partially disassociated
protein complexes can provide information on subunit packing and interaction networks
(Zhou and Robinson, 2010). Applications of ion mobility mass spectrometry on intact
protein complexes and subunits may give rise to additional topology constraints for
structural modelling of protein complexes (Ruotolo et al., 2008; Jurneczko and Barran,
2011).
In the past decade, chemical cross-linking has been introduced to mass spectrometry
based proteomics workflows, which have provided constraints on residue proximity in native
structures of proteins and protein complexes. Distinguished from standard proteomics, which
focuses on detecting primary sequences of proteins, this new cross-linking/MS approach
provides additional information on spatial folding of proteins and protein-protein
interactions. As a consequence, in this thesis, it has been designated with the term 3D
proteomics. In recent applications, 3D proteomics data has played an essential role in
integrated structural analysis of the Pol II-TFIIF complex (Chen et al., 2010) and the 26S
proteasome (Bohn et al., 2010).
CHAPTER 1
3
1.1.3 3D proteomics
As a technique for studying the structure of proteins and protein complexes, 3D proteomics
consists of two major elements: chemical cross-linking and identification of cross-linked
residues using mass spectrometry. Chemical cross-linking is aimed to convert proximity
between amino acid residues in native protein structures and non-covalent protein-protein
interactions into stable covalent bonds with distance constraints. Tracing back to 1970s,
cross-linking treatment has been used in combination with electrophoretic analysis to study
protein-protein interaction in ribosome (Clegg and Hayes, 1974; Sun et al., 1974). Currently
it is also used to stabilize protein complexes for electron microscopies analysis and affinity
purifications (Gingras et al., 2007). However, the identification of cross-links was not
reported until the end of the1990s (Rappsilber et al., 2000; Young et al., 2000). Over the
past 20 years, a series of technical breakthroughs made mass spectrometry an indispensable
tool in proteomics and in all fields of the life sciences. Mass spectrometry provides amazing
power to study protein sequences and determine protein modifications which also make it
possible to reveal the location of cross-links in protein sequences. Cross-linked residue pairs
with distance constraint carry much structural information of proteins and protein
complexes, such as low resolution protein folding, topology of protein complexes and
transient protein-protein interactions.
In order to identify cross-links, the technique of shotgun proteomics has been
adopted for mass spectrometric analysis.
In this strategy, cross-linked proteins are
enzymatically digested into peptides and then analyzed by mass spectrometry. The crosslinked peptides are subsequently identified through database searching and linkage sites are
assigned based on fragmentation data of the cross-linked peptides. This strategy is also
known as the ‘bottom-up’ approach (Figure 1.1).
There is another strategy for mass spectrometric analysis of cross-linked proteins,
which is the ‘top-down’ approach. In this technique intact cross-linked proteins are analyzed.
CHAPTER 1
4