CHEMICAL ANALYSIS OF WATER AND WASTEWATER
Bạn đang xem bản rút gọn của tài liệu. Xem và tải ngay bản đầy đủ của tài liệu tại đây (112.61 KB, 25 trang )
Manahan, Stanley E. "CHEMICAL ANALYSIS OF WATER AND WASTEWATER"
Environmental Chemistry
Boca Raton: CRC Press LLC, 2000
24 CHEMICAL ANALYSIS OF WATER
AND WASTEWATER
__________________________
__________________________
24.1. GENERAL ASPECTS OF ENVIRONMENTAL CHEMICAL
ANALYSIS
Scientists’ understanding of the environment can only be as good as their know-
ledge of the identities and quantities of pollutants and other chemical species in
water, air, soil, and biological systems. Therefore, proven, state-of-the-art techniques
of chemical analysis, properly employed, are essential to environmental chemistry.
Now is a very exciting period in the evolution of analytical chemistry, characterized
by the development of new and improved analysis techniques that enable detection
of much lower levels of chemical species and a vastly increased data throughput.
These developments pose some challenges. Because of the lower detection limits of
some instruments, it is now possible to see quantities of pollutants that would have
escaped detection previously, resulting in difficult questions regarding the setting of
maximum allowable limits of various pollutants. The increased output of data from
automated instruments has in many cases overwhelmed human capacity to assimilate
and understand it.
Challenging problems still remain in developing and utilizing techniques of
environmental chemical analysis. Not the least of these problems is knowing which
species should be measured, or even whether or not an analysis should be performed
at all. The quality and choice of analyses is much more important than the number of
analyses performed. Indeed, a persuasive argument can be made that, given modern
capabilities in analytical chemistry, too many analyses of environmental samples are
performed, whereas fewer, more carefully planned analyses would yield more useful
information.
In addition to a discussion of water analysis, this chapter covers some of the
general aspects of environmental chemical analysis and the major techiques that are
used to determine a wide range of analytes (species measured). Many techniques are
common to water, air, soil, and biological sample analyses and reference is made to
them in chapters that follow.
© 2000 CRC Press LLC
Error and Quality Control
A crucial aspect of any chemical analysis is the validity and quality of the data
that it produces. All measurements are subject to error, which may be systematic (of
the same magnitude and same direction) or random (varying in both magnitude and
direction). Systematic errors cause the measured values to vary consistently from the
true values, this variation is known as the bias. The degree to which a measured
value comes close to the actual value of an analytical measurement is called the
accuracy of the measurement, reflecting both systematic and random errors. It is
essential for the analyst to determine these error components in the measurement of
environmental samples, including water samples. The identification and control of
systematic and random errors falls in the category of quality control (QC)
procedures. It is beyond the scope of this chapter to go into any detail on these
crucial procedures for which the reader is referred to a work on standard methods for
the analysis of water.
1
In order for results from a laboratory to be meaningful, the laboratory needs a
quality assurance plan specifying measures taken to produce data of known quality.
An important aspect of such a plan is the use of laboratory control standards con-
sisting of samples with very accurately known analyte levels in a carefully controlled
matrix. Such standard reference materials are available in the U. S. for many kinds
of samples from the National Institute of Standards and Technology (NIST).
Many environmental analytes are present at very low levels which challenge the
ability of the method used to detect and accurately quantify them. Therefore, the
detection limit of a method of analysis is quite important. Defining detection limit
has long been a controversial topic in chemical analysis. Every analytical method
has a certain degree of noise. The detection limit is an expression of the lowest
concentration of analyte that can be measured above the noise level with a specified
degree of confidence in an analytical procedure. In the detection of analyte, two
kinds of errors can be defined. A Type I error occurs when the measurement finds an
analyte present when it actually is absent. A Type II error occurs when the measure-
ment finds an analyte absent when it is actually present.
Detection limits can be further categorized into several different subcategories.
The instrument detection limit (IDL) is the analyte concentration capable of
producing a signal three times the standard deviation of the noise. The lower level of
detection (LLD) is the quantity of analyte that will produce a measurable signal 99
percent of the time; it is about 2 times the IDL. The method detection limit (MDL)
is measured like the LLD except that the analyte is taken through the whole
analytical procedure, including steps such as extraction and sample cleanup; it is
about 4 times the IDL . Finally, the practical quantitation limit (PQL), which is
about 20 times the IDL, is the lowest level achievable among laboratories in routine
analysis.
24.2. CLASSICAL METHODS
Before sophisticated instrumentation became available, most important water
quality parameters and some air pollutant analyses were done by classical methods,
which require only chemicals, balances to measure masses, burets, volumetric flasks
© 2000 CRC Press LLC
and pipets to measure volumes, and other simple laboratory glassware. The two
major classical methods are volumetric analysis, in which volumes of reagents are
measured, and gravimetric analysis, in which masses are measured. Some of these
methods are still used today, and many have been adapted to instrumental and
automated procedures.
The most common classical methods for pollutant analysis are titrations, largely
used for water analysis. Some of the titration procedures used are discussed in this
section.
Acidity (see Section 3.7) is determined simply by titrating hydrogen ion with
base. Titration to the methyl orange endpoint (pH 4.5) yields the “free acidity” due
to strong acids (HCl, H
2
SO
4
). Carbon dioxide does not, of course, appear in this
category. Titration to the phenolphthalein endpoint, pH 8.3, yields total acidity and
accounts for all acids except those weaker than HCO
3
-
.
Alkalinity may be determined by titration with H
2
SO
4
to pH 8.3 to neutralize
bases as strong as, or stronger than, carbonate ion,
CO
3
2
-
+ H
+
→ HCO
3
-
(24.2.1)
or by titration to pH 4.5 to neutralize bases weaker than CO
3
2
-
, but as strong as, or
stronger than, HCO
3
-
:
HCO
3
-
+ H
+
→ H
2
O + CO
2
(g) (24.2.2)
Titration to the lower pH yields total alkalinity.
The ions involved in water hardness, a measure of the total concentration of
calcium and magnesium in water, are readily titrated at pH 10 with a solution of
EDTA, a chelating agent discussed in Sections 3.10 and 3.13. The titration reaction
is
Ca
2+
(or Mg
2+
) + H
2
Y
2
-
→ CaY
2
-
(or MgY
2
-
) + 2H
+
(24.2.3)
where H
2
Y
2
-
is the partially ionized EDTA chelating agent. Eriochrome Black T is
used as an indicator, and it requires the presence of magnesium, with which it forms
a wine red complex.
Several oxidation-reduction titrations can be used for environmental chemical
analysis. Oxygen is determined in water by the Winkler titration. The first reaction
in the Winkler method is the oxidation of manganese(II) to manganese(IV) by the
oxygen analyte in a basic medium; this reaction is followed by acidification of the
brown hydrated MnO
2
in the presence of I
-
ion to release free I
2
, then titration of the
liberated iodine with standard thiosulfate, using starch as an endpoint indicator:
Mn
2+
+ 2OH
-
+
1
/
2
O
2
→ MnO
2
(s) + H
2
O (24.2.4)
MnO
2
(s) + 2I
-
+ 4H
+
→ Mn
2+
+ I
2
+ 2H
2
O (24.2.5)
I
2
+ 2S
2
O
3
2
-
→ S
4
O
6
2
-
+ 2I
-
(24.2.6)
A back calculation from the amount of thiosulfate required yields the original
quantity of dissolved oxygen (DO) present. Biochemical oxygen demand, BOD (see
© 2000 CRC Press LLC
Section 7.9), is determined by adding a microbial “seed” to the diluted sample, sat-
urating with air, incubating for five days, and determining the oxygen remaining.
The results are calculated to show BOD as mg/L of O
2
. A BOD of 80 mg/L, for
example, means that biodegradation of the organic matter in a liter of the sample
would consume 80 mg of oxygen.
24.3. SPECTROPHOTOMETRIC METHODS
Absorption Spectrophotometry
Absorption spectrophotometry of light-absorbing species in solution, historically
called colorimetry when visible light is absorbed, is still used for the analysis of
many water and some air pollutants. Basically, absorption spectrophotometry
consists of measuring the percent transmittance (%T) of monochromatic light pass-
ing through a light-absorbing solution as compared to the amount passing through a
blank solution containing everything in the medium but the sought-for constituent
(100%). The absorbance (A) is defined as the following:
A = log
100
(24.3.1)
%T
The relationship between A and the concentration (C) of the absorbing substance is
given by Beer's law:
A = abC (24.3.2)
where a is the absorptivity, a wavelength-dependent parameter characteristic of the
absorbing substance; b is the path length of the light through the absorbing solution;
and C is the concentration of the absorbing substance. A linear relationship between
A and C at constant path length indicates adherence to Beer's law. In many cases,
analyses may be performed even when Beer's law is not obeyed, if a suitable
calibration curve is prepared. A color-developing step usually is required in which
the sought-for substance reacts to form a colored species, and in some cases a
colored species is extracted into a nonaqueous solvent to provide a more intense
color and a more concentrated solution.
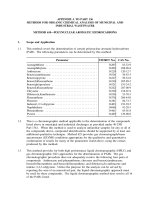
A number of solution spectrophotometric methods have been used for the
determination of water and air pollutants. Some of these are summarized in Table
24.1.
Atomic Absorption and Emission Analyses
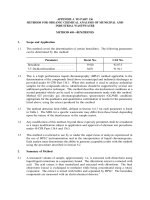
Atomic absorption analysis is commonly used for the determination of metals in
environmental samples. This technique is based upon the absorption of monochrom-
atic light by a cloud of atoms of the analyte metal. The monochromatic light can be
produced by a source composed of the same atoms as those being analyzed. The
source produces intense electromagnetic radiation with a wavelength exactly the
same as that absorbed by the atoms, resulting in extremely high selectivity. The
basic
components
of
an atomic absorption instrument are shown in Figure 24.1. The
© 2000 CRC Press LLC
Table 24.1. Solution Spectrophotometric (Colorimetric) Methods of Analysis
Analyte Reagent and Method
Ammonia Alkaline mercury(II) iodide reacts with ammonia, producing
colloidal orange-brown NH
2
Hg
2
I
3
, which absorbs light between
400 and 500 nanometers (nm)
Arsenic Reaction of arsine, AsH
3
, with silver diethylthiocarbamate in
pyridine, forming a red complex
Boron Reaction with curcumin, forming red rosocyanine
Bromide Reaction of hypobromite with phenol red to form bromphenol blue-
type indicator
Chlorine Development of color with orthotolidine
Cyanide Formation of a blue dye from reaction of cyanogen chloride, CNCl,
with pyridine-pyrazolone reagent, measured at 620 nm
Fluoride Decolorization of a zirconium-dye colloidal precipitate (“lake”) by
formation of colorless zirconium fluoride and free dye
Nitrate and Nitrate is reduced to nitrite, which is diazotized with sulfanilamide
nitrite and coupled with N-(l-naphthyl)-ethylenediamine dihydrochloride
to produce a highly colored azo dye measured at 540 nm
Nitrogen, Digestion in sulfuric acid to NH
4
+
followed by treatment with alka-
Kjeldahl- line phenol reagent and sodium hypochlorite to form blue indo-
phenate method phenol measured at 630 nm
Phenols Reaction with 4-aminoantipyrine at pH 10 in the presence of
potassium ferricyanide, forming an antipyrine dye which is
extracted into pyridine and measured at 460 nm
Phosphate Reaction with molybdate ion to form a phosphomolybdate which is
selectively reduced to intensely colored molybdenum blue
Selenium Reaction with diaminobenzidine, forming colored species absorbing
at 420 nm
Silica Formation of molybdosilicic acid with molybdate, followed by
reduction to a heteropoly blue measured at 650 nm or 815 nm
Sulfide Formation of methylene blue
Surfactants Reaction with methylene blue to form blue salt
Tannin and Blue color from tungstophosphoric and molybdophosphoric acids
lignin
© 2000 CRC Press LLC
key element is the hollow cathode lamp in which atoms of the analyte metal are
energized such that they become electronically excited and emit radiation with a
very narrow wavelength band characteristic of the metal. This radiation is guided by
the appropriate optics through a flame into which the sample is aspirated. In the
flame, most metallic compounds are decomposed, and the metal is reduced to the
elemental state, forming a cloud of atoms. These atoms absorb a fraction of radiation
in the flame. The fraction of radiation absorbed increases with the concentration of
the sought-for element in the sample according to the Beer's law relationship (Eq.
24.3.2). The attenuated light beam next goes to a monochromator to eliminate
extraneous light resulting from the flame, and then to a detector.
Hollow cathode
lamp
+
-
Hollow
cathode
Anode
Fuel/air mixture Aspirated analyte
Burner
Flame with
atomic cloud
Monochromator
Detector
Ar
Monochromatic
light beam
Figure 24.1. The basic components of a flame atomic absorption spectrophotometer.
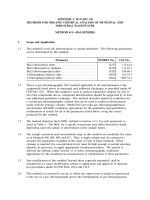
Atomizers other than a flame can be used. The most common of these is the gra-
phite furnace, an electrothermal atomization device which consists of a hollow gra-
phite cylinder placed so that the light beam passes through it. A small sample of up
to 100 µL is inserted in the tube through a hole in the top. An electric current is
passed through the tube to heat it—gently at first to dry the sample, then rapidly to
vaporize and excite the metal analyte. The absorption of metal atoms in the hollow
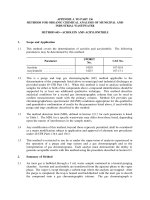
portion of the tube is measured and recorded as a spike-shaped signal. A diagram of
a graphite furnace with a typical output signal is shown in Figure 24.2. The major
advantage of the graphite furnace is that it gives detection limits up to 1000 times
lower than those of conventional flame devices.
A special technique for the flameless atomic absorption analysis of mercury
involves room-temperature reduction of mercury to the elemental state by tin(II)
chloride in solution, followed by sweeping the mercury into an absorption cell with
air. Nanogram (10
-
9
g) quantities of mercury can be determined by measuring
mercury absorption at 253.7 nm.
© 2000 CRC Press LLC
Figure 24.2. Graphite furnace for atomic absorption analysis and typical output signal.
Atomic Emission Techniques
Metals may be determined in water, atmospheric particulate matter, and biolog-
ical samples very well by observing the spectral lines emitted when they are heated
to a very high temperature. An especially useful atomic emission technique is
inductively coupled plasma atomic emission spectroscopy (ICP/AES). The “f1ame”
in which analyte atoms are excited in plasma emission consists of an incandescent
plasma (ionized gas) of argon heated inductively by radiofrequency energy at 4-50
MHz and 2-5 kW (Figure 24.3). The energy is transferred to a stream of argon
through an induction coil, producing temperatures up to 10,000 K. The sample atoms
are subjected to temperatures around 7000 K, twice those of the hottest conventional
flames (for example, nitrous oxide-acetylene operates at 3 s200 K). Since
emission of light increases exponentially with temperature, lower detection limits are
obtained. Furthermore, the technique enables emission analysis of some of the
environmentally important metalloids such as arsenic, boron, and selenium.
Interfering chemical reactions and interactions in the plasma are minimized as
compared to flames. Of greatest significance, however, is the capability of analyzing
as many as 30 elements simultaneously, enabling a true multielement analysis
technique. Plasma atomization combined with mass spectrometric measurement of
analyte elements is a relatively new technique that is an especially powerful means
for multielement analysis.
24.4. ELECTROCHEMICAL METHODS OF ANALYSIS
Several useful techniques for water analysis utilize electrochemical sensors.
These techniques may be potentiometric, voltammetric, or amperometric. Potenti-
ometry is based upon the general principle that the relationship between the potential
of a measuring electrode and that of a reference electrode is a function of the log of
the activity of an ion in solution. For a measuring electrode responding selectively to
a particular ion, this relationship is given by the Nernst equation,
© 2000 CRC Press LLC
E = E
o
+
2.303RT
log(a
z
) (24.4.1)
zF
Plasma “Flame
(ionized gas)
Hottest part
Quartz tube
T to 10,000 K, ~7000 K
in sample—twice
that of hottest flame
~7000 K
High frequency input,
4-50 MHz, 2-5 kW
Argon coolant
(tangential flow)
Argon and
sample aerosol
Tangential argon
flow cools walls
Figure 24.3. Schematic diagram showing inductively coupled plasma used for optical emission
spectroscopy.
where E is the measured potential; E
o
is the standard electrode potential; R is the gas
constant; T is the absolute temperature; z is the signed charge (+ for cations, - for
anions); F is the Faraday constant; and a is the activity of the ion being measured.
At a given temperature, the quantity 2.303RT/F has a constant value; at 25°C it is
0.0592 volt (59.2 mv). At constant ionic strength, the activity, a, is directly propor-
tional to concentration, and the Nernst equation may be written as the following for
electrodes responding to Cd
2+
and F
-
, respectively:
E (in mv) = E
o
+
59.2
log
[Cd
2+
] (24.4.2)
2
E = E
o
- 59.2 log
[F
-
] (24.4.3)
Electrodes that respond more or less selectively to various ions are called ion-
selective electrodes. Generally, the potential-developing component is a membrane
of some kind that allows for selective exchange of the sought-for ion. The glass
electrode used for the measurement of hydrogen-ion activity and pH is the oldest and
most widely used ion-selective electrode. The potential is developed at a glass
membrane that selectively exchanges hydrogen ion in preference to other cations,
giving a Nernstian response to hydrogen ion activity, a
H
+
:
E = E
o
+ 59.2 log(a
H
+
) (24.4.4)
© 2000 CRC Press LLC
Of the ion-selective electrodes other than glass electrodes, the fluoride electrode
is the most successful. It is well-behaved, relatively free of interferences, and has an
adequately low detection limit and a long range of linear response. Like all ion-
selective electrodes, its electrical output is in the form of a potential signal that is
proportional to log of concentration. A small error in E leads to a variation in log of
concentration, which leads to relatively high concentration errors.
Voltammetric techniques, the measurement of current resulting from potential
applied to a microelectrode, have found some applications in water analysis. One
such technique is differential-pulse polarography, in which the potential is applied to
the microelectrode in the form of small pulses superimposed on a linearly increasing
potential. The current is read near the end of the voltage pulse and compared to the
current just before the pulse was applied. It has the advantage of minimizing the
capacitive current from charging the microelectrode surface, which sometimes
obscures the current due to the reduction or oxidation of the species being analyzed.
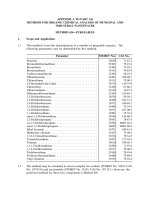
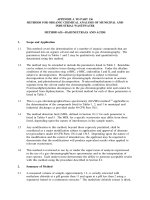
Anodic-stripping voltammetry involves deposition of metals on an electrode surface
over a period of several minutes followed by stripping them off very rapidly using a
linear anodic sweep. The electrodeposition concentrates the metals on the electrode
surface, and increased sensitivity results. An even better technique is to strip the
metals off using a differential pulse signal. A differential-pulse anodic-stripping
voltammogram of copper, lead, cadmium, and zinc in tap water is shown in Figure
24.4.
0.2 ppb Cu
0.4 ppb Pb
0.2 ppb Cd
0.1 ppb Zn
0.0 -0.2 -0.4 -0.6 -0.8 -1.0 -1.2 -1.4
Electrode potential vs. saturated calomel electrode
Figure 24.4. Differential-pulse anodic-stripping voltammogram of tap water at a mercury-plated,
wax-impregnated graphite electrode.
24.5. CHROMATOGRAPHY
First described in the literature in the early 1950s, gas chromatography has
played an essential role in the analysis of organic materials. Gas chromatography is
both a qualitative and quantitative technique; for some analytical applications of
environmental importance, it is remarkably sensitive and selective. Gas chrom-
atography is based upon the principle that when a mixture of volatile materials
transported by a carrier gas is passed through a column containing an adsorbent solid
phase or, more commonly, an absorbing liquid phase coated on a solid material, each
volatile component will be partitioned between the carrier gas and the solid or liquid.
The length of time required for the volatile component to traverse the column is
proportional to the degree to which it is retained by the nongaseous phase. Since
different components may be retained to different degrees, they will emerge from the
© 2000 CRC Press LLC
end of the column at different times. If a suitable detector is available, the time at
which the component emerges from the column and the quantity of the component
are both measured. A recorder trace of the detector response appears as peaks of
different sizes, depending upon the quantity of material producing the detector
response. Both quantitative and (within limits) qualitative analyses of the sought-for
substances are obtained.
The essential features of a gas chromatograph are shown schematically in Figure
24.5. The carrier gas generally is argon, helium, hydrogen, or nitrogen. The sample
is injected as a single compact plug into the carrier gas stream immediately ahead of
the column entrance. If the sample is liquid, the injection chamber is heated to
vaporize the liquid rapidly. The separation column may consist of a metal or glass
tube packed with an inert solid of high surface area covered with a liquid phase, or it
may consist of an active solid, which enables the separation to occur. More
commonly, capillary columns are now employed which consist of very small
diameter, very long tubes in which the liquid phase is coated on the inside of the
column.
Carrier gas
supply
Flow
control
Injector
Column
Detector
Gas
vent
Electrical
signal
Amplifier
and data
processing
Data output,
print of
chromatogram
Figure 24.5. Schematic diagram of the essential features of a gas chromatograph.
The component that primarily determines the sensitivity of gas chromatographic
analysis and, for some classes of compounds, the selectivity as well, is the detector.
One such device is the thermal conductivity detector, which responds to changes in
the thermal conductivity of gases passing over it. The electron-capture detector,
which is especially useful for halogenated hydrocarbons and phosphorus
compounds, operates through the capture of electrons emitted by a beta-particle
source. The flame-ionization gas chromatographic detector is very sensitive for the
detection of organic compounds. It is based upon the phenomenon by which organic
compounds form highly conducting fragments, such as C
+
, in a flame. Application of
a potential gradient across the flame results in a small current that may be readily
© 2000 CRC Press LLC
measured. The mass spectrometer, described in Section 24.6, may be used as a
detector for a gas chromatograph. A combined gas chromatograph/mass spectro-
meter (GC/MS) instrument is an especially powerful analytical tool for organic com-
pounds.
Chromatographic analysis requires that a compound exhibit at least a few mm of
vapor pressure at the highest temperature at which it is stable. In many cases, organic
compounds that cannot be chromatographed directly may be converted to derivatives
that are amenable to gas chromatographic analysis. It is seldom possible to analyze
organic compounds in water by direct injection of the water into the gas
chromatograph; higher concentration is usually required. Two techniques commonly
employed to remove volatile compounds from water and concentrate them are
extraction with solvents and purging volatile compounds with a gas, such as helium;
concentrating the purged gases on a short column; and driving them off by heat into
the chromatograph.
High-Performance Liquid Chromatography
A liquid mobile phase used with very small column-packing particles enables
high-resolution chromatographic separation of materials in the liquid phase. Very
high pressures up to several thousand psi are required to get a reasonable flow rate in
such systems. Analysis using such devices is called high-performance liquid
chromatography (HPLC) and offers an enormous advantage in that the materials
analyzed need not be changed to the vapor phase, a step that often requires
preparation of a volatile derivative or results in decomposition of the sample. The
basic features of a high-performance liquid chromatograph are the same as those of a
gas chromatograph, shown in Figure 24.5, except that a solvent reservoir and high-
pressure pump are substituted for the carrier gas source and regulator. A hypothetical
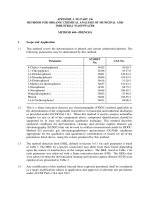
HPLC chromatogram is shown in Figure 24.6. Refractive index and ultraviolet
detectors are both used for the detection of peaks coming from the liquid
chromatograph column. Fluorescence detection can be especially sensitive for some
classes of compounds. Mass spectrometric detection of HPLC effluents has lead to
the development of LC/MS analysis. Somewhat difficult in practice, this technique
can be a powerful tool for the determination of analytes that cannot be subjected to
gas chromatography. High-performance liquid chromatography has emerged as a
very useful technique for the analysis of a number of water pollutants.
Time
Figure 24.6. Hypothetical HPLC chromatogram.
© 2000 CRC Press LLC
Chromatographic Analysis of Water Pollutants
The U. S. Environmental Protection Agency has developed a number of
chromatography-based standard methods for determining water pollutants.
2
Some of
these methods use the purge-and-trap technique, bubbling gas through a column of
water to purge volatile organics from the water followed by trapping the organics on
solid sorbents, whereas others use solvent extraction to isolate and concentrate the
organics. These methods are summarized in Table 24.2.
Ion Chromatography
The liquid chromatographic determination of ions, particularly anions, has
enabled the measurement of species that used to be very troublesome for water
chemists. This technique is called ion chromatography, and its development has
been facilitated by special detection techniques using so-called suppressors to enable
detection of analyte ions in the chromatographic effluent. Ion chromatography has
been developed for the determination of most of the common anions, including ars-
enate, arsenite, borate, carbonate, chlorate, chlorite, cyanide, the halides, hypochlor-
ite, hypophosphite, nitrate, nitrite, phosphate, phosphite, pyrophosphate, selenate,
selenite, sulfate, sulfite, sulfide, trimetaphosphate, and tripolyphosphate. Cations,
including the common metal ions, can also be determined by ion chromatography.
24.6. MASS SPECTROMETRY
Mass spectrometry is particularly useful for the identification of specific organic
pollutants. It depends upon the production of ions by an electrical discharge or
chemical process, followed by separation based on the charge-to-mass ratio and
measurement of the ions produced. The output of a mass spectrometer is a mass
spectrum, such as the one shown in Figure 24.8. A mass spectrum is characteristic of
a compound and serves to identify it. Computerized data banks for mass spectra have
been established and are stored in computers interfaced with mass spectrometers.
Identification of a mass spectrum depends upon the purity of the compound from
which the spectrum is taken. Prior separation by gas chromatography with continual
sampling of the column effluent by a mass spectrometer, commonly called gas
chromatography-mass spectrometry (GC/MS), is particularly effective in the
analysis of organic pollutants.
24.7. ANALYSIS OF WATER SAMPLES
The preceding sections of this chapter have covered the major kinds of analysis
techniques that are used on water. In this section several specific aspects of water
analysis are addressed.
Physical Properties Measured in Water
The commonly determined physical properties of water are color, residue
(solids), odor, temperature, specific conductance, and turbidity. Most of these terms
are
self-explanatory
and
will not be discussed in detail. All of these properties either
© 2000 CRC Press LLC
Table 24.2. Chromatography-based EPA Methods for Organic Compounds in Water
Method Number
Class of compounds GC GC/MS HPLC Example analytes
Purgeable halocarbons 601 Carbon tetrachloride
Purgeable aromatics 602 Toluene
Acrolein and acrylo- 603 Acrolein
nitrile
Phenols 604 Phenol and chlorophenols
Benzidines 605 Benzidine
Phthalate esters 606 Bis(2-ethylhexylphthalate)
Nitrosamines 607 N-nitroso-N-dimethylamine
Organochlorine 608 Heptachlor, PCB 1016
pesticides and PCB’s
Nitroaromatics and 609 Nitrobenzene
isophorone
Polycyclic aromatic 610 610 Benzo[a]pyrene
hydrocarbons
Haloethers 611 Bis(2-chloroethyl) ether
Chlorinated 612 1,3-Dichlorobenzene
hydrocarbons
2,3,7,8-Tetrachloro- 613 2,3,7,8-TCDD
dibenzo-p-dioxin
Organophosphorus 614 Malathion
pesticides
Chlorinated Herbicides 615 Dinoseb
Triazine Pesticides 619 Atrazine
Purgeable organics 624 Ethylbenzene
Base/neutrals and 625 More than 70 organic
acids compounds
Dinitro aromatic 646 Basalin (Fluchloralin)
pesticides
Volatile organic 1624 Vinyl chloride
compounds
influence or reflect the chemistry of the water. Solids, for example, arise from
chemical substances either suspended or dissolved in the water and are classified
physically as total, filterable, nonfilterable, or volatile. Specific conductance is a
measure of the degree to which water conducts alternating current and reflects,
therefore, the total concentration of dissolved ionic material. By necessity, some
physical properties must be measured in the water without sampling (see discussion
of water sampling below).
© 2000 CRC Press LLC
160 170 180 190 200 210 220 230
m/e
20
40
60
80
100
0
Cl
Cl
O CH
2
CO
2
H
Figure 24.7. Partial mass spectrum of the herbicide 2,4-dichlorophenoxyacetic acid (2,4-D), a
common water pollutant.
Water Sampling
It is beyond the scope of this text to describe water sampling procedures in
detail. It must be emphasized, however, that the acquisition of meaningful data
demands that correct sampling and storage procedures be used. These procedures
may be quite different for various species in water. In general, separate samples must
be collected for chemical and biological analysis because the sampling and
preservation techniques differ significantly. Usually, the shorter the time interval
between sample collection and analysis, the more accurate the analysis will be.
Indeed, some analyses must be performed in the field within minutes of sample
collection. Others, such as the determination of temperature, must be done on the
body of water itself. Within a few minutes after collection, water pH may change,
dissolved gases (oxygen, carbon dioxide, hydrogen sulfide, chlorine) may be lost, or
other gases (oxygen, carbon dioxide) may be absorbed from the atmosphere.
Therefore, analyses of temperature, pH, and dissolved gases should always be
performed in the field. Furthermore, precipitation of calcium carbonate accompanies
changes in the pH-alkalinity-calcium carbonate relationship following sample
collection. Analysis of a sample after standing may thus give erroneously low values
for calcium and total hardness.
Oxidation-reduction reactions may cause substantial errors in analysis. For
example, soluble iron(II) and manganese(II) are oxidized to insoluble iron(III) and
manganese(IV) compounds when an anaerobic water sample is exposed to atmos-
pheric oxygen. Microbial activity may decrease phenol or biological oxygen demand
(BOD) values, change the nitrate-nitrite-ammonia balance, or alter the relative
proportions of sulfate and sulfide. Iodide and cyanide frequently are oxidized.
Chromium(VI) in solution may be reduced to insoluble chromium(III). Sodium, sili-
cate, and boron are leached from glass container walls.
Samples can be divided into two major categories. Grab samples are taken at a
single time and in a single place. Therefore, they are very specific with respect to
time and location. Composite samples are collected over an extended time and may
© 2000 CRC Press LLC
encompass different locations as well. In principle, the average results from a large
number of grab samples give the same information as a composite sample. A com-
posite sample has the advantage of providing an overall picture from only one
analysis. On the other hand, it may miss extreme concentrations and important
variations that occur over time and space.
Solid-Phase Extractors
The ease and effectiveness of various kinds of solid-phase devices for water
sampling is steadily increasing their use in water analysis. Based upon size and
physical configuration, at least three categories of such devices are available. One of
these is the conventional solid-phase extractor (SPE) containing an extracting solid
in a column. Activated carbon has been used for decades for this purpose, but
synthetic materials, such as those composed of long hydrocarbon chains (C18)
bound to solids have been found to be quite useful. A typical procedure uses a
polymer-divinylstyrene extraction column to remove pesticides from water.
3
The
pesticide analytes are eluted from the SPE with ethyl acetate and measured by gas
chromatography. A mean recovery of 85% has been reported.
A clever approach to sulfide analysis using SPE has been described.
4
The water
sample is sucked into an airtight syringe to prevent exposure to sulfide-oxidizing
atmospheric oxygen and is immediately reacted with N,N-dimethyl-p-
phenylenediamine sulfate and FeCl
3
, which produces methylene blue, a colored
compound used as an indicator. The resulting solution is forced through a Sep-Pak
C18 solid phase extractor to remove the methylene blue, which is stable for at least
30 days on the solid phase. After elution with a mixture of methanol and 0.01 M
HCl, the absorbance of the methylene blue is measured at 659 nm to quantitate the
sulfide.
Solid-phase microextraction (SPME) devices constitute a second kind of solid-
phase extractor. These make use of very small diameter devices in which analytes
are bonded directly to the extractor walls, then eluted directly into a chromatograph.
The use of SPME devices for the determination of haloethers in water has been
described.
5
A third kind of device, disks composed of substances that bind with and remove
analytes from water when the water is filtered through them, are available for a
number of classes of substances and are gaining in popularity because of their
simplicity and convenience. As an example, solid phase extraction disks can be used
to remove and concentrate radionuclides from water, including
99
Tc,
137
Cs,
90
Sr,
238
Pu.
6
Organic materials sampled from water with such disks include haloacetic
acids
7
and acidic and neutral herbicides.
8
Water Sample Preservation
It is not possible to completely protect a water sample from changes in composi-
tion. However, various additives and treatment techniques can be employed to
minimize sample deterioration. These methods are summarized in Table 24.3.
The most general method of sample preservation is refrigeration to 4°C.
Freezing normally should be avoided because of physical changes—formation of
© 2000 CRC Press LLC
precipitates and loss of gas—which may adversely affect sample composition.
Acidification is commonly applied to metal samples to prevent their precipitation,
and it also slows microbial action. In the case of metals, the samples should be
filtered before adding acid to enable determination of dissolved metals. Sample
holding times vary, from zero for parameters such as temperature or dissolved
oxygen measured by a probe, to 6 months for metals. Many different kinds of
samples, including those to be analyzed for acidity, alkalinity, and various forms of
nitrogen or phosphorus, should not be held for more than 24 hours. Details on water
sample preservation are to be found in standard references on water analysis.
9
Instructions should be followed for each kind of sample in order to ensure mean-
ingful results.
Table 24.3. Preservatives and Preservation Methods Used with Water Samples
Preservative or Effect on Type of samples for which the method
technique used sample is employed
Nitric acid Keeps metals in Metal-containing samples
solution
Sulfuric acid Bactericide Biodegradable samples containing
organic carbon, oil, or grease
Formation of sulfates Samples containing amines or ammonia
with volatile bases
Sodium Formation of sodium Samples containing volatile organic acids
hydroxide salts from volatile or cyanides
acids
Chemical Fix a particular Samples to be analyzed for dissolved
reaction constituent oxygen using the Winkler method
Total Organic Carbon in Water
The importance and possible detrimental effects of dissolved organic compounds
in water were discussed in Chapter 7. Dissolved organic carbon exerts an oxygen
demand in water, often is in the form of toxic substances, and is a general indicator
of water pollution. Therefore, its measurement is quite important. The measurement
of total organic carbon, TOC, is now recognized as the best means of assessing the
organic content of a water sample. The measurement of this parameter has been
facilitated by the development of methods which, for the most part, totally oxidize
the dissolved organic material to produce carbon doxide. The amount of carbon
dioxide evolved is taken as a measure of TOC.
TOC can be determined by a technique that uses a dissolved oxidizing agent
promoted by ultraviolet light. Potassium peroxydisulfate, K
2
S
2
O
8
, can be used as an
oxidizing agent to be added to the sample. Phosphoric acid is also added to the
© 2000 CRC Press LLC
sample, which is sparged with air or nitrogen to drive off CO
2
formed from HCO
3
-
and CO
3
2
-
in solution. After sparging, the sample is pumped to a chamber containing
a lamp emitting ultraviolet radiation of 184.9 nm. This radiation produces reactive
free radical species such as the hydroxyl radical, HO
.
, discussed extensively as a
photochemical reaction intermediate in Chapters 9, 12, and 13. These active species
bring about the rapid oxidation of dissolved organic compounds as shown in the
following general reaction:
Organics + HO
.
→ CO
2
+ H
2
O (24.7.1)
After oxidation is complete, the CO
2
is sparged from the system and measured with
a gas chromatographic detector or by absorption in ultrapure water followed by a
conductivity measurement. Figure 24.8 is a schematic of a TOC analyzer.
Measurement of Radioactivity in Water
There are several potential sources of radioactive materials that may contaminate
water (see Section 7.13). Radioactive contamination of water is normally detected by
measurements of gross beta and gross alpha activity, a procedure that is simpler than
detecting individual isotopes. The measurement is made from a sample formed by
evaporating water to a very thin layer on a small pan, which is then inserted inside
an internal proportional counter. This setup is necessary because beta particles can
penetrate only very thin detector windows, and alpha particles have essentially no
Water
sample
Septum for
injecting sample
and reagents
Pump
CO
2
CO
2
Integrating
CO
2
detector
Oxidizer chamber
Gas for sparging
oxidized sample
Sample
Gas for sparging
unoxidized sample
Figure 24.8. TOC analyzer employing UV-promoted sample oxidation.
penetrating power. More detailed information can be obtained for radionuclides that
emit gamma rays by the use of gamma spectrum analysis. This technique employs
solid state detectors to resolve rather closely spaced gamma peaks in the sample’s
spectra. In conjunction with multichannel spectrometric data analysis, it is possible
to determine a number of radionuclides in the same sample without chemical
separation. This method requires minimal sample preparation.
© 2000 CRC Press LLC
Biological Toxins
Toxic substances produced by microorganisms are of some concern in water.
Photosynthetic cyanobacteria and some kinds of algae growing in water produce
potentially troublesome toxic substances. An immunoassay method of analysis (see
Chapter 25, Section 25.5) for such toxins has been described.
10
Summary of Water Analysis Procedures
The main chemical parameters commonly determined in water are summarized
in Table 24.4. In addition to these, a number of other solutes, especially specific
organic pollutants, may be determined in connection with specific health hazards or
incidents of pollution.
24.8. AUTOMATED WATER ANALYSES
Huge numbers of water analyses must often be performed in order to get mean-
ingful results and for reasons of economics. This has resulted in the development of
a number of automated procedures in which the samples are introduced through a
sampler and the analyses performed and results posted without manual manipulation
of reagents and apparatus. Such procedures have been developed and instruments
marketed
for
the
determination of a number of analytes, including alkalinity, sulfate,
Delay
coil
Mixing coils
Waste
Colorimeter
Data processing
and readout
Proportioning
pump
Air
Buffer and
indicator
Filtered sample
Sampler
Filter
Figure 24.9. Automated analyzer system for the determination of total alkalinity in water.
Addition of a water sample to a methyl orange solution buffered to pH 3.1 causes a loss of color in
proportion to the alkalinity in the sample.
© 2000 CRC Press LLC
Table 24.4. Chemical Parameters Commonly Determined in Water
Chemical species Significance in water Methods of analysis
Acidity Indicative of industrial pollution or Titration
acid mine drainage
Alkalinity Water treatment, buffering, algal Titration
productivity
Aluminum Water treatment, buffering AA,
1
ICP
2
Ammonia Algal productivity, pollutant Spectrophotometry
Arsenic Toxic pollutant Spectrophotometry, AA,
ICP
Barium Toxic pollutant AA, ICP
Beryllium Toxic pollutant AA, ICP, fluorimetry
Boron Toxic to plants Spectrophotometry, ICP
Bromide Seawater intrusion, industrial waste Spectrophotometry,
potentiometry, ion
chromatography
Cadmium Toxic pollutant AA, ICP
Calcium Hardness, productivity, treatment AA, ICP, titration
Carbon dioxide Bacterial action, corrosion Titration, calculation
Chloride Saline water contamination Titration, electrochemical,
ion chromatography
Chlorine Water treatment Spectrophotometry
Chromium Toxic pollutant (hexavalent Cr) AA, ICP, colorimetry
Copper Plant growth AA, ICP
Cyanide Toxic pollutant Spectrophotometry,
potentiometry, ion
chromatography
Fluoride Water treatment, toxic at high Spectrophotometry,
levels potentiometry, ion
chromatography
Hardness Water quality, water treatment AA, titration
Iodide Seawater intrusion, industrial waste Catalytic effect, potenti-
ometry, ion chrom-
atography
Iron Water quality, water treatment AA, ICP, colorimetry
Lead Toxic pollutant AA, ICP, voltammetry
© 2000 CRC Press LLC
Table 24.4 (Cont.)
Lithium May indicate some pollution AA, ICP, flame
photometry
Magnesium Hardness AA, ICP
Manganese Water quality (staining) AA, ICP
Mercury Toxic pollutant Flameless atomic
absorption
Methane Anaerobic bacterial action Combustible-gas indicator
Nitrate Algal productivity, toxicity Spectrophotometry, ion
chromatography
Nitrite Toxic pollutant Spectrophotometry, ion
chromatography
Nitrogen Proteinaceous material Spectrophotometry
(albuminoid)
(organic) Organic pollution indicator Spectrophotometry
Oil and grease Industrial pollution Gravimetry
Organic carbon Organic pollution indicator Oxidation-CO
2
measurement
Organic Organic pollution indicator Activated carbon
contaminants adsorption
Oxygen Water quality Titration, electrochemical
Oxygen demand Water quality and pollution Microbiological-titration
(biochemical)
(chemical) Water quality and pollution Chemical oxidation-
titration
Ozone Water treatment Titration
Pesticides Water pollution Gas chromatography
pH Water quality and pollution Potentiometry
Phenols Water pollution Distillation-colorimetry
Phosphate Productivity, pollution Spectrophotometry
Phosphorus Water quality and pollution Spectrophotometry
(hydrolyzable)
Potassium Productivity, pollution AA, ICP, flame
photometry
Selenium Toxic pollutant Spectrophotometry, ICP,
neutron activation
Silica Water quality Spectrophotometry, ICP
Silver Water pollution AA, ICP
© 2000 CRC Press LLC
Table 24.4 (Cont.)
Sodium Water quality, saltwater intrusion AA, ICP, flame
photometry
Strontium Water quality AA, ICP, flame
photometry
Sulfate Water quality, water pollution Ion chromatography
Sulfide Water quality, water pollution Spectrophotometry, titra-
ion, chromatography
Sulfite Water pollution, oxygen Titration, ion
scavenger chromatography
Surfactants Water pollution Spectrophotometry
Tannin, Lignin Water quality, water pollution Spectrophotometry
Vanadium Water quality, water pollution ICP
Zinc Water quality, water pollution AA, ICP
1
AA denotes atomic absorption
2
ICP stands for inductively coupled plasma techniques, including atomic emission
and detection of plasma-atomized atoms by mass spectrometry.
ammonia, nitrate/nitrite, and metals. Colorimetric procedures are popular for such
automated analytical instruments, using simple, rugged colorimeters for absorbance
measurements. Figure 24.9 shows an automated analytical system for the
determination of alkalinity. The reagents and sample liquids are transported through
the analyzer by a peristaltic pump consisting basically of rollers moving over
flexible tubing. By using different sizes of tubing, the flow rates of the reagents are
proportioned. Air bubbles are introduced into the liquid stream to aid mixing and to
separate one sample from another. Mixing of the sample and various reagents is
accomplished in mixing coils. Since many color-developing reactions are not rapid,
a delay coil is provided that allows the color to develop before reaching the
colorimeter. Bubbles are removed from the liquid stream by a debubbler pror to
introduction into the flowcell for colorimetric analysis.
LITERATURE CITED
1.
“
Data Quality,” Section 1030 in Standard Methods for the Examination of Water
and Wastewater, 20th ed., Clesceri, Lenore, S., Arnold E. Greenberg, Andrew
D. Eaton, and Mary Ann H. Franson, Eds., American Public Health Association,
Washington, D.C., 1998, pp. 1-13–1-22.
2. Understanding Environmental Methods (CD/ROM version), Genium Publishing
Corporation, Schenectady, NY, 1998.
3. Pihlstrom, Tuija, Anna Hellstrom, and Victoria Axelsson, “Gas Chromatographic
Analysis of Pesticides in Water with Off-Line Solid Phase Extraction,”
Analytica Chimica Acta, 356, 155-163 (1997).
4. Okumura, Minoru, Naoaki Yano, Kaoru Fujinaga, Yasushi Seike, and Shuji
Matsuo, “In Situ Preconcentration Method for Trace Dissolved Sulfide in
© 2000 CRC Press LLC
Environmental Water Samples Using Solid-Phase Extraction Followed by
Spectrophotometric Determination,” Analytical Science, 15, 427-431 (1999).
5. Wennrich, Luise, Werner Engewald, and Peter Popp, “GC Trace Analysis of
Haloethers in Water. Comparison of Different Extraction Techniques,”
International Journal of Environmental Analytical Chemistry, 73, 31-41 (1999).
6. Beals, D. M., W. G. Britt, J. P. Bibler, and D. A. Brooks, “Radionuclide
Analysis Using Solid Phase Extraction Disks,” Journal of Radioanalytical and
Nuclear Chemistry, 236, 187-191 (1998).
7. Martinez, D., F. Borrull, M. Calull, and J. Ruana; Colom, “Application of Solid-
Phase Extraction Membrane Disks in the Determination of Haloacetic Acids in
Water by Gas Chromatography-Mass Spectrometry,” Chromatographia, 48,
811-816, (1998).
8. Thompson, T. S. and B. D. Miller, “Use of Solid Phase Extraction Disks for the
GC-MS Analysis of Acidic and Neutral Herbicides in Drinking Water,”
Chemosphere, 36, 2867-2878, (1998).
9. Clesceri, Lenore, S., Arnold E. Greenberg, Andrew D. Eaton, and Mary Ann H.
Franson, Eds., Standard Methods for the Examination of Water and
Wastewater, 20th ed., American Public Health Association, Washington, D.C.,
1998.
10. Rivasseau, Corinne, Pascale Racaud, Alain Deguin, and Marie Claire Hennion,
“Evaluation of an ELISA Kit for Monitoring Microcystins (Cyanobacterial
toxins) in Water and Algae Environmental Samples,” Environmental Science
and Technology, 33, 1520-1527 (1999).
SUPPLEMENTARY REFERENCES
Dieken, Fred P., Methods Manual for Chemical Analysis of Water and Wastes,
Alberta Environmental Centre, Vergeville, Alberta, Canada (1996).
Garbarino, John R. and Tedmund M. Struzeski, Methods Of Analysis By The U.S.
Geological Survey National Water Quality Laboratory—Determination Of
Elements In Whole-Water Digests Using Inductively Coupled Plasma-Optical
Emission Spectrometry And Inductively Coupled Plasma-Mass Spectrometry, U. S.
Department of the Interior U. S. Geological Survey, Denver, 1998.
Keith, Lawrence H., Environmental Sampling and Analysis: A Practical Guide,
Lewis Publishers, Boca Raton, FL, 1991.
Meyers, R. A., Ed., The Encyclopedia of Environmental Analysis and Remediation,
John Wiley and Sons, New York, 1998.
Patnaik, Pradyot, Handbook of Environmental Analysis: Chemical Pollutants in
Air, Water, Soil, and Solid Wastes, CRC Press/Lewis Publishers, Boca Raton, FL,
1997.
Richardson, Susan D., “Water Analysis,” Analytical Chemistry, 71, 281R-215R
(1999).
© 2000 CRC Press LLC
QUESTIONS AND PROBLEMS
1. A soluble water pollutant forms ions in solution and absorbs light at 535 nm.
What are two physical properties of water influenced by the presence of this
pollutant?
2. A sample was taken from the bottom of a deep, stagnant lake. Upon standing,
bubbles were evolved from the sample; the pH went up; and a white precipitate
formed. From these observations, what may be said about the dissolved CO
2
and
hardness in the water?
3. For which of the following analytes may nitric acid be used as a water sample
preservative: H
2
S; CO
2
; metals; coliform bacteria; cyanide?
4. In the form of what compound is oxygen fixed in the Winkler analysis of O
2
?
5. Of the following analytical techniques, the water analysis technique that would
best distinguish between the hydrated Ag(H
2
O)
6
+
ion and the complex
Ag(NH
3
)
2
+
ion by direct measurement of the uncomplexed ion is: (a) neutron-
activation analysis, (b) atomic absorption, (c) inductively coupled plasma atomic
emission spectroscopy, (d) potentiometry, (e) flame emission.
6. A water sample was run through the colorimetric procedure for the analysis of
nitrate, giving 55.0% transmittance. A sample containing 1.00 ppm nitrate run
through the exactly identical procedure gave 24.6% transmittance. What was the
concentration of nitrate in the first sample?
7. What is the molar concentration of HCl in a water sample containing HCl as the
only contaminant and having a pH of 3.80?
8. A 200-mL sample of water required 25.12 mL of 0.0200N standard H
2
SO
4
for
titration to the methyl orange endpoint, pH 4.5. What was the total alkalinity of
the original sample?
9. Analysis of a lead-containing sample by graphite-furnace atomic absorption
analysis gave a peak of 0.075 absorbance units when 50 microliters of pure
sample was injected. Lead was added to the sample such that the added
concentration of lead was 6.0 micrograms per liter. Injection of 50 microliters of
“spiked” sample gave an absorbance of 0.115 absorbance units. What was the
concentration of lead in the original sample?
10. In a 2.63 x 10
-
4
M standard fluoride solution, a fluoride electrode read - 0.100
volts versus a reference electrode, and it read -0.118 volts in an appropriately
processed fluoride sample. What was the concentration of fluoride in the
sample?
11. The activity of iodine-131 (t
1/2
= 8 days) in a water sample 24 days after
collection was 520 pCi/liter. What was the activity on the day of collection?
12. Neutron irradiation of exactly 2.00 mL of a standard solution containing 1.00
mg/L of unknown heavy metal "X" for exactly 30 seconds gave an activity of
1,257 counts per minute, when counted exactly 33.5 minutes after the
irradiation, measured for a radionuclide product of “X” having a half-life of 33.5
© 2000 CRC Press LLC
minutes. Irradiation of an unknown water sample under identical conditions
(2.00 mL, 30.0 seconds, same neutron flux) gave 1,813 counts per minute when
counted 67.0 minutes after irradiation. What was the concentration of "X" in the
unknown sample?
13. Why is magnesium-EDTA chelate added to a magnesium-free water sample
before it is to be titrated with EDTA for Ca
2+
?
14. For what type of sample is the flame-ionization detector most useful?
15. Manganese from a standard solution was oxidized to MnO
4
-
and diluted such
that the final solution contained 1.00 mg/L of Mn. This solution had an
absorbance of 0.316. A 10.00 mL wastewater sample was treated to develop the
MnO
4
color and diluted to 250.0 mL. The diluted sample had an absorbance of
0.296. What was the concentration of Mn in the original wastewater sample?
© 2000 CRC Press LLC