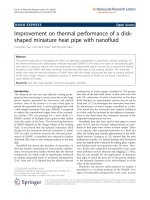
Assessment on the performance of the enhanced displacement ventilation system in the tropics
Bạn đang xem bản rút gọn của tài liệu. Xem và tải ngay bản đầy đủ của tài liệu tại đây (3.38 MB, 139 trang )
ASSESSMENT ON THE PERFORMANCE OF THE ENHANCED
DISPLACEMENT VENTILATION SYSTEM IN THE TROPICS
BY
LI QIAOYAN
(B.Eng, USTB)
A THESIS SUBMITTED
FOR THE DEGREE OF MASTER OF SCIENCE (BUILDING)
DEPARTMENT OF BUILDING
NATIONAL UNIVERSITY OF SINGAPORE
2010
ACKNOWLEDGEMENTS
I wish to express my deepest gratitude to the following persons without whom, this
dissertation would not be possible.
Associate Professor Cheong Kok Wai David, my supervisor for his support,
invaluable advice, supervision and guidance throughout the course of the study.
The generous financial support from National University of Singapore (NUS) for the
Research Project, R-296-000-107-112.
Mr. Sun Weimeng, the research graduate for the research project, for his willingness
in providing guidance, assistance ad advice throughout the dissertation period.
Xiangjing, and Xuchao, for sharing their own research experience, giving invaluable
advices, offering their support and encouragement.
Lab technician Mr. Tan Cheow Beng for his help to provide the necessary equipment
and instruments needed to make this dissertation possible.
Hui Ting and Ronald, for their assistance in the subjective study.
And to those who have helped and contributed in one way or another towards the
completion of this dissertation.
i
TABLE OF CONTENTS
ACKNOWLEDGEMENT............................................................................................ i
TABLE OF CONTENTS............................................................................................. ii
SUMMARY..................................................................................................................iv
LIST OF TABLES........................................................................................................vi
LIST OF FIGURES................................................................................................ ...vii
ABBREVIATIONS..................................................................................................... .x
CHAPTER 1 INTRODUCTION ................................................................................. 1
1.1 Background ..................................................................................................... 1
1.2 Research objectives ......................................................................................... 4
1.3 Scope of the study ........................................................................................... 5
1.4 Organization of thesis ...................................................................................... 5
CHAPTER 2 LITERATURE REVIEW ...................................................................... 7
2.1 Introduction ..................................................................................................... 7
2.2 Gradients in occupied space ............................................................................ 8
2.3 Thermal comfort ............................................................................................ 14
2.4 Human perception study on draught risk ....................................................... 22
2.5 Thermal sensation versus draught perception ................................................ 25
2.6 Implication of personal control...................................................................... 27
2.7 Identification of knowledge gap .................................................................... 28
CHAPTER 3 RESEARCH METHODOLOGY ........................................................ 31
3.1 Enhanced displacement ventilation system ................................................... 31
3.2 Research hypothesis ...................................................................................... 32
3.3 Research design ............................................................................................. 33
3.4 Experimental set-up....................................................................................... 34
3.5 Questionnaire................................................................................................. 47
3.6 Subjects ......................................................................................................... 50
3.7 Method of data collection .............................................................................. 52
ii
3.8 Method of data analysis ................................................................................. 54
CHAPTER 4 DATA ANALYSIS AND DISCUSSION ........................................... 55
4.1 4-fan system study ......................................................................................... 55
4.2 2-fan system study ......................................................................................... 61
4.3 Pollutant transportation study ........................................................................ 73
CHAPTER 5 CONCLUSIONS.................................................................................. 76
5.1 Review and achievement of research objectives ........................................... 76
5.2 Verification of the hypotheses ....................................................................... 79
5.3 Limitations..................................................................................................... 80
5.4 Recommendations for future work ................................................................ 81
BIBLIOGRAPHY ...................................................................................................... 83
APPENDICES.......................................................................................................... A-1
APPENDIX A Regression equations of Teq of body segments of thermal
manikin ...................................................................................................................... A-1
APPENDIX B Questionnaire ............................................................................ B-1
APPENDIX C List of publications.................................................................... C-1
iii
SUMMARY
Displacement Ventilation (DV) system is used to improve the thermal comfort and
Indoor Air Quality (IAQ) in buildings in an energy-efficient manner. However, in an
office environment served by DV system with low floor to ceiling height and heat
load, the temperature stratification is found to be less significant as compared to
large spaces with high floor to ceiling height and heat load. The thermal comfort of
occupants in small spaces served by DV system is also less acceptable. In view of
these limitations of the conventional DV system, an enhanced 4-fan DV system was
developed and evaluated by Sun (2010). It is found that the 4-fan system has
significantly improved the thermal microenvironment around occupants as compared
to the conventional DV system. However, the draught risk and energy consumption
issues have become a problem with the 4-fan system. Hence, a 2-fan enhanced DV
system is developed in this study to overcome these problems.
Experiments were carried out in a mock-up office at the National University of
Singapore. Both objective measurements and subjective assessments were conducted
to investigate the vertical temperature profiles, thermal comfort, thermal
acceptability and contaminant transportation by varying the supply air temperature
of 22±0.5, 24±0.5 and 26±0.5°C. Objective measurements included air velocity, air
temperature, relative humidity (RH), etc. Subjective assessment was performed by
means of questionnaire using thirty-two tropically acclimatized students. A breathing
thermal manikin was also used to simulate human subjects in this study.
iv
Results of the 2-fan study are similar to the 4-fan system with an improved
temperature distribution. The air flow around human body is significantly improved
by the 2-fan system. The vertical temperature profiles became steeper between 0.6 m
and 1.7 m height when the fans were applied. It demonstrates that the fans are
effective in bringing the cooler air to the subjects.
Results of the thermal sensation and thermal comfort are quite different from the
4-fan system. The fans in the 2-fan system are placed in more appropriate locations
to provide cooling and reduce draught around the human body as compared to the
4-fan system, especially at higher ambient temperature of 26°C. Hence, it is more
effective for the 2-fan system to improve the microenvironment of the occupants.
The 2-fan system also helps to save more energy as it consumes less electricity than
the 4-fan system. This promotes energy-efficiency by reducing the carbon emission.
However, the pollutant transportation study shows that, if there are polluting source in
front of the occupant, the concentration of pollutant in the inhaled air is higher for the
2-fan enhanced system as compared to the conventional DV system. A more
comprehensive study is needed for the pollutant study.
v
LIST OF TABLES
Table 2.1
7-point thermal sensation scale
Table 2.2
Criteria stipulated by different standards
Table 3.1
Cooling load of each experiment
Table 3.2
Instruments employed in the experiments
Table 3.3
Experimental conditions (4-fan system)
Table 3.4
Experimental conditions (2-fan system)
Table 3.5
Experimental conditions for pollutant transportation study
Table 3.6
ASHRAE‟s 7-point scale
Table 3.7
Bedford‟s seven point of scale
Table 3.8
Anthropometric data of subjects
Table 3.9
Sequence of the experiments
Table 4.1
Perceived Air Quality with 2-fan system
vi
LIST OF FIGURES
Figure 2.1
A typical displacement ventilation system
Figure 2.2
Temperature gradients in a thermal chamber with different cooling
loads
Figure 3.1
4-fan enhanced DV system
Figure 3.2
2-fan enhanced DV system
Figure 3.3
Research design
Figure 3.4
Layout of the indoor environmental chamber and the annular control
room
Figure 3.5
Layout of indoor environment chamber
Figure 3.6
Semi-circular supply unit and return grille
Figure 3.7
The mock-up plane source
Figure 3.8
The mock-up point source
Figure 3.9
HOBO H08 data logger and Vaisala HM34 humidity and temperature
meter
Figure 3.10 Omni-directional thermo anemometer system HT-400
Figure 3.11 Breathing thermal manikin
Figure 3.12 The connection of the supply and exhaust air respiration of thermal
manikin
Figure 3.13 Control box of the lung system
Figure 3.14 Multi -gas monitor& Multipoint sampler
vii
Figure 3.15 Mass flow controller
Figure 3.16 Measuring locations in horizontal and vertical section
Figure 3.17 The divided continuous visual-analog scale
Figure 3.18 The undivided continuous visual-analog scale
Figure 3.19 The undivided continuous scale for odour intensity and irritations
Figure 3.20 Types of office attire wore by subjects
Figure 4.1
Temperature profile near occupant at 22°C (4-fan)
Figure 4.2
Temperature profile near occupant at 24°C (4-fan)
Figure 4.3
Whole body manikin-based equivalent temperature at 22°C (4-fan)
Figure 4.4
Whole body manikin-based equivalent temperature at 24°C (4-fan)
Figure 4.5
Overall thermal sensation for 4-fan at 22°C
Figure 4.6
Overall thermal sensation for 4-fan at 24°C
Figure 4.7
Local thermal sensation of body segments at 22°C (4-fan)
Figure 4.8
Local thermal sensation of body segments at 24°C (4-fan)
Figure 4.9
Temperature profile near occupant at 22°C (2-fan)
Figure 4.10 Temperature profile near occupant at 24°C (2-fan)
Figure 4.11 Temperature profile near occupant at 26°C (2-fan)
Figure 4.12 Whole body manikin-based equivalent temperature at 22°C (2-fan)
Figure 4.13 Whole body manikin-based equivalent temperature at 24°C (2-fan)
Figure 4.14 Whole body manikin-based equivalent temperature at 26°C (2-fan)
Figure 4.15 Overall thermal sensation for 2-fan at 22°C
Figure 4.16 Comparison between 4-fan and 2-fan systems at 22°C
viii
Figure 4.17 Overall thermal sensation for 2-fan at 24°C
Figure 4.18 Comparison between 4-fan and 2-fan systems at 24°C
Figure 4.19 Overall thermal sensation for 2-fan at 26°C
Figure 4.20 Comparison between 4-fan and 2-fan systems at 26°C
Figure 4.21 Local thermal sensation of body segments for 2-fan at 22°C
Figure 4.22 Local thermal sensation of body segments for 2-fan at 24°C
Figure 4.23 Local thermal sensation of body segments for 2-fan at 26°C
Figure 4.24 Dimensionless concentration of SF6 in the inhaled air by plane source
Figure 4.25 Dimensionless concentration of SF6 in the inhaled air by point source
ix
ABBREVIATIONS
CFD
= Computational Fluid Dynamics
CAV
= Constant Air Volume System
DR
= Draught Risk
DV
= Displacement Ventilation
EHT
= Equivalent Homogeneous Temperature
IAQ
= Indoor Air Quality
HVAC
= Heating, Ventilation and Air-Conditioning
LTS
= Local Thermal Sensation
MV
= Mixing Ventilation
ODR
= Overall Draught Risk
OTC
= Overall Thermal Comfort
OTS
= Overall Thermal Sensation
PAQ
= Perceived Air Quality
PD
= Percentage Dissatisfied
PPD
= Predicted Percentage of Dissatisfied
PV
= Personalized Ventilation
RH
= Relative Humidity
SBS
= Sick Building Syndrome
VOC
=Volatile Organic Compounds
WS
= Work Station
x
CHAPTER 1 INTRODUCTION
CHAPTER 1 INTRODUCTION
1.1 Background
Nowadays people spend approximately 90% of their time indoors, which makes
indoor spaces important microenvironments when addressing health risks from
indoor pollutants. A person‟s daily exposure to air pollutants mainly comes through
the inhalation of indoor air (Guidelines for air quality, WHO, Geneva, 1999). Hence,
indoor climate pertaining to thermal comfort and indoor air quality (IAQ), is
increasingly recognized as an essential factor in the prevention of human diseases
and promotion of people‟s comfort, health and productivity (Seppänen and Fisk,
2005; Tham, 2004; Wargocki et al, 2004a; 2004b; 2005).
In an effort to conserve energy, modern building design has favored tighter structures
with lower rates of ventilation (Guidelines for air quality, WHO, Geneva, 1999).
Meanwhile, more and more complex synthetic materials are being used in buildings.
These materials emit pollutants such as formaldehyde, Volatile Organic Compounds
(VOC), etc. Hence, the inadequate ventilation rates lead to an accumulation of
pollutants and eventually exceed the threshold limit and affect occupants‟ health.
Therefore, the ultimate goal of air-conditioning system in buildings is to strive to
achieve thermally comfortable and healthy indoor environments for occupants in an
energy-efficient way (Yu, 2006).
Displacement Ventilation (DV) can be one of the solutions due to its characteristic of
1
CHAPTER 1 INTRODUCTION
providing good IAQ while saving energy (Riffat et al, 2004). DV system has been
commonly used in industrial buildings in Scandinavian countries since the 1970‟s as
a ventilation strategy (Breum and Orhehde, 1994; Niemelä et al, 2001). In the past
30 years, its use has been extended to ventilation in small spaces such as classrooms,
offices and other commercial spaces where, in addition to IAQ, comfort is an
important consideration (Nishioka et al, 2000; John et al, 2001). Recently, there is a
growing interest of combining the DV system with other air conditioning systems,
such as chilled ceiling and Personalized Ventilation (PV) systems, to achieve better
performance (Cermak et al, 2004; Melikov et al, 2003; Riffat et al, 2004).
However, Mixing Ventilation (MV) is still one of the most common air distribution
systems used in buildings. In MV systems, conditioned air is supplied from the air
diffusers mounted near the floor at a relatively high velocity into the room. The
conditioned air mixes with the ambient room air and dilutes the concentration of
indoor contaminants. In the most effective scenario, mixing ventilation creates a
relatively uniform thermal and air quality environment. Every occupant in the space
is exposed to a similar level of pollutants even though one may be far from the
polluting source. On the contrary, the principle of DV system is buoyancy driven.
The conditioned air is supplied from a low sidewall or floor diffuser at a very low
velocity. When it comes into contact with a heat source such as people, lighting,
computers, electrical equipments, etc, the cool air will rise and carry contaminants
and heat up to the upper zone, away from the occupants. The air quality in the
occupied zone will generally be much better than with the uniform mixed room air.
2
CHAPTER 1 INTRODUCTION
However, cooling or heating capacity of air is limited by the nature of the need for
careful thermal control of the supply air temperature. DV system has to supply a
large quality of air from floor area which may cause draught. Cold discomfort at the
feet, ankles and legs due to draught and vertical air temperature difference was often
reported with DV system (Melikov and Nielsen, 1989).
There are numerous researches on DV system. However, most of such studies
focused on the temperate climatic conditions area. The performance of the DV
system in the hot and humid climate such as Singapore may be, different from that in
a temperate climate. Tropically acclimatized occupants may also have different
thermal and Perceived Air Quality (PAQ) perception from the people living in the
temperate climatic condition. Hence, there is a need to investigate the performance
of the DV system in the tropics.
Moreover, displacement ventilation systems supply air directly to the occupied zone
at low velocities to have minimal induction and mixing. It is usually used for
ventilation and cooling of large spaces with high floor to ceiling height and heat load,
such as auditorium and atrium, where the thermal plume is more significant with
greater energy-saving as it only serves the occupied zone rather than the entire space.
By extending the application of DV system to small spaces, this disadvantage has
been taken into consideration.
Hence, it is necessary to investigate how to improve the thermal comfort and indoor
air quality of a DV system in small spaces with lower floor to ceiling height and
3
CHAPTER 1 INTRODUCTION
lower heat load as compared to large spaces in the tropics.
Some students in the National University of Singapore have conducted a series of
experiments using the 4-fan enhanced DV system to enhance the performance of the
conventional DV system in the tropics. The main objective of those studies was to
bring cooler air from the floor level to the occupants, in order to improve the thermal
comfort and indoor air quality around human bodies in small spaces with low heat
load and low floor-to-ceiling height.
However, it is argued that the 2-fan system might be a better option to achieve the
same effort. The draught risk might be reduced with the 2-fan system and therefore
better thermal sensation could be perceived. In addition, the energy-saving potential
of 2-fan system is also greater.
Hence, the primary motivation of this study is to investigate if the 2-fan system would
receive a more positive response in terms of thermal comfort as compared to the 4-fan
system.
1.2 Research objectives
In view of the points discussed earlier, the performance of the enhanced DV system
in terms of occupants‟ thermal and sensation acceptability and indoor air quality,
will be investigated in this study. This study will mainly focus on thermal comfort
and Perceived Air Quality (PAQ). The draught risk of the enhanced DV system will
also been studied. The objectives of this study are as follow:
4
CHAPTER 1 INTRODUCTION
1. To investigate the impact of the 2-fan enhanced DV system on the airflow
around human body;
2. To assess occupants‟ thermal comfort with the 2-fan enhanced DV system;
3. To determine the effect of the 2-fan enhanced DV system to reduce draught
risk and improve thermal sensation with comparison to the 4-fan system;
4. To assess the impact of the 2-fan enhanced DV system on the pollutant
transportation when there is a polluting source in the room; and
5. To explore the energy-saving potential of the 2-fan system and compare to
the conventional DV system and 4-fan system.
1.3 Scope of the study
The scope of this research project includes objective measurement and subjective
assessment to determine the performance of the 2-fan enhanced DV system with
respect to thermal comfort, indoor air quality and its energy-saving potential in the
tropics.
1.4 Organization of thesis
The outline of this thesis is briefly described as follow:
Chapter One outlines the background, objectives, scope of this study and
organization of this thesis.
Chapter Two presents the performance of the conventional DV system and reviews
5
CHAPTER 1 INTRODUCTION
past work related to thermal comfort, IAQ, energy efficiency and draught risk in a
DV environment.
Chapter Three presents the research methodology adopted in this study. A new 2-fan
enhanced DV system is introduced to improve the performance of the 4-fan system.
Based on the literature review, the research hypothesis is developed for this study,
followed by the description of the research design, experimental conditions, methods
of data collection and methods of data analysis.
Chapter Four focuses on the results and discussion of both the objective and
subjective studies done in the research. Vertical temperature profiles of various
experiments under different conditions and the equivalent temperature of the thermal
manikin are presented. Subjective responses to the various experimental conditions
are analyzed and the impact of the enhanced DV system on the pollutant
transmission is also discussed.
Chapter Five highlights the concluding remarks of the research, the limitations of the
study and some recommendations for future research.
6
CHAPTER 2 LITERATURE REVIEW
CHAPTER 2 LITERATURE REVIEW
2.1 Introduction
Displacement ventilation was first applied to industrial buildings in 1938. Since then,
the system has been increasingly used in Scandinavian countries and eventually
spread worldwide as a means of ventilation in industrial facilities to provide good
indoor air quality while saving energy (Breum and Orhede, 1994; Niemelä et al,
2001; John et al, 2001). Its application has been extended from large scale spaces
with high floor to ceiling height, such as theatres and auditoriums, to small spaces
such as classrooms, offices and other commercial spaces where, in addition to IAQ,
comfort is an important consideration (Nishioka et al, 2000; John et al, 2001).
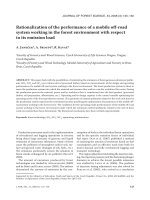
A typical displacement ventilation system, as shown in Figure 2.1, supplies
conditioned air at a very low velocity (less than 0.5 m/s) from a low sidewall or floor
diffuser and exhausts the air at the ceiling level. The supply air temperature is
slightly lower than the designed room air temperature. Since it is cooler than the
room air, the supply air is spread over the floor and then rises as it comes into
contact with heat sources, such as peoples, computers, etc in the occupied space.
These heat sources create upward convective flows in the form of thermal plumes
(Cheong et al, 2004). The air laden with heat and contaminants rises to the upper
zone of the room space (John et al, 2001).Thus, the air is stratified with a lower zone
of fresh cool air and an upper zone of mixed and contaminated warm air.
7
CHAPTER 2 LITERATURE REVIEW
Fig 2.1 A typical displacement ventilation system
This chapter presents a review of past research categorized into: 1) gradients; 2)
thermal comfort; 3) draught risk and 4) implication of personal control. This is
followed by the identification of the knowledge gap.
2.2 Gradients in occupied space
2.2.1 Temperature distribution
Flatheim et al (1984) measured the temperature distribution in an office room served
by a DV system. It was found that nearly half of the total temperature difference was
leveled out at the floor area in some places. A linear temperature gradient from the
floor to the ceiling was perceived in the rest of the room. Studies by Chen and Van
De Kooi (1988), Nielsen (1988), Mundt (1990) and Li et al (1992) showed that the
dimensionless air temperature (θ) near the floor decreases with the increase of
ventilation rate. Nielson (1996) pointed out that the dimensionless temperature near
the floor varies between 0.3 and 0.65 for different types of heat sources. A
subsequent study by Mundt (1996) showed that the temperature gradient was
8
CHAPTER 2 LITERATURE REVIEW
substantially linear in the room and strongly dependent on the ventilation rate.
Hashimoto et al (2005) concluded that vertical temperature profiles shifted
horizontally with the change of supply air temperature. This means that room air
temperature at any height is controlled by the regulation of supply air temperature
when the set point room air temperature changes.
Yuan et al (1999a) conducted both experimental measurements and computational
fluid dynamics (CFD) modeling and found that the temperature gradient at the lower
part would be larger than at the upper part when most of the heat sources were in the
lower part of the room. Murakami et al (1998) analyzed both flow and temperature
fields around a modeled standing human body using CFD program and found that
the gradient became very steep between the feet and waist levels.
Yuan et al (1999b) measured and calculated airflow served by DV system for 3
typical room configurations: a small office, a large office with partitions and a
classroom. It was shown that DV system created significant temperature
stratification. Temperature gradients were steeper in the occupied zone. Since
occupants occupy the lower zone of a room, this temperature stratification represents
a potential risk of draught and thus it is critical to ensure that the temperature
difference is sufficiently small between the head and feet levels. Hence, thermal
comfort considerations imposed an upper limit to the allowable vertical temperature
gradients in office spaces. ISO 7730 (2005) presents moderate thermal environments
and recommends that vertical temperature difference between 0.1m and 1.1m above
9
CHAPTER 2 LITERATURE REVIEW
floor shall be less than 3˚C for optimal thermal comfort.
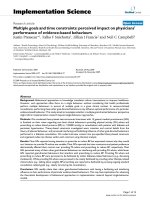
Figure 2.2 shows a study of the vertical temperature profile in a thermal chamber
with different cooling loads (Xu et al, 2001). It is observed that the temperature
profile could be separated into two regions: (1) a steep temperature gradient (floor
level to 1.0-1.2m height), and (2) a gentle temperature gradient (1.0-1.2m height to
ceiling level) when the indoor heat load exists.
Fig 2.2 Temperature gradients in a thermal chamber with different cooling loads
(Source: Xu et al, 2001)
Vertical temperature distribution in a displacement ventilated room is also dependent
on the vertical location of the heat sources (Skistad et al, 2002). When the heat
sources are located in the lower part of a room, temperature gradient in the lower
part is larger as compared to that in the upper part. On the other hand, the
temperature gradient is smaller in the lower part and increases in the upper part when
the heat sources are located at high level. Park et al (2001) used 2-dimensional
computational simulations to examine the effect of vertical location of a convective
heat source on thermal DV systems. The convective heat gain from the heat source
10
CHAPTER 2 LITERATURE REVIEW
to an occupied zone became less significant when the location of the heat source
above the floor increased. This effect changed the temperature field and resulted in
the reduction of the cooling load in the occupied zone. The stratification level was
also affected by the heat source location at a given flow rate. Li et al (2005)
confirmed the findings by CFD simulation.
2.2.2 Concentration distribution
The advantage of DV system as compared to MV system is that it can bring about
better air quality in the occupant zone. However, when the contaminant source is
combined with the heat source, the upward thermal plume will carry the
contaminants over the heat source to the upper zone of the room. This resulted in
more polluted air in the upper zone while the air in the lower zone is as clean as the
supply air.
By using the tracer gas technique, Mundt (1994) found that in a room with DV
system, a person can experience good air quality in the breathing zone, even if this
zone was located in a polluted layer. The convective plume around human body may
break through the polluted layers and increase local ventilation effectiveness. The
DV system served as a demand controlled system for clean air from the lower part of
the room. Brohus (1997) also found that the entrainment of air around human body
was usually an advantage of DV system when there were no passive contaminant
sources. Murakami et al (1998) conducted a CFD study of concentration distribution
for different locations of contaminant generation. It is found that the rising plume
11
CHAPTER 2 LITERATURE REVIEW
around the body was not broken by the surrounding airflow. The air quality at the
breathing zone was dependant on the location of the contaminant generation. When
the contaminant is generated in the upper part of the room, above the breathing
height, and the air in the lower part of the room was relatively clean, the rising
stream of air had a positive influence on the quality of inhaled air. Conversely, the
rising stream of air had a negative effect on the quality of inhaled air if contaminants
were generated in the lower part of the room, below the breathing height.
In the study by Yuan et al (1999c) where CFD was applied and Yuan et al (1999a)
where both measurement and CFD modeling were employed, it is found that the
concentration of CO2 in the lower zone was less than that in the upper zone. It was
also demonstrated that as convective flow around a human body brought air from a
lower zone to the breathing zone, the inhaled contaminant concentration was lower
than that at the nose level in the middle of the room.
In another study, Mundt (2001) evaluated particle transportation and ventilation
efficiency with non-buoyant contaminant sources in a DV room. A re-suspension of
floor deposited particles caused by influence of supply air or people moving around
may increase the number of particles in convection flows. Concentration of particles
at different positions under a steady state and transit conditions was measured. The
results showed that there seemed to be a lower risk of re-suspension of particles, in
the measured size interval, by the influence of the supply air. The contaminant
removal effectiveness depended on the position of the pollutant sources.
12
CHAPTER 2 LITERATURE REVIEW
Mixing and displacement ventilation systems were also compared in an intervention
study in classrooms (Mattsson et al, 2003). The distribution of particles, cat allergen,
and CO2 was measured at different heights above the floor during regular lessons.
With MV system, the concentration of particle decreased with height, with a stronger
gradient occurring for larger particles. With DV system, the concentration of particle
increased with height, except for particles> 25μm. The DV system thus has a slight
upward displacement effect on most of the particles. Significant correlations were
found between concentrations of cat allergen and particles in the size fraction
1-10μm. The concentration of particles and cat allergen at breathing height did not,
however, differ significantly between the two ventilation systems. Mean CO 2
concentration at 1.1m height was about 10% lower with a DV system than with a
MV system. A fairly high level of physical activity of pupils is believed to have a
significant dispersing effect on the airborne contaminants.
Yang et al (2004) applied a computer model to simulate the distribution and time
history of contaminant concentrations in a mockup office. Three ventilation methods,
namely one DV and two MV systems using a side grille and a ceiling square diffuser
were studied respectively. The contaminant sources were assumed to be at the floor
level, one with a constant emission rate and the other with a fast decaying source
(VOC emissions from a wood stain). Simulation results showed that different
ventilation methods affected the pollutant distributions within a room. When the
pollutant sources were distributed on the floor and not associated with a heat source or
initial momentum, DV system performed no worse than a perfect mixing system at
13
CHAPTER 2 LITERATURE REVIEW
the breathing zone. The effects of source type and location on contaminant dispersion
were studied by He et al (2005) in a displacement ventilated room by both
experimental and numerical methods. The results showed that the source type and
location affected the contaminant distributions for both point and area source cases.
Even when the contaminant source was at the floor level, a DV system can still
generate slightly lower concentration at or below the breathing zone, as compared to a
MV system. Zhang L. et al (2005) used a validated CFD program to investigate and
compare the performances of DV and MV system under different boundary
conditions. This comparison showed that, with proper design, installation,
maintenance and operation, the DV system can maintain a better IAQ, especially at
the breathing zone. The numerical results showed that the air was younger at
breathing zone for the DV system than that of the MV system. CO 2 generated by the
occupants was also easier to be expelled in the DV cases. The TVOC concentration in
the occupied zone was well below the limits for both mixing and DV modes while the
pollutant levels showed a very small difference between the two ventilation modes.
2.3 Thermal comfort
Thermal comfort is the condition of mind that expresses satisfaction with a thermal
environment (ISO Standard 7730, 2005). In general, thermal comfort occurs when
body temperatures are within narrow ranges, skin moisture is low, and the physical
effort of regulation is minimized (ASHRAE Standard 55, 2004). Numerous
researchers such as Berglund (1995), Gagge (1937), Hardt (1997) and Hensel (1973,
14