Báo cáo toán học: " On transmission performance of OFDM-based schemes using MMSE-FDE in a frequencyselective fading channel" pot
Bạn đang xem bản rút gọn của tài liệu. Xem và tải ngay bản đầy đủ của tài liệu tại đây (492.48 KB, 10 trang )
RESEARCH Open Access
On transmission performance of OFDM-based
schemes using MMSE-FDE in a frequency-
selective fading channel
Haris Gacanin
1*
and Fumiyuki Adachi
2
Abstract
There has been greatly increasing interest in orthogonal frequency division multiplexing (OFDM) for broadband
wireless transmission due to its robustness against multipath fading. However, OFDM signals have high peak-to-
average power ratio (PAPR), and thus, a power amplifier must be operated with a large input power backoff (IBO).
Recently, OFDM combined with time division multiplexing (OFDM/TDM) using minimum mean square error-
frequency domain equalization (MMSE-FDE) has been presented to reduce the PAPR, while improving the bit error
rate (BER) performance of conventional OFDM. In this article, by extensive computer simulation, we present a
comprehensive performance comparison of OFDM-based schemes in a nonlinear and frequency-selective fading
channel. We discuss about the transmission performance of OFDM-based schemes with respect to the transmit
peak-power, the achievable capacity, the BER per formance, and the signal bandwidth. Our results show that
OFDM/TDM using MMSE-FDE achieves a lower peak-power and capacity than conventional OFDM, which means
significant reduction of amplifier transmit-power backoff, but with a slight decrease in signal bandwidth occupancy.
Keywords: OFDM/TDM, OFDM, capacity, power spectrum density, bit error rate, amplifier power efficiency
I. Introduction
In a wireless channel, a signal propagates over a number
of different paths that give rise to a frequency-selective
fading, which produce severe inter-symbol interference
(ISI) and degrades the transmission performance [1]. To
solve this problem, intensive research effort on fre-
quency domain channel equalization (FDE) is currently
ongoing in two directions: (i) orthogonal frequency divi-
sion multiplexing (OFDM) [2], and (ii) single carrier
(SC)-FDE [3]. To avoid the performance degradation of
OFDMduetohighPAPR,thehightransmitpower
amplifier (HPA) must be operated with a large input
backoff (IBO). Otherwise, the system performance in
terms of the bit error rate (BER), channel capacity,
throughput, etc., may be degraded. The performance of
OFDM system over a nonlinear channel (e.g., HPA or
amplitude limiter) has been analyzed in the recent lit-
erature [4-6].
Of late, various approaches to reduce the PAPR of
OFDM have been proposed [7-12]. The conventional
OFDM and SC-FDE are compared in [13] with respect
to their BER performances, PAPR, carrier frequency off-
set, and computational complexity. In [14], the perfor-
mance of clipped OFDM is analyzed in terms of the
PAPR reduction capability and degradat ion of the chan-
nel capacity. It was shown that the nonlinearity signifi-
cantly degrades the channel capacity of OFDM due to
the high PAPR.
Recently, OFDM combined with time division multi-
plexing (OFDM/TDM) [15] using minimum mean
square error FDE (MMSE-FDE) [16] was presented to
reduce the PAPR, while improving the BER performance
of conventional OFDM. The PAPR problem, however,
cannot be completely eliminated. OFDM/TDM using
MMSE-FDE transmits data over N
m
(= N
c
/K)subcar-
riers, where N
c
is the number of subcarriers in the con-
ventional OFDM. A nat ural consequence is that the
capacity may decrease due to the reduced number of
subcarriers. In particular, as stated in [14], the c hannel
capacity further decreases in a nonlinear channel due to
* Correspondence:
1
Motive Division, Alcatel-Lucent Bell N.V., Antwerp, Belgium
Full list of author information is available at the end of the article
Gacanin and Adachi EURASIP Journal on Wireless Communications
and Networking 2011, 2011:193
/>© 2011 Gacanin and Adachi; licensee Springer. This is an Open Access article dis tributed under the terms of the Cr eative Commons
Attribution License (http://creativecomm ons.org/licenses/by/2.0), which permits unrestricted use, distribution, and reproductio n in
any medium, provided the original work is prop erly cited.
the PAPR problem of OFDM. Hence, some additional
PAPR reduction technique must be applied.
In [17], we analyzed the theoretical BER performanc e
of amplitude clipped and filtered OFDM/TDM using
MMSE-FDE. However, to unveil a potential of OFDM/
TDM using MMSE-FDE, a more detailed transmission
performance comparison in terms of transmit peak-
power, the channel capaci ty and the spectrum splatter of
OFDM/TDM, and the conventional OFDM is required.
To the best of our knowledge, such performance compar-
ison between OFDM/TDM using MMSE-FDE and the
conventional OFDM has not been reported.
In this article, we provide a comprehensive perfor-
mance comparison between OFDM/TDM using MMSE-
FDE and the conventional OFDM. A trade-off between
the transmit peak-power reduction (i.e., IBO reduction),
the achievable capacity, the BER performance and the
power spectrum efficiency is discussed. We discuss
about how, and by how much, OFDM/TDM using
MMSE-FDE improves the transmission performance in
comparison with con ventional OFDM system. Our aim
is to show that OFDM/TDM using MMSE-FDE can be
used in practical systems to overcome the high PAPR
problem of conventional OFDM at the cost of slight
decrease in spect rum efficiency. The capacity of OFDM/
TDM using MMSE-FDE is o btained based on the Gaus-
sian assumption of the OFDM/TDM signal amplitude.
The remainder of this article is organized as follow s.
Section II presents OFDM/TDM using MMSE-FDE sys-
tem model. The computer simulation results and discus-
sions are presented i n Section III. Section IV concludes
the article.
II. System overview
In this section, we begin with a brief overview of the
conventional OFDM and later, OFDM/TDM using
MMSE-FDE is presented. The information bit sequence
of length M is channel coded with a coding rate R and
mapped into the transmit data s ymbols, corresponding
to quadrature phase shift keying (QPSK) modulation
scheme. This sequence is divided into blocks {d
m
(i); i =
0~N
c
-1},m =0~M/N
c
-1,withE[|d
m
(i)|
2
]=1,
where E[·] denotes the ensemble average operation. In
this study, without loss of generality, we consider a
transmission of one block and thus, the block index m
is omitted in what follows.
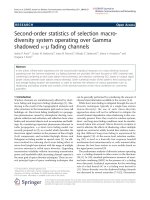
A. Conventional OFDM
The conventional OFDM system model is illustrated in
Figure 1. In the conventional OFDM system, an N
c
data-
modulated symbol sequence {d(i); i =0~N
c
- 1} is fed to
JN
c
-point inverse fast Fourier transform (IFFT) to gener-
ate an oversampled time-domain OFDM signal with N
c
subcarriers. Throughout this study, the oversampling
ratio J is used to approximate the time domain transmit
signal with high accuracy. After insertion of guard inter-
val (GI) the signal is fed to p re-linearized HPA (i.e., the
signal is clipped and filtered by a soft-limiter model),
where linear amplification is achieved until the saturation
output power level P
s
(normalizedbytheinputsignal
power). We assume that the amplifier saturation l evel
equals the clipping level. Finally, the signal is transmitted
over a frequency-selective fading channel.
At the receiver, after removing the GI, the N
c
-point
FFT is applied to decompose the received signal into N
c
subcarriers {R(n); n =0~N
c
- 1}. The distortion in the
channel has the effect of changing the phase and amp li-
tude of each subcarri er, which is corrected by the single
tap FDE through multiplication of the received signal R
(n) by the equalization weight w(n) [2].
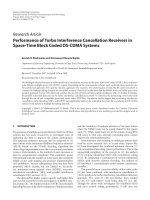
B. OFDM/TDM using MMSE-FDE
The OFDM/TDM transmission system model is illustrated
in Figure 2. In OFDM/TDM the N
c
-subcarrier OFDM sig-
naling interval (i.e., OFDM/TDM frame) is divided into K
slots. A date-modulated symbol sequence {d(i); i =0~N
c
- 1} to be transmitted is divided into K subblocks each
having N
m
(= N
c
/K) data-modulated symbols. A time and
frequency symbol arrangement for conventional OFDM
and OFDM/TDM is presented in Figure 3. The kth sub-
block {d
k
(i); i =0~N
m
- 1} is transm itted in the kth slot,
where d
k
(i)=d(kN
m
+i)fork =0~K -1.Then,JN
m
-point
IFFT is applied to generate the kth slot oversampled time-
domain OFDM signal with N
m
subcarriers as
s
k
(t )=
√
2P
N
m
−1
i=0
d
k
(i) exp
j2πt
i
JN
m
(1)
Data modulation
JN
c
-point IFFT
GI
Info data
s(t)
(a) Transmitter
AWGN
-GI
…
N
c
-point FFT
w(n)
R(n)
…
…
…
(
b
)
Receiver
Figure 1 Conventional OFDM transmitter/receiver structure.
Gacanin and Adachi EURASIP Journal on Wireless Communications
and Networking 2011, 2011:193
/>Page 2 of 10
for t =0~N
m
-1,whereP = E
s
/T
c
N
m
denotes the
transmit signal power. E
s
and T
c
denote the data-modu-
lated symbol energy and the sampling interval of the
IFFT, respectively. TheOFDM/TDMsignalcanbe
expressed using the equivalent low-pass representation
as
s(t)=
K−1
k=0
s
k
(t − kN
m
)u(t − kN
m
)
(2)
for t =0~N
c
-1,whereu(t) = 1(0) for t =0~N
m
-
1 (elsewhere). After insert ion of the guard interval (GI),
the OFDM/TDM signal is fed into pre-linearized HPA
as in the case of conventional OFDM and transmitted
over a frequency-selective fading channel.
The OFDM/TDM signal propagates through the chan-
nel with a discrete-time channel impulse response h(τ)
given as
h(τ )=
L−1
l=0
h
l
δ(τ − τ
l
),
(3)
where h
l
and τ
l
are the path gain and the time delay,
respectively, of the lth path having the sample-spaced
exponential power-delay profile with chann el decay fac-
tor b (i.e.,
E[|h
g,l
|
2
]=
1 −β
1 −β
L
β
l
). We assume that the
maximum time delay of the channel is less than the GI
length.
At the receiver, N
c
-point FFT is applied over the
entire OFDM/TDM frame [16] to decompose the
received signal into N
c
frequency components repre-
sented by {R(n); n =0~N
c
- 1}. One-tap MMSE-FDE
[3] is applied to R(n)as
ˆ
R(n)=R(n)w(n),
(4)
where w(n) is the equalization weight given by [16]
w(n)=
H
∗
(n)
|H(n)|
2
+
E
s
N
0
−1
,
(5)
where H(n)andN
0
denote the Fourier transform of
the channel impulse response and the single-sided addi-
tive white Gaussian noise (AWGN) power spectrum
density (PSD), respectively.
The time-domain OFDM/TDM signal is recovered by
applying N
c
-point IFFT to
{
ˆ
R(n); n =0∼ N
c
− 1}
and
then, the OFDM demodulation is carried out using N
m
-
point FFT to obtain decision variables
{
ˆ
d
k
(i); i =0∼ N
m
− 1}
[16]. For channel decoding, the
log-likeliho od ratios (LLRs) are computed before decod-
ing [18].
We note here that OFDM/TDM using MMSE-FDE
for K = 1 (i.e., N
m
= N
c
) reduces to the conventional
OFDM system with N
c
= 256 subcarriers.
III. Performance analysis
We first de velop a mathematical model for PAPR distri-
bution of OFDM/TDM signal and then, we develop the
expression for the capacity of OFDM/TDM using
MMSE-FDE.
A. PAPR of OFDM/TDM
The baseband oversampled OFDM/TDM signal given by
(2) is considered. The PAPR of the observed OFDM/
TDM frame is defined as the ratio of the peak power to
the ensemble average power and can be expressed as
PAPR =
max{|s(t)|
2
}
t=0∼JN
c
−1
E{|s(t) |
2
}
.
(6)
The expression for PAPR distribution of OFDM/TDM
is derived based on assumption that JN
m
-point IFFT
size is large enough so that real and imaginary part of
Data modulation
JN
m
-point IFFT
Frame generation
GI per
frame
Info data
s(t)
(a) Transmitter
AWGN
-GI
…
OFDM
/TDM
demod.
N
c
-point FFT
w(n)
R(n)
…
N
c
-point IFFT
MMSE-FDE
(
b
)
Receiver
Figure 2 OFDM/TDM transmitter/receiver structure.
t
f
d(0)
d(1)
d(15)
t
d(3)
d(2)
d(1)
d(0)
d(7)
d(6)
d(5)
d(4)
d(11)
d(10)
d(9)
d(8)
d(15)
d(14)
d(13)
d(12)
f
(a) Conventional OFDM (N
c
=16) (b) OFDM/TDM (N
c
=16; N
m
=4, K=4
)
Figure 3 Time and frequency data arrangement.
Gacanin and Adachi EURASIP Journal on Wireless Communications
and Networking 2011, 2011:193
/>Page 3 of 10
the k th time slot OFDM signal s
k
(t), for t =0~JN
m
-1,
are samples of zero-mean statistically independent
Gaussian process with unit variance. Hence, the ampli-
tudes {r(t)(=|s
k
(t)|); t =0~JN
m
- 1} are independent-
and-identically distributed (i.i.d.) Rayleigh random vari-
ables [1].
Cumulative distribution function (cdf) F(l
k
)ofthe
PAPR l
k
for the kth slot is given by
F( λ
k
)=
1 −exp
(
−λ
k
)
JN
m
.
(7)
We assume that the block data-modulated symbols {d
k
( i); i =0~N
m
-1}andk =0~K - 1 are statistically
independent, so that the OFDM/TDM signal is gener-
ated from K statistically independent OFDM signals.
Hence, the PAPR probability of OFDM/TDM is given
by
F
OFDM/TDM
(λ)=
1 −
1 −exp
(
−λ
)
JN
m
K
.
(8)
It can be seen from (8) that the PAPR of OFDM/
TDM decreases as K increases. For K = 1, the above
expression collapses to the PAPR expression for the
conventional OFDM. The above PAPR probability
expression given by (8) together with computer simula-
tion results is evaluated in the next section.
B. Channel capacity of OFDM/TDM using MMSE-FDE
From here on, we analyze capacity of the OFDM/TDM
using MMSE-FDE based on the assumption that non-
linear distortion caused by power amplifier is Gaussian.
We assume perfect channel knowledge.
Using the Bussgang theorem [5,6], the received
OFDM/TDM signal can be expressed as
R
(
n
)
= αS
(
n
)
H
(
n
)
+ αI
(
n
)
+ S
c
(
n
)
H
(
n
)
+ N
(
n
)
.
(9)
where S(n), H(n), I(n), S
c
(n), and N(n)denotethe
Fourier transform of tr ansmitted OFDM/TDM signal,
the channel gain, the inter-slot interference (ISI), the
nonlinear distortion, and zero mean AWGN process,
respectively, having single-sided power spectrum density
N
0
. a denotes the attenuation constant that can be well
approximated as
α
=1−exp (−P
2
s
)+
√
πP
s
2
erfc (P
s
)
[4-6],
where P
s
is the HPA power saturation level (normalized
by the input average signal power), and
erfc[x]=
2
√
π
∞
x
exp(−t
2
)dt
is the complementary error
function.
After MMSE-FDE, the time-domain OFDM/TDM sig-
nal is recovered by applying N
c
-point IFFT to
{
ˆ
R(n); n =0∼ N
c
− 1}
and then, OFDM demodulation
is carried out by N
m
-point FFT to obtain decision vari-
ables:
ˆ
d
k
(i)=
2E
s
T
c
N
m
αd
k
(i)
1
N
c
N
c
−1
n=0
ˆ
H(n)
+ μ
k
(i)
(10)
with
ˆ
H(n)=H(n)w(n)
. In the above expression, μ
k
( i)
denotes the kth slot composite noise (i.e., the sum of
nonlinear component, AWGN, and residual ISI after
FDE). We approximate μ
k
(i) as a zero-mean complex-
valued Gaussian process and that μ
k
(i)isuncorrelated
with d
k
(i). Thus, the variance of μ
k
(i) can be computed
as
2σ
2
=
2α
2
E
s
T
c
N
c
N
c
−1
n=0
ˆ
H(n) −
1
N
c
N
c
−1
m=0
ˆ
H(m)
2
|(n)|
2
+
2E
s
N
m
T
c
N
c
N
c
−1
n=0
1 − exp(−P
2
s
) − α
2
|
ˆ
H(n)|
2
|(n)|
2
+
2N
0
T
c
N
c
N
c
−1
n
=
0
|w(n)|
2
|(n)|
2
,
(11)
where
(n)=
1
N
m
sin
πN
m
n−Ki
N
c
sin
π
n−Ki
N
c
× exp
jπ
(2k +1)N
m
− 1
n − Ki
N
c
.
(12)
We note here that the first term in (11) denotes the
residual ISI, and it is omitted in the case of the conven-
tional OFDM.
For the given P
s
and E
s
/N
0
, the ergodic channel capa-
city C[E
s
/N
0
, P
s
] in bps/Hz over a Rayleigh channel can
be computed as [1]:
C[E
s
/N
0
, P
s
]=E
C
E
s
N
0
, P
s
, {H(n)}
=
∞
0
···
∞
0
C
E
s
N
0
, P
s
, {H(n)}
℘[{H(n)}] ×
n
dH(n)
,
(13)
where C (E
s
/N
0
,{H(n)}) and ℘ [{H(n)}] denote the con-
ditional channel capacity given by [1]:
C
E
s
N
0
, P
s
, {H(n)}
=
1
N
c
N
c
−1
n=0
log
2
1+γ
E
s
N
0
, P
s
, {H(n)}
.
(14)
and the joint probability density function of {H(n); n =
0~N
c
- 1}, respectively. A closed or convenient expres-
sion for numerical calculation has not been found for
integral in (13), and thus, we resort to a different
approach. The signal-to-noise plus interference-and-dis-
tortion ratio g (·) of OFDM/TDM using MMSE-FDE is
first computed using (10) as
γ
E
s
N
0
, P
s
, {H(n)}
=
2α
2
E
s
T
c
N
m
1
N
c
N
c
−1
n=0
ˆ
H(n)
2
2σ
2
.
(15)
Gacanin and Adachi EURASIP Journal on Wireless Communications
and Networking 2011, 2011:193
/>Page 4 of 10
Using (15), we can write (13) as
C
E
s
N
0
, P
s
=
1
N
c
∞
0
···
∞
0
N
c
−1
n=0
log
2
1+γ
E
s
N
0
, {H(n)}
× ℘[{H(n)}]
n
dH(n).
(16)
Theevaluationoftheergodiccapacityisdoneby
Monte Carlo numerical-computation method as follows.
Asetofpathgains{h
l
; l =0~L - 1} is generated using
(3) to obtain channel gains {H(n); n =0~N
c
- 1}. Then,
the capacity given by (16) is computed using (15) for
the given set of channel gains {H(n)} as a function of
the E
s
/N
0
and the normalized saturation level P
s
of the
power amplifier. This is repeated a sufficient number of
times to obtain the average capacity.
Iv. Numerical evaluation and discussions
We assume an OFDM/TDM frame size of N
c
= 256
samples, GI length of N
g
= 32 samples, and ideal coher-
ent quadrature phase shift keying (QPSK) data modula-
tion/demodulation. As the propagation channel, we
assume an L = 16-path block Rayleigh fading channel
having the exponential power-delay profile with channel
decay factor b. It is assumed that the maximum time
delay of the channel is less than the GI length. The
information bit sequence length is taken to be M =
1024 bits. A (2048, 1024) low-density parity check
(LDPC) encoder [19] is assumed with code rate R,and
sum product algorithm (SPA) decoder having column
weight = 1, and row weight = 8. A rate R =1/3turbo
encoder with constraint length 4 and (13, 15) recursive
systematic convolutional (RSC) component encoders is
applied, while the parity bit sequences are punctured to
obtain coding rate of 1/2. The turbo coded bit sequence
is interleaved before data modulation. A block interlea-
ver used as channel interleaver in the simulation is of
size 2a and 2b block interleaver, where a and b are the
maximum allowable integers for a given sequence size
so that we can obtain an interleave r as close as possible
to a square one. The internal interleaver for turbo cod-
ing is S-random
S = N
1
2
interleaver. Log-MAP
decoding with eight iterations is carried out at the
receiver.
A. Bit error rate issue
The BER performance with and without channel coding
as a function of the average signal energy per bit-to-
AWGN power spectrum density ratio E
b
/N
0
= 0.5 ×R×
( E
s
/N
0
) × (1 + N
g
/N
c
) is illustrated in Figure 4. In our
sim ulation, we consider turbo and LDPC channel enco-
ders with rate R = 1/2. As seen from Figure 4a, the
coded BER of conventional OFDM (K = 1) is better
than OFDM/TDM with K = 16 (64) (i.e., 1.4 (0.15) dB
lower E
b
/N
0
is required to achieve BER = 10
-4
). Unlike
uncoded case where the BER decreases as K increases,
with turbo coding, a trade-off is present among fre-
quency diversity gain, coding gain due to better fre-
quency interleaving effect, and orthogonality distortion
between consecutive slotswithinOFDM/TDMframe;
for higher (lower) K, the coding gain is lower (higher)
due to the reduced frequency-interleaving effect, while
higher (lower) frequency diversity gain is obtained. Con-
sequently, for turbo-coded case, the appropriate para-
meter K may be chosen to achieve the same BER as
conventional OFDM while still giving the lower PAPR.
It can be seen from the Figure 4b that the LDPC-coded
1.E-04
1.E-03
1.E-02
1
.E-
01
0 5 10 15 20 25 30 35
Average E
b
/N
0
(dB)
Average BE
R
K=1 (OFDM)
K=4
K=8
K=16
K=64
K=256 (SC)
OFDM (K=1)
K
=4
K
=8
K
=16
K
=64
SC (K =256)
K
K
f
D
T
s
=0.0014, QPSK,
L
=16,
β
=0 dB
uncoded
coded
Turbo
coded
(
R
=0.5)
(a) Turbo coded
1.E-04
1.E-03
1.E-02
1.E-01
0 5 10 15 20 2
5
Average E
b
/N
0
(dB)
Average BER
K
=
LDPC
coded
(R =0.5)
uncoded
QPSK
L
=16
=0 dB
OFDM
(
K
=1
)
f
D
T
s
=10
-4
MMSE-FDE
4
16
64
(
b
)
LDPC coded
Figure 4 BER versus E
b
/N
0
.
Gacanin and Adachi EURASIP Journal on Wireless Communications
and Networking 2011, 2011:193
/>Page 5 of 10
BER performance is almost the same irrespective of the
designed parameter K.
Figure 5 illustrates the average BER performance of
OFDM/TDM with MMSE-FDE as a function of the
amplifier’s saturation power level P
s
normalized by the
input signal power for E
b
/N
0
=30dBwithK as a para-
meter. The figure shows that OFDM/TDM can be used
to reduce the required IBO, while achieving the better
BER than the conventional OFDM. For example, if the
require d BER = 10
-3
, then the conventional OFDM (K =
1) cannot achieve this performance irrespective of P
s
.
Hence, to achieve BER = 10
-3
with reduced IBO, we can
use OFDM/TDM. When K increases from 16 to 32, the
HPA power saturation level P
s
can be reduced from 7 to
1dBforBER=10
-3
, respectively. Note that K =64can
achieve BER = 10
-3
irrespective of P
s
.Thisisbecauseas
K increases, the PAPR of the OFDM/TDM signal
reduces, and the signal is less degraded in the HPA. It is
seen from Figure 5 that as K increases t he required
peak-power (i.e., IBO) of OFDM/TDM is reducing; for
the average BER = 10
-4
, IBO ca n be reduced by about
1.3, 2.9 and 5.1 dB, compared to the conventional
OFDM, when K =4,16,and64,respectively,asshown
in Figure 5. The worst performance is ach ieved with the
conventional OFDM (K = 1) due to large PAPR.
B. Power efficiency issue
In this section, we discuss about the peak-power that i s
proportional to the PAPR of the transmitted signal. By
def init ion, it can be shown that the theoretical PAPR of
OFDM/TDM is proportional to the number of subcar-
riers N
m
(= N
c
/K). The PAPR values (in decibels) of
OFDM/TDM and conventional OFDM, which represent
the required IBO for QPSK constellation are given in
Table 1. It is seen from the table that the PAPR of
OFDM is as large as 24 dB, while, for OFDM/TDM
with K = 4 and 16, the PAPR reduces to 18 and 12 dB,
respectively. Although the PAPR i ncreases linearly with
the number of subcarriers N
m
, the probability that such
a peak will occur decreases exponentially with N
m
.
Figure 6 illustrates the theoretical and computer-simu-
lated complementary cdf (ccdf) of PAPR for OFDM/
TDM as a func tion of K when N
c
= 256. The theoretical
ccdf of OFDM/TDM and the conventional OFDM are
computed using (8). Also presented below are the com-
puter simulation results for the OFDM/TDM signal
transmission to confirm the validity of the theoretical
analysis. Computer simulation results for ccdf of PAPR
are obtained over 20 million OFDM/TDM frames. A
fairly good agreement with theoretical and computer-
simulated results is seen, which confirms the validity of
our PAPR analysis based on the Gaussian approximation
of the OFDM/TDM signal. It can be seen from the fig-
ure that, as K increases, the PAPR
10%
level, by which the
PAPR of OFDM/TDM exceeds with a probability of
10%, is about 9, 8, 6.5, and 3 dB for K =1(OFDM),4,
16, and 256 (SC), respectively.
We also consider the required peak transmit power
because it is an important design parameter of transmit
power amplifiers. For conventional OFDM transmission,
high PAPR causes signal degradation due to nonlinear
power amplification, and the BER performance degrades.
Figure 7 illustrates the BER performance of the coded
OFDM/TDM using MMSE-FDE as a function of the
peak transmit power with K as a parameter. We con-
sider the PAPR
10%
level, which the PAPR of OFDM/
TDM exceeds with a probability of 10%. PAPR
10%
are
about 8.5, 7.2, and 5.7 dB for K = 1, 16, and 64, respec-
tively. It is seen fro m the figure that for turbo code the
conventional OFDM (K = 1) gives the worst perfor-
mance due to the large PAPR. As K increases the
required peak-power (i.e., IBO) of OFDM/TDM is redu-
cing; for the average BER = 10
-4
, IBO can be reduced by
about 1.3, 2.9, and 5.1 dB, compared to the conventional
OFDM, when K = 4, 16 and 64, respectively, as shown
in Figure 4. In the case of LDPC codes the performance
improvement is slightly larger in comparison with
turbo-coded performance. We note here that the
1.E-06
1.E-05
1.E-04
1.E-03
1.E-02
012345678
P
s
(
dB
)
Average BER
K=1
256 (SC)
L
=16
E
b
/N
0
=30 dB
MMSE-FDE
K
=1
(
OFDM
)
4
16
64
Figure 5 BER versus P
s
.
Table 1 PAPR comparison between OFDM/TDM and
conventional OFDM
Parameters N
c
= 256, N
m
= N
c
/K PAPR level (dB)
Conventional OFDM K =1,N
m
= 256 24.08
OFDM/TDM K = 4 (16), N
m
= 64 (16) 18.06 (12.04)
Gacanin and Adachi EURASIP Journal on Wireless Communications
and Networking 2011, 2011:193
/>Page 6 of 10
performance improvement presented above is paid with
lower spectral effi ciency as presented in the next
section.
C. Channel capacity issue
The channel capacity in bps/Hz is illustrated in Figure 8
as a function of the amplifier ’s saturation power level P
s
normalized by the input signal power with K as a para-
meter for E
b
/N
0
= 30 dB (for a low E
b
/N
0
the achievable
capacity is almost the same irrespective of K,andthe
capacity trade-off as a function of K cannot be
observed). The capacity of OFDM/TDM using MMSE-
FDE is illustrated in Figure 8 as a function P
s
for the
average bit energy-to-AWGN power spectrum density
ratio E
b
/N
0
= 30 dB, where E
b
/N
0
=0.5× (E
s
/N
0
) × (1+
N
g
/N
c
). The figure shows that for lower P
s
(<8dB),the
performance of OFDM/TDM using MMSE- FDE with K
= 4, 16 and 64 outperforms the conventional OFDM (K
= 1), while the best capacity is achieved with SC-FDE (K
= 256) payed by the lower signal bandwidth occupancy.
On the contrary, for higher P
s
(>8 dB) the highest capa-
city is achieved with the conventional OFDM (K =1),
while the lowest is achieved with SC-FDE (K = 256).
D. Channel code rate issue
Here, the impact of different code rates on the BER per-
formance with K as a parameter is evaluated by compu-
ter simulation. Figure 9 illustrates the BER performance
as a function of design parameter K for both turbo- and
LDPC channel-coding techniques. It can be seen from
the figure that the impact of K on th e BER performance
with different code rates is not high for b oth channel
encoders. We note here that the impacts of different
decoding strategies are not taken into consideration, and
it are out of the scope of this study.
E. The channel frequency-selectivity issue
As said earlier, t he performance improvement of
OFDM/TDM is attributed to the frequency-diversity
effect achieved by the MMSE-FDE. This suggests that
1.E-03
1.E-02
1.E-01
1.E+00
012345678910111
2
PAPR
(
dB
)
Prob [PAPR>abscissa]
OFDM
(K =1)
K
=16
K
=4
Simulation
Theor
y
SC
(K =256)
Figure 6 PAPR distribution of OFDM/TDM.
1.E-04
1.E-03
1.E-02
1
.E-
01
510152
0
Peak E
b
/N
0 (90%)
(dB)
A
verage BER
K=1
K=4
K=16
K=64
Turbo
coded
(
R =0.5
)
QPSK
L
=16
=0 dB
f
D
T
s
=10
-4
MMSE-FDE
OFDM
K
=4
K
=16
K
=64
Uncoded
(a) Turbo coded
1.E-04
1.E-03
1.E-02
1.E-01
510152
0
Peak E
b
/N
0 (90%)
(dB)
A
verage BER
K=1
K=4
K=16
K=64
QPSK
L
=16,
=0 dB
f
D
T
s
=10
-4
MMSE-FDE
LDPC
coded
(R =0.5)
OFDM
K
=4
K
=16
K
=64
Uncoded
(
b
)
LDPC coded
Figure 7 BER versus Peak E
b
/N
0
.
Gacanin and Adachi EURASIP Journal on Wireless Communications
and Networking 2011, 2011:193
/>Page 7 of 10
the BER performance depends on the channel frequency
selectivity. The measure of the channel selectivity is the
decay factor b of the channel power-delay profile. The
dependency of the achievable BER performance on b is
shown in Figure 10 for both turbo and LDPC encoders.
As was expected, as b becomes larger, the performance
of OFDM/TDM with higher K degrades for both enco-
ders due to less frequency- diversity effect resulting from
the weaker frequency selectivity. It can be also se en
from the figure that in the case of LDPC channel enco-
der, the BER performance of OFDM/TDM is more
stable in comparison with the performance of turbo
channel encoder.
F. Transmit signal bandwidth issue
In this section, our focus is on the spectral efficiency
of the OFDM/TDM and conventional OFDM. The
PSD is computed over a sequence of 64,000 fra mes
with J = 16 oversampled OFDM/TDM waveform and
averaged 10
6
times. Figure 11 illustrates the PSD of
OFDM/TDM (K = 4 and 16) and conventional OFDM
(K = 1) with the amplifier’s power saturation level P
s
=
4 dB. It is seen from the figure that OFDM/TDM
achieves a lower spe ctral efficiency in comparison with
the conventional OFDM; the spectral efficiency
decreases as K increases. This is because OFDM/TDM
signals have discontinuity in their waveforms within
the OFDM/TDM frame and cause a higher-order spec-
tral spreading. However, a better PSD of conventional
OFDM is achieved at a cost of higher PAPR and BER,
as discussed above.
G. Complexity issue
The computational complexity of OFDM/TDM has
been evaluated in [20] by using the number of the
required complex multiplications of IFFT/FFT operation
as the comparison metric. It has been shown that the
complexity of OFDM/TDM transmitter is lower than
the complexity of its receiver, while the complexities of
transmitter and receiver for the conventional OFDM are
almost the same. On the other hand, the total (i.e.,
transmitter/receiver) complexity of OFDM/TDM is
0
1
2
3
4
5
6
02468101214161
8
P
s
(
dB
)
Bps/Hz
O
MMSE-FDE
L
=16
E
b
/N
0
=30 dB
4
K =1
(
OFDM
)
256
(SC)
16
64
Figure 8 Impact of P
s
on capacity.
1.E-09
1.E-07
1.E-05
1.E-03
1
.E-
01
03264
A
verage BER
K
BER (0.5)
BER (0.66)
BER (0.75)
QPSK
L=16
=0 dB
f
D
T
s
=10
-4
Turbo code
R=0.5
R=0.66
R=0.75
E
b
/N
0
=12 dB, MMSE-FDE
1.E-09
1.E-07
1.E-05
1.E-03
1.E-01
0326
4
Average BER
K
R=0.5
R=0.66
R=0.75
LDPC code
R=0.5
R=0.66
R=0.75
QPSK
L=16
=0 dB
f
D
T
s
=10
-4
MMSE-FDE, E
b
/N
0
=12 dB
(a) Turbo coded
(
b
)
LDPC coded
Figure 9 BER versus K.
Gacanin and Adachi EURASIP Journal on Wireless Communications
and Networking 2011, 2011:193
/>Page 8 of 10
larger in comparison with the complexity of the conven-
tional OFDM [20].
V. Conclusion
In this article, we ha ve analyzed and discussed a trade-
off between the peak-power reduction, the channel
capacity, and the spectrum efficiency for OFDM/TDM
using MMSE -FDE was presented. It was shown that the
OFDM/TDM reduces the peak-transmit power (i.e.,
IBO) for the same BER, but with a slight increase in
PSD in comparison with the conventional OFDM. It
was also shown that OFDM/TDM using MMSE-FDE
can be designed to achieve a higher capacity with a
lower PAPR in comparison with the conventional
OFDM in a nonlinear and frequency-selective fading
channel. Hence, OFDM/TDM using MMSE-FDE pro-
vides flexibility in designing an OFDM-based systems.
Acknowledgements
This study was supported in part by 2010 KDDI Foundation Research Grant
Program.
Author details
1
Motive Division, Alcatel-Lucent Bell N.V., Antwerp, Belgium
2
Graduate
School of Engineering, Tohoku University, Sendai, Japan
Competing interests
The authors declare that they have no competing interests.
Received: 4 July 2011 Accepted: 2 December 2011
Published: 2 December 2011
References
1. JG Proakis, Digital communications, 3rd edn. (McGraw-Hill, New York, 1995)
2. S Hara, R Prasad, Multicarrier Techniques for 4G Mobile Communications
(Artech House, Norwood, MA, 2003)
3. D Falconer, SL Ariyavisitakul, A Benyamin-Seeyar, Eidson B, Frequency-
domain equalization for single-carrier broadband wireless systems. IEEE
Commun Mag. 40,58–66 (2002)
4. M Friese, On the degradation of OFDM signals due to peak-clipping in
optimally predistorted power amplifiers, in Proceeding of IEEE GlobeCom, vol.
2. (Sydney, Australia, 1998), pp. 939–944
5. P Banelli, S Cacopardi, Theoretical analysis and performance of OFDM signals
in nonlinear AWGN channels. IEEE Trans Commun. 48(3), 430–441 (2000)
6. D Dardari, V Tralli, A Vaccari, A theoretical characterization of nonlinear
distortion effects in OFDM systems. IEEE Trans Commun. 48(10), 1755 (2000)
7. R O’Neill, LB Lopes, Envelope Variations and Spectral Splatter in Clipped
Multicarrier Signals, in Proceedings of the 1995 IEEE International Symposium
on Personal, Indoor and Mobile Radio Communications (PIMRC 1995),
Toronto, Canada, pp. 71–75 (11-14 September 1995)
1.E-04
1.E-03
1.E-02
1.E-01
012 345
Channel Decay Factor (dB)
Average BER
K=1 (OFDM)
K=4
K=16
K=64
L =16, f
D
T
s
=10
-4
, E
b
/N
0
=8 dB
K
=1 (OFDM)
K
=4
K
=16
K
=64
Uncoded
Turbo coded
(R =0.5)
QPS
K
MMSE-FDE
(a) Turbo coded
1.E-04
1.E-03
1.E-02
1.E-01
012345
Channel Decay Factor (dB)
A
verage BER
K=1 (OFDM)
K=4
K=16
K=64
L =16, f
D
T
s
=10
-4
, E
b
/N
0
=8 dB
K
=1 (OFDM)
K
=4
K
=16
K
=64
Uncoded
LDPC coded
(R =0.5)
QPS
K
MMSE-FDE
(
b
)
LDPC coded
Figure 10 BER versus channel decay factor b.
-30
-25
-20
-15
-10
-5
0
4
5
Normalized fre
q
uenc
y
PSD
(d
B
)
Series
3
0
05
0.5
15
1
OFDM
(K =1)
K
=4
0
05
0.5
15
1
P
s
=4 dB
K
=16
N
c
=256
N
m
=N
c
/K
Figure 11 PSD performance.
Gacanin and Adachi EURASIP Journal on Wireless Communications
and Networking 2011, 2011:193
/>Page 9 of 10
8. AE Jones, TA Wilkinson, SK Barton, Block coding scheme for reduction of
peak to mean envelope power ratio of multicarrier transmission scheme.
Elect Lett. 30(22), 2098–2099 (1994)
9. BS Krongold, DL Jones, PAR reduction in OFDM via active constellation
extension. IEEE Trans Broadcasting 49(3), 258–268 (2003)
10. SH Muller, JB Huber, OFDM with reduced peak-to-average power ratio by
optimum combination of partial transmit sequences. Elect Lett. 33(5),
368–369 (1997)
11. RW Bauml, RFH Fisher, JB Huber, Reducing the peak-to-average power ratio
of multicarrier modulation by selected mapping. Elect Lett. 32(22),
2056–2057 (1996)
12. P Van Eetvelt, G Wade, M Tomlinson, Peak to average power reduction for
OFDM schemes by selective scrambling. Elect Lett. 32(21), 1963–1964
(1996)
13. Z Wang, X Ma, G Giannakis, OFDM or single-carrier block transmission. IEEE
Trans Commun. 52(3), 380–394 (2004)
14. H Ochiai, H Imai, Performance analysis of deliberately clipped OFDM signals.
IEEE Trans Commun. 50(1), 89–101 (2002)
15. CV Sinn, J Gotze, M Haardt, Common architectures for TD-CDMA and
OFDM based mobile radio systems without the necessity of a cyclic prefix,
in Proceedings of the MS-SS Workshop, DLR, Oberpfaffenhofen, Germany
(24–25 September 2001)
16. H Gacanin, S Takaoka, F Adachi, OFDM combined with TDM using
frequency-domain equalization. J Commun Netw. 9(1), 34–42 (2007)
17. H Gacanin, F Adachi, PAPR advantage of amplitude clipped OFDM/TDM.
IEICE Trans Commun. E91-B(3), 931–934 (2008)
18. C Berrou, A Glavieux, P Thitimajshima, Near optimum error correcting
coding and decoding: Turbo codes. IEEE Trans Commun. 44(10), 1261–1271
(1996)
19. T Wadayama, A coded modulation scheme based on low density parity
check codes. IEICE Trans Commun. E81-B(10), 1–5 (2001)
20. H Gacanin, S Takaoka, F Adachi, Bit error rate analysis of OFDM/TDM with
frequency-domain equalization. IEICE Trans Commun. E89-B(2), 509–517
(2006)
doi:10.1186/1687-1499-2011-193
Cite this article as: Gacanin and Adachi: On transmission performance
of OFDM-based schemes using MMSE-FDE in a frequency-selective
fading channel. EURASIP Journal on Wireless Communications
and Networking 2011 2011:193.
Submit your manuscript to a
journal and benefi t from:
7 Convenient online submission
7 Rigorous peer review
7 Immediate publication on acceptance
7 Open access: articles freely available online
7 High visibility within the fi eld
7 Retaining the copyright to your article
Submit your next manuscript at 7 springeropen.com
Gacanin and Adachi EURASIP Journal on Wireless Communications
and Networking 2011, 2011:193
/>Page 10 of 10