Capital account liberalization and choice of exchange rate regimes the case of china
Bạn đang xem bản rút gọn của tài liệu. Xem và tải ngay bản đầy đủ của tài liệu tại đây (643.64 KB, 105 trang )
CAPITAL ACCOUNT LIBERALIZATION
AND CHOICE OF EXCHANGE RATE REGIMES:
THE CASE OF CHINA
GUO LUJIAN
A THESIS SUBMITTED
FOR THE DEGREE OF MASTER
OF SOCIAL SCIENCE
DEPARTMENT OF ECONOMICS
NATIONAL UNIVERSITY OF
SINGAPORE
2003
Acknowledgements
First of all, I would like to express my deepest gratitude to my supervisor, Professor Tse Yiu
Kuen, for his enlightening guidance and generous support throughout my two years’ study and
research at NUS. Without his direction, this thesis would never be possible.
Special thanks should be given to all my friends in Singapore, China and all other places,
Andrew Mau, Edward Xu, Hu Xiaodong, Hu Ying, Lee Chee Tong, Richard Xu and Shi Yuhua,
who have either helped me in one-way or another, or made my life meaningful. It is my honor to
get to know them. I also want to share the success of this thesis with a very special girl, Jin Yan.
She always brings me happiness and helps me out from frustration. I would like her to know that
she is invaluable to me.
Last but not least, I would like to express my sincere appreciation for what my parents have done
for me in the past 25 years. Despite the distance of thousands of miles between us, their deep
concerns through the phone line always top me up with more strength to move on. I can never
mention enough the hardships they have gone through for me. May a “Thanks” here be a small
token of gratitude.
-i-
Table of Contents
Acknowledgements
i
Table of Contents
ii
List of Figures
iv
List of Tables
v
Abstract
vii
1. Chapter One: Introductions
1
2. Chapter Two: Capital Account Liberalization
4
2.1. A Brief Introduction to the Modern Chinese Economy
4
2.2. Literature Review and the Order of Capital Account Liberalization
8
2.3. Government Fiscal Strength
12
2.4. Domestic Money and Capital Market
22
2.5. Foreign Related Economy
34
2.6. Conclusion
43
3. Chapter Three: Choice of Exchange Rate Regimes
44
3.1. Introduction
44
3.2. Literature Review
47
3.3. Economic Consideration on Choice of Exchange Rate Regimes
50
3.4. Methodology
56
- ii -
3.5. Empirical Results
59
3.6. Conclusions and Suggestions in the Case of China
68
4. Chapter Four: Currency Substitution
71
4.1. Introduction and Literature Review
71
4.2. Currency Substitution Theory and Econometric Methodology
74
4.3. Estimation Results
79
4.4. Concluding Remarks
84
5. Chapter Five: Conclusions
85
Reference
87
Appendix A: Key Events in the Liberalization Process of Selected Countries
90
Appendix B: A Brief Introduction to China’s Tax System
92
Appendix C: Exchange Rate Regime Choices for All Sample Countries
95
- iii -
List of Figures
Figure 2.1 GDP Growth Rate of China (1953-1977)
5
Figure 2.2 Balance of Government Budget (1950-2000)
12
Figure 2.3 Ratio of Revenue from Enterprises to Total Revenue (1950-1993)
13
Figure 2.4 Ration of Total Revenue to GDP (1952-2000)
13
Figure 2.5.1 Ratio of Government Balance to GDP (1) (1980-2000)
15
Figure 2.5.2 Ratio of Government Balance to GDP (2) (1980-2000)
15
Figure 2.6 Ratio of Government Revenue to GDP (1980-2000)
17
Figure 2.7 Average Bound Tariff on Industrial Products (2000)
37
Figure 2.8 Tariff and GNI Per Capita for Selected Countries (2000)
38
Figure 2.9 Ratio of Service Export to Merchandise Export (2001)
39
Figure 2.10 Ratio of Service Export to Merchandise Export vs. GNI
40
Figure 3.1 Prediction Evaluation (1990)
64
Figure 3.2 Prediction Evaluation (1995)
64
Figure 3.3 Prediction Evaluation (2000)
65
- iv -
List of Tables
Table 2.1 Major Indicators of China (1955-2000)
6
Table 2.2 Government Balance to GDP Ratio (1960-2000)
16
Table 2.3 Estimation of the GDP Impact on Revenue-GDP Ratio
18
Table 2.4 Comparison of Revenue and Expense Influence on Fiscal Balance
19
Table 2.5 M3/GDP Ratios (1975-2000)
23
Table 2.6 M3/M1 Ratios (1975-2000)
25
Table 2.7 Market Capitalizations in Selected Developing Countries (1980-2000)
26
Table 2.8 Ownership Structure of Listed Companies in Chinese Stock Exchanges
27
Table 2.9 Performances of Selected Developing Stock Markets (1980-1999)
28
Table 2.10 Turnover Ratio in Selected Developing Markets (1980-1999)
29
Table 2.11 Issuing Summary for Stocks of China (1991-2000)
30
Table 2.12 Foreign Trades of Selected Developing Countries (1975-2000)
35
Table 2.13 Foreign Reserves for Selected Developing Countries (1980-2000)
40
Table 3.1 Exchange Arrangements Evolution (1975-2000)
45
Table 3.2 Empirical Results for the Logit Model
60
Table 3.3 Signs of Explanatory Variables
61
Table 3.4 Empirical Results for the Reduced Logit Model
62
Table 3.5 Prediction Comparison
65
Table 3.6 Economic Characteristics Comparison Between China and World Average
69
-v-
Table 4.1 Augmented Dickey-Fuller Integration Tests
79
Table 4.2 OLS Estimation on Money Service Hypothesis
80
Table 4.3 Johansen Cointegration Test on MF/P, r, r*, Y*
81
Table 4.4 Error Correction Model for Money Service Hypothesis
81
Table 4.5 OLS Estimation on Portfolio Balance Hypothesis
82
Table 4.6 Johansen Cointegration Test on MF/P, r, r*, rB, x, Y*
83
Table 4.7 Error Correction Model for Portfolio Balance Hypothesis
83
- vi -
Abstract
In this thesis, three closely related issues of capital account liberalization in China have been
studied. They are the order of capital account liberalization, the choice of exchange rate regimes
and one possible side-effect of liberalization—currency substitution.
The principal argument of capital account liberalization is how to execute such policies. From
three different aspects, government finance, domestic money & capital market and the foreign
related economy, and comparing with other developing countries’ experience, we conclude that
it is still not advisable for China to take the final step—to liberalize its capital account. Based on
87 countries’ exchange rate arrangement in three separate years, a Logit model is used to
examine the determinants of choosing the appropriate exchange rate regimes. The empirical
prediction suggests China’s current fixed foreign exchange arrangement is not compatible with
its macroeconomic variables. In the last part, the issue of currency substitution is being examined
by the cointegration and error correction methodology. The empirical results indicate the
existence of currency substitution in China, thus a more precautious liberalization process should
be taken. Our study of the capital account liberalization points out some economic shortcomings
in China, and gives out some brief policy suggestions.
[Key Words]: Capital Account, China, Currency Substitution, Developing Countries,
Economic Liberalization, Exchange Rate.
- vii -
Chapter One:
Introductions
Capital account liberalization and the choice of exchange rate regimes remain the most
controversial and least understood macroeconomic policies of today, especially after the
nightmarish financial crises that hit the East Asian countries in the late 1990s. Our study
examines the intricacies of capital account liberalization and exchange rate regime choices in the
context of China, the largest developing country and the largest economy in transition.
One classical theory in international economics states that the more liberalized a capital market is,
the more efficient it will allocate capital, which in turn enhances productivity and output of the
economy. When we consider the problem of capital account liberalization, the principal
argument is not whether to liberalize the capital account, but when and how to execute such
policies (McKinnon, 1993). China has already opened its current account since 1996, and this
policy change greatly expedites foreign trade. Many economic researchers and political
observers advocate further economic liberalization in China. So the question comes to the fore. Is
the country also ready to open its capital account now? If yes, what should be the proper process?
If no, what does it still lack of? This question will be studied in this paper by comparing a set of
macroeconomic indicators of China with those of other Asian and Latin American developing
countries. The capital accounts of these nations either are open or were once open.
The choice of exchange regimes will be another critical problem immediately after capital
account liberalization. One nation will have many choices between a flexible arrangement and a
-1-
fixed arrangement. Should China continue to peg its currency to the US dollar with assumed
future free capital mobility? Is a flexible exchange rate regime a better option for China? Based
on 87 countries’ exchange rate arrangement in three separate years (1990, 1995 and 2000), a
Logit model is used to examine the determinants of choosing the appropriate exchange rate
regimes. The predictions for China are then analyzed.
One concern for full economic liberalization in developing countries is the problem of currency
substitution. It is one of the side-effects after a country removes its capital control. RamirezsRojas (1985) and Canto and Nickelsburg (1987) document this problem in some Latin American
countries. Will this happen to China too? Both economists and policy-makers in China raised
this consideration, like Jiang (1999). He estimates that the foreign currency deposits in China
only accounted for about 5 to 6 percent of the total deposits from 1993 to 1996, so he concludes
that the problem of currency substitution is not severe in China. In this study, we’ll estimate the
demand for foreign currency in China by using cointegration and error correction methodology.
All the three aspects mentioned above, namely capital account liberalization, foreign exchange
choice in an open economy and the impact of liberalization, are strung by one core economic
concept—economic liberalization. We shall not investigate them separately. Instead, a
comprehensive research is needed to understand them more precisely. This intrigues our interest
of a study on this topic.
The reminder of the thesis is organized in the following manner. Chapter 2 discusses the theory
of capital account liberalization order and its application to China. Chapter 3 provides an
-2-
empirical model on exchange arrangement determination. The problem of currency substitution
is studied in chapter 4, followed by conclusions in chapter 5.
-3-
Chapter Two:
Capital Account Liberalization
2.1. A Brief Introduction to the Modern Chinese Economy
Based on their political regimes, all socialist countries chose centrally planned economic systems,
symbolized with foreign trade barriers and frequent domestic economic interventions. The major
logic behind these policies is that a market-oriented system could cause resources waste and
income inequality in the society. In the 1950s and 1960s, the socialist countries apparently grew
very fast; in particular, technological achievements of the former Soviet Union were impressive.
However, all these countries suffered from economic stagnancy subsequently, and in the late
1980s they began to restructure their economies, either gradually or drastically.
Since the birth of the People’s Republic of China in 1949, it had experienced three decades of
centrally planned economic development. Under this repressive economic regime, all resources
and final output were distributed by the government; prices did not reflect the equilibrium
relationship of supply and demand. Little foreign trade was allowed. There was even a period of
time when domestic trade was entirely forbidden. Banks and other financial institutions were
established for the sole purpose of supporting the government’s economic plan. The central bank,
the People’s Bank of China (PBC), was only a subordinate body of the Ministry of Finance
(MOF). The central government always financed its deficit through issuing more currency.
Furthermore, at that time China was still far from establishing a capital market. There was no
securities market and treasury bonds were non-tradable.
-4-
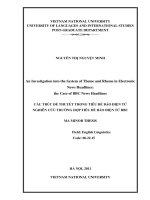
During the 1950s, China’s economic achievement was significant, especially in the first half
decade. The average annual economic growth rate for the period 1953-1959 was 11.5% (see
Figure 2.1). During the 1960s, China experienced two recessions: 1960-1962 and 1966-1968.
However, these two recessions are mainly due to political factors (i.e. Great Leap Forward for
1960-1962 and Cultural Revolution for 1966-1968).
Figure 2.1 GDP Growth Rate (In Decimal) of China (1953-1977)
Price Unadjusted*
0.25
0.2
0.15
0.1
0.05
0
-0.0553
-0.1
-0.15
-0.2
55
57
59
61
63
65
67
69
71
73
75
77
Data Source: China Statistical Yearbook (2001).
Notes: * Due to the lack of inflation indices, data in this graph are calculated at current prices,
thus the real economic growth could be lower than these figures.
Not until the end of 1978, did China find a plausible way to stimulate its economy. Since then,
China has implemented a series of the well-known ‘Reform and Open Policies’. It liberalized the
prices of commodities and services; aimed to establish an independent central bank; allowed the
firms to decide productions by themselves; established two stock exchanges 1 ; encouraged
foreign trade; and other market-oriented policies. The medicines displayed their effect soon.
China’s GDP grew from 362 billion yuan in 1978 to 8,940 billion yuan (at current prices) in
1
The two stock exchanges are Shanghai Stock Exchange (SHSE), which was opened on 19 December 1990 and
Shenzhen Stock Exchange (SZSE), which was opened on 3 July 1991.
-5-
2000 and the average annual real GDP growth rate from 1980 to 2000 was 9.66%; GDP per
capita also strikingly increased from 379 yuan to 7,078 yuan (at current prices). Foreign export
sharply mounted up to USD 267 billion in 2001, about 26 times larger than that in 1978. The
world-shaking economic achievement of China also can be showed by other figures, like direct
foreign investment (DFI). Table 2.1 summarizes some major indicators of China.
Table 2.1 Major Indicators of China (1955-2000)
GDP
GDP Per Capita Foreign Trade1
DFI2
Exchange
3
(Billion Yuan)
(Yuan)
(Billion USD)
(Billion USD)
Rate
1955
91.00
150.00
1960
145.70
218.00
2.46
1965
171.61
240.00
4.25
2.46
1970
225.27
275.00
4.59
2.46
1975
299.73
327.00
14.75
1.86
1980
451.78
460.00
38.14
1.50
1985
896.44
855.00
69.60
4.65
2.94
1990
1,854.79
1,634.00
115.44
10.29
4.78
1995
5,847.81
4,854.00
280.86
48.13
8.35
2000
8,940.36
7,078.00
474.29
59.36
8.28
Data Source: China Statistical Yearbook (2001).
Notes: 1. Sum of Export and Import.
2. Direct Foreign Investment, Total Amount of Foreign Capital Actually Used.
3. Yuan per USD, Period Average.
In 1996, China accepted Article VIII of the IMF agreement, which facilitated foreign trade—
trade companies can exchange their renminbi into foreign currencies for their trade transactions;
it also allows foreign investors to buy and sell foreign currency denominated equities (B-share
stocks in SHSE and SZSE were open to foreign investors and overseas Chinese only before
February 19, 2001; and there are also some companies listed on stock exchanges in Hong Kong,
New York and Singapore). Many scholars and businessmen expect to see a more financially
open China after its entry into WTO. Is China ready to liberalize its capital account and to allow
the full convertibility of renminbi now? If yes, what should be a proper liberalization process;
-6-
what accompanying policies should the government adopt? If no, what does China still lack of?
These are the main topics that will be discussed in this chapter.
To get a persuasive conclusion, we will compare China’s experience with those of other
developing economies to locate China’s corresponding stage in the economic liberalization
process. During last few decades, tens of developing countries have liberalized their financial
markets, and opening their capital account is regarded as one of the key steps in the process2.
Some of them enjoyed a smooth transition, while others suffered from it. In our study, we choose
ten Latin American and Asian developing countries as the benchmark of this liberalization
process. They are Argentina, Brazil, Chile, Mexico, Peru, Korea, Malaysia, Philippines,
Singapore and Thailand.
2
Appendix A reports some major changes in those countries’ liberalization process.
-7-
2.2. Literature Review and the Order of Capital Account Liberalization
Capital account liberalization remains one of the most controversial macroeconomic policy
options available to emerging market countries. Some industrial countries enjoyed a more
efficient allocation of capital, in part, due to the opening of their capital accounts. It is natural to
hypothesize that less wealthy countries can benefit even more, as capital allocation in these
countries is less efficient than that in industrial countries. However, financial crises in Asia,
Latin America and Russia have shifted the attention from when countries should liberalize to if
they should do so. In an influential article, Bhagwati (1998) states “substantial gains [from
capital account liberalization] have been asserted, not demonstrated…”. Instead, liberalization
attracts speculative hot money and the possibility of financial crises (Rodrik, 1998; Stiglitz,
2002). Thus, many empirical studies have been done on examining the cross-country effects of
capital liberalization recently. Edison et al (2002) reviews issues involved in assessing the
relationship between capital account liberalization and economic growth. They provide some
support for a positive effect of capital account liberalization on growth, especially for developing
countries. Klein (2003) finds an inverted U-shape relationship between responsiveness of growth
to capital account openness and income per capita. Middle-income countries benefit significantly
from capital account openness; and moreover neither rich nor poor countries exhibit statistically
significant positive effects. Henry (2003) finds three effects happen when emerging economies
open their stock markets to foreign investors: the cost of capital falls, capital stocks increase
more and the growth rate of output per worker rises. Thus the view that capital account
liberalization brings no real benefits seems untenable.
-8-
Johnston et al (1997) studies the experiences of capital account liberalization in Chile, Indonesia,
Korea and Thailand. Their paper focuses on the interrelationship between capital account
liberalization, domestic financial sector reforms, and the design of monetary and exchange rate
policy. It concludes that capital account liberalization should be approached as an integrated part
of comprehensive reform strategies and should be paced with the implementation of appropriated
macroeconomic and exchange rate policies.
McKinnon (1993) argues that the principal question is not whether to liberalize the capital
account, but the process of financial liberalization—how fiscal, monetary, and foreign exchange
policies are sequenced is of critical importance. Government cannot, and perhaps should not,
undertake all liberalizing measures simultaneously. Instead, there is an optimal order of
economic liberalization, which may vary for different economies depending on their initial
conditions, but some common characteristics should be highlighted. He colludes an optimum
sequencing of financial policies in the transition from centralized controls repressing domestic
and foreign trade to a full-fledged market economy.
First prerequisite is to balance the government’s finance. Before inflation can feasibly or safely
be phased out, and before the capital market is open for free borrowing and lending, the first and
most obvious need is to balance the government’s finance. Fiscal control should precede
financial liberalization. Only with a broad tax base can the government raises sufficient revenue
to avoid inflation without resorting to arbitrary ex post seizures of enterprise profits or personal
property, which result in the adverse incentive effects that currently bedevil the socialist
economies (Litwack, 1992). In former Soviet Union countries, one problem is that they
-9-
privatized those former state-owned enterprises too quickly. As the profits from those enterprises
are the major source of revenue for the governments, this rapid change greatly deteriorates the
government finance. Successful liberalizing governments must levy broadly based, but low-rate,
taxes on both enterprises and households.
The second step is to open the domestic capital market so that depositors receive, and borrowers
pay, market-determined interest rates. But unrestricted borrowing and lending among
decentralized enterprises and households can only proceed satisfactorily once the price level is
stabilized and fiscal deficits are eliminated. Without price-level stability, unpredictable volatility
in real interest rates makes unrestricted domestic borrowing and lending by deposit-taking banks
too risky. As in most transition countries, domestic interest rates are not decided by the market
mechanism, depositors often only can get negative interest rates in the real term. Thus currency
substitution could be a severe problem, just like the situation in Argentina in recent years. One
prerequisite to having a rational interest rate is to have enough independent participants in the
money and capital markets. However, the authorities should move cautiously, perhaps waiting
for some years before establishing independent commercial banks that are only indirectly
regulated by the central bank. Indeed, those former state-owned banks should deal with their bad
loans before privatization.
And the third step is to liberalize the foreign trade before the capital account liberalization.
Freeing foreign commodity trade should proceed in parallel with the decontrol of prices in the
domestic trade of goods and services. One significant symbol in less developed countries is
quotas and other direct administrative controls on exports and imports. In the optimum order of
- 10 -
liberalizing foreign trade, transitional countries may begin by converting their implicit quota
restrictions into explicit tariffs. Once formally codified, the tariffs can be reduced gradually
toward zero over a pre-announced five- or ten-year adjustment period. After this well-defined
commercial policy is in place, free currency convertibility for exporting or importing on current
account can be maintained. However, this rationalization of foreign trade policy need not warrant
extending full foreign exchange convertibility to capital-account transactions.
Only when domestic borrowing and lending take place freely at equilibrium rates of interest and
the domestic inflation is curbed so that depreciation in the exchange rate is unnecessary, are the
arbitrage conditions right for allowing free international capital mobility. Otherwise, the
premature elimination of exchange controls on foreign capital flows could lead to unwarranted
capital flight or an unwarranted build-up of foreign indebtedness or both. Thus, free foreign
exchange convertibility on capital account is usually the last stage in the optimal order of
economic liberalization.
- 11 -
2.3. Government Fiscal Strength
Based on McKinnon’s theory, only with a broad base of taxation can the government raise
sufficient revenue to avoid inflation without resorting to issuing more currency. It is not
surprising that a sound domestic fiscal environment should be reached before opening the whole
economy to a more capricious world market. If we look at the balance of China’s government
budget (see Figure 2.2), we find that along with the economic takeoff it also experienced a sharp
increase in government deficit, especially in the 1990s.
Figure 2.2 Balance of Government Budget (1950-2000)
Billion Yuan
50.00
0.00
50 53 56 59 62 65 68 71 74 77 80 83 86 89 92 95 98
-50.00
-100.00
-150.00
-200.00
-250.00
-300.00
Data Source: China Statistical Yearbook (2001).
This huge deficit was mainly caused by two reasons. One is from the source of government
revenue. Because of the privatization process of those state owned enterprises (SOE), the
Chinese government gradually lost revenue from those enterprises. From 1950-1977, an average
of 48% of total revenue came from those SOEs’ profits. But since economic reform in 1978, this
share continued to decrease until its disappearance in 1994 (Figure 2.3). Thus the government
revenue became much more relied on taxes. Due to its fragile taxation system, tax evasion in
- 12 -
China is a very severe problem. This can be shown by the total revenue to GDP ratio. Since 1978,
this ratio has gradually decreased from 31.2% to 15% in 2000 (Figure 2.4). This shows that the
government’s fiscal control has deteriorated after the economic reform.
Figure 2.3 Ratio of Revenue from Enterprises to Total Revenue
(1950-1993)
0.7
0.6
0.5
0.4
0.3
0.2
0.1
0
50
53
56
59
62
65
68
71
74
77
80
83
86
89
92
Data Source: China Statistical Yearbook (2001).
Figure 2.4 Ratio of Total Revenue to GDP (1952-2000)
Percentage
45.0
40.0
35.0
30.0
25.0
20.0
15.0
10.0
5.0
0.0
52
55 58
61 64
67 70 73 76 79
82 85
88 91 94 97
00
Data Source: China Statistical Yearbook (2001).
Another explanation of the huge deficit is the increasingly large government expenditure: the
total government expenditure in 2000 was 1,588 billion yuan, more than 14 times of that in 1978.
The government increased its expenditure mainly for two uses. One of the uses was subsidizing
- 13 -
the loss making SOEs, especially those state owned banks and other financial institutions. After
Asian financial crisis, Chinese authority realized the importance of a well-developed financial
system. To solve the bulky bad loans in the banking system, the Chinese government established
four asset management companies to take over a large part of their debts3 , and the Chinese
government recapitalized the four major banks, through issuance of treasury bond of 270 billion
yuan, raising their capital adequacy ratio to 8 per cent4. This was a heavy burden to the central
government. Another use of the government expenditure was to invest in infrastructure. Because
of deflation and low domestic consumption, the government wanted to stimulate the economy by
increasing government investment. In the past few years, China started several big construction
projects, including the Three Gorges Project, which will solely cost more than 200 billion yuan
in the next 20 years. From 1978 to 2000, the annual growth rate of government expenditure was
one per cent higher than the government revenue. This actually answers why the deficit was
widening.
Government deficit is not a unique problem for China, other countries also have budget deficits
(see Table 2.2). In the past 20 years, of all the countries examined only Singapore and Chile,
which are usually referred as paragons in economic development in Asia and Latin America
respectively5, have surplus on average (see Figure 2.5.1, 2.5.2 and Table 2.2).
3
No precise figure has been reported, but a widely acceptable estimate is more than 3,000 billion yuan, that is 25%
of banks’ total assets. For instance, “According to conservative estimation, the proportion of non-performing-loans
is now above 30 per cent”. (Huang, 1999)
4
The average capital adequacy ratio of the four pillar state-owned-banks in China was only 4.4 per cent by the end
of 1999, lower than 8 per cent required by the Bank of International Settlement and China's own commercial bank
law. (Huang, 1999)
5
If we spread the time span to all years when data are available, then only Singapore has positive average.
- 14 -
Figure 2.5.1 Ratio of Government Balance to GDP (1) (1980-2000)
(China and Latin American Countries, In Percentage)
10.00
5.00
China
0.00
Argentina
80 81 82 83 84 85 86 87 88 89 90 91 92 93 94 95 96 97 98 99 00
-5.00
Chile
Mexico
-10.00
Peru
-15.00
-20.00
Data Source: International Financial Statistics, IMF (2001)
Figure 2.5.2 Ratio of Government Balance to GDP (2) (1980-2000)
(China and Asian Countries, In Percentage)
20.00
15.00
10.00
China
Korea
5.00
Malaysia
0.00
-5.00
80 81 82 83 84 85 86 87 88 89 90 91 92 93 94 95 96 97 98 99 00
-10.00
Philippines
Singapore
Thailand
-15.00
-20.00
Data Source: International Financial Statistics, IMF (2001)
- 15 -
Table 2.2 Government Balance to GDP Ratio (1960-2000)
In Percentage
Country
China
Argentina
Chile
Mexico
Peru
Korea
Malaysia
Philippines
Singapore
Thailand
1960
0.99
1.93
0.06
0.13
1965
-0.14
-5.45
-1.29
-2.71
-0.62
1970
-0.77
-3.91
0.14
3.46
-3.67
1975
1980
-2.80
0.14
5.41
-3.04
1985
0.25
-5.27
-2.29
-7.55
-1.97
-8.51
-1.19
2.12
-2.44
-2.25
-6.95
-1.39
0.39
-3.87
-1.16
-5.68
-1.95
1.53
-3.69
1990
-0.80
-0.33
0.80
-2.69
-8.10
-0.68
-2.89
-3.45
9.77
4.90
1995
-0.99
-0.55
2.58
-0.53
-1.12
0.27
0.84
0.58
13.48
3.22
2000
-2.79
-2.40
0.14
-1.26
-2.01
-4.12
11.32
-2.20
Avg. 80-00
-1.04
-2.12
0.79
-4.12
-2.31
-0.70
-4.50
-2.12
7.35
-0.35
Data Source: International Financial Statistics, IMF (2001)
Notes: Negative values stand for deficit, and positive means surplus.
Compared with other countries, China’s 20-year average deficit-to-GDP ratio is still moderate.
But more attention should be paid to the trend of this series. Chinese government successfully
maintained a balanced budget before 1990, but since then it has quickly deteriorated (some
plausible explanations of this change were mentioned).
Fiscal balance is the combined results of two sides: government revenue and expense. To
precisely understand those deficit numbers, we should diagnose the problem from both sides.
Revenue-to-GDP ratio has frequently been looked as a criterion of the government fiscal power.
Then, how is China’s government fiscal strength, compared with other major developing
countries in Latin America and Asia? Figure 2.6 clearly shows that Chinese government’s
revenue as a percentage of the economy is below most of other 9 countries (Brazil is excluded
due to a lack of data) for the period of 1980-2000. China’s tax system is not well established yet6.
The share of government revenue partly reflects fiscal policy effectiveness. It is not surprising to
6
See some introductions of China’s tax system in Appendix B.
- 16 -
find that Latin American countries’ revenue-GDP ratios were relatively lower than those of their
Asian counterparts, and this is in line with their debt problems in the 80s and 90s.
Figure 2.6 Ratio of Government Revenue to GDP (1980-2000)
Percentage
50.00
45.00
40.00
China
Argentina
Chile
Mexico
Peru
Korea
Malaysia
Philippines
Singapore
Thailand
35.00
30.00
25.00
20.00
15.00
10.00
5.00
0.00
80 81 82 83 84 85 86 87 88 89 90 91 92 93 94 95 96 97 98 99 00
Data Source: International Financial Statistics, IMF (2001)
One interesting phenomenon is that in many developing countries, the ratio of government
revenue to output is decreasing during its quick expanding period, which means revenue
increases lag the whole economy. This can be examined by a simple regression.
(2.1)
REVit = C i + ai GDPit
where REVit is country i’s ratio of government revenue to GDP in the year t;
C is a constant;
and GDPit is country i’s gross domestic products in year t.
Parameter a captures the effect of GDP’s change on government revenue: if it is negative, we
can say the government’s fiscal influence deteriorates when the economy expands. Below are the
results for some selected countries.
- 17 -