Cooling effects of water body in hot and humid climate
Bạn đang xem bản rút gọn của tài liệu. Xem và tải ngay bản đầy đủ của tài liệu tại đây (1.8 MB, 136 trang )
COOLING EFFECTS OF WATER BODY IN HOT AND HUMID CLIMATE
ANDRITA DYAH SINTA NINDYANI
(BACHELOR OF ARCHITECTURE, GADJAH MADA UNIVERSITY)
A THESIS SUBMITTED FOR THE DEGREE OF MASTER OF SCIENCE
(BUILDING)
DEPARTMENT OF BUILDING
NATIONAL UNIVERSITY OF SINGAPORE
2012
DECLARATION
I hereby declare that this thesis is my original work and it has been written by me in its
entirety.
I have duly acknowledged all the sources of information which have been used in the
thesis.
This thesis has also not been submitted for any degree in any university previously.
_________________________
Andrita Dyah Sinta Nindyani
7 December 2012
ii
ACKNOWLEDGEMENTS
“I can do all things through Christ who strengthen me” (Phillipians 4:13).
Thank you dear Father Jesus Christ for my life. Thank you for the faith. I am able to finish
this thesis through You who gives me strength. I love you.
I owe an enormous debt of gratitude to Professor Wong Nyuk Hien, whose depth of
knowledge and immense wisdom greatly aided my scholarly development. He provided a
patient and critical eye on my ideas, analyses and writing – I am very thankful for that, and
more. Many thanks are also due for Steve Kardinal Jusuf, for his comments and critiques
while I was planning and writing up my research for this thesis.
During my time in NUS, I received support, encouragement and assistance of various kinds
from very many friends and colleagues in graduate school. To me, you guys have been
fantastic sounding boards for ideas. Unfortunately, naming all of you is an impossible task;
but do know that I would have never been able to complete this demanding and timeconsuming thesis without your help. I have to specifically mention that Nedyomukti Imam
Syafii, Erna Tan, Rosita Samsudin, Religiana Hendarti, Enrica Rinintya, Leni Sagita
Supriadi, and Bayu Aditiya Firmansyah were all directly involved in assisting my research
at one point or another, for which I am deeply grateful.
The final words of gratitude are for the people who know me best, and who have stuck with
me throughout my academic accomplishments in a foreign land. To my dear parent, Papi
iii
Nindyo Suwarno, and Mami Dewi Rindjani – thank you for all the pray, support, help,
patience, and believe despite being thousands miles away. I am gratefully proud to be your
daughter. I love you both. Lastly, to my Husband Antonius Aditiyo Wibisono and Son
Dominik Jonathan Pratama – thank you for keeping me grounded, and for giving me a
reason to believe. I love you both.
iv
TABLE OF CONTENTS
DECLARATION…………..………………………………………………………………..ii
ACKNOWLEDGMENTS...………………………………………………………………..iii
TABLE OF CONTENTS ....................................................................................................... v
EXECUTIVE SUMMARY................................................................................................. viii
LIST OF TABLES ................................................................................................................. x
LIST OF FIGURES .............................................................................................................. xi
CHAPTER 1 INTRODUCTION ........................................................................................... 1
1.1
Background ............................................................................................................. 1
1.2
Research Questions ................................................................................................. 4
1.3
Research Objectives ................................................................................................ 4
1.4
Scope of the Study and General Methodology ........................................................ 4
1.5
Contributions of the Study ...................................................................................... 7
1.6
Organization of the Study........................................................................................ 7
CHAPTER 2 LITERATURE REVIEW ................................................................................ 9
2.1
Climate of Singapore ............................................................................................... 9
2.2
Solar Radiation ...................................................................................................... 10
2.3
The Hydrologic Cycle (Water Cycle): Evaporation .............................................. 11
2.4
Wind ...................................................................................................................... 12
2.5
Water Bodies and Their Effect on Air Temperatures in Sub-Tropic Areas .......... 14
2.6
Water Facilities and Their Effect on the Surrounding Microclimate .................... 16
2.6.1
Water Facilities and Their Effect in Sub-Tropic Areas ................................. 16
2.6.2
Water Facilities and Their Effect in Singapore .............................................. 18
2.6.3
Water Facilities and Their Effect through Simulation Study ......................... 20
2.7
Green Area Studies in Singapore .......................................................................... 21
2.8
ENVI-met Simulation............................................................................................ 23
2.9
Validation and Sensitive Analysis of ENVI-met Simulation ................................ 24
v
2.10
Simulation Limitations .......................................................................................... 24
2.11
Knowledge Gap ..................................................................................................... 25
2.12
Hypothesis Development ...................................................................................... 27
CHAPTER 3 RESEARCH METHODOLOGY .................................................................. 29
3.1
Research Design .................................................................................................... 29
3.2
Selection of Water Bodies ..................................................................................... 29
3.2.1
Kallang River ................................................................................................. 29
3.2.2
Sungei Api-api River...................................................................................... 30
3.2.3
Marina Bay ..................................................................................................... 31
3.2.4
Bedok Reservoir ............................................................................................. 32
3.3
Instruments Used ................................................................................................... 33
3.4
Data selection ........................................................................................................ 35
3.5
Method of Data Collection .................................................................................... 37
3.6
Data Processing ..................................................................................................... 37
3.7
Method of Analysis ............................................................................................... 38
3.8
Point Location of Experiment ............................................................................... 39
3.8.1
Kallang River ................................................................................................. 39
3.8.2
Sungei Api-api River...................................................................................... 39
3.8.3
Marina Bay Promenade and Marina Bay Promontory ................................... 40
3.8.4
Bedok Reservoir ............................................................................................. 41
3.9
ENVI-met Simulation............................................................................................ 42
3.9.1
Simulation Procedure in ENVI-met ............................................................... 43
3.9.2
Simulation Boundary Condition .................................................................... 44
CHAPTER 4 OBJECTIVE DATA ANALYSIS ................................................................. 45
4.1
A Comparison of Four Measurements in Regard to the Distance ......................... 45
4.1.1
Away from the Water Bodies (Clear Days) ................................................... 46
4.1.2
Away from the Water Bodies (Cloudy Days) ................................................ 49
4.1.3
Along the Water Bodies (Clear Days) ........................................................... 50
4.1.4
Distance Effect with Polynomial Regression ................................................. 52
vi
4.2
4.1.4.1
Kallang River and Sungei Api-api River ................................................. 52
4.1.4.2
Marina Bay and Bedok Reservoir ............................................................ 54
Solar Radiation Effect on Water Bodies Cooling Performance ............................ 56
4.2.1
Kallang River ................................................................................................. 56
4.2.2
Sungei Api-api River...................................................................................... 59
4.2.3
Bedok Reservoir ............................................................................................. 63
4.2.4
Marina Bay ..................................................................................................... 65
4.2.5
Solar Radiation Effect with Linear Regression .............................................. 69
4.3
Overall Field Measurement Findings .................................................................... 70
4.3.1
Additional Findings ........................................................................................ 71
CHAPTER 5 ENVI-met SIMULATION ANAYLSIS ........................................................ 75
5.1
Simulation Validation............................................................................................ 75
5.2
Scenario 1: Kallang River Real Condition ............................................................ 76
5.3
Scenario 2: Kallang River with a Wider Waterway .............................................. 84
5.4
Scenario 3: Kallang River with Wind Speed of 2m/s ........................................... 89
5.5
Scenario 4: Kallang River with All Grass Covered Microclimate ........................ 95
5.6
Scenario 5: Kallang River with All Pavement Covered Microclimate ................. 99
5.7
Overall Simulation Findings ............................................................................... 105
CHAPTER 6 SUMMARY AND CONCLUSION ............................................................ 108
6.1
Summary and Conclusion ................................................................................... 108
6.2
Limitations of the Study ...................................................................................... 112
6.3
Recommendations for Future Work .................................................................... 113
BIBILOGRAPHY .............................................................................................................. 115
APPENDIX A .................................................................................................................... 122
vii
EXECUTIVE SUMMARY
Water bodies are known to be about the best absorbers of radiation, yet they exhibit very
little thermal response. A study in sub-tropic regions found a difference of approximately
3–5°C in air temperature between the river and the city area. The water bodies of the river
operate as a cooling source on the microclimate of the surrounding area. Air temperature
near or over bodies of water is much different from that over land due to differences in the
way water heats and cools. In Singapore, water features within an urban area have a
positive effect on the microclimate of the surrounding areas when natural cooling from the
evaporative process is needed on a hot sunny day. The increased availability of water
usually enhances evaporation, and the associated uptake of latent heat provides a daytime
cooling effect. Many other researchers have argued that evaporative cooling from water
bodies or water features is one of the most efficient ways to ensure the passive cooling of
building and urban spaces. However, evaporative cooling might not work optimally in a
hot, humid tropical country as it has high relative humidity. Research on the mitigation
plans has been widespread, demonstrating that having more greenery is an efficient
measure for curbing urban heat islands. Although studies have also mentioned that having
more water surfaces could improve the urban heat island effect, this possibility has received
comparatively less attention.
In this research, four water bodies in Singapore, the Kallang River, Sungei Api-Api River,
Marina Bay, and Bedok Reservoir, were looked into as an effective measurement of the
waterways’ evaporative cooling performance fort the surrounding microclimate, especially
viii
in hot and humid climates. Air temperature, relative humidity, wind velocity, and solar
radiation are continuously measured for the collective data and analyzed for the clearest
day of the measurement. A field measurement was conducted for five months, from May to
September 2010, for Kallang and Sungei Api-api Rivers and for another five months,
February to June 2012, for Marina Bay and Bedok Reservoir. Based on solar radiation
performance during the daytime, in order to observe the extent of its cooling effect from the
waterway, there are measurement points for each location. Some points of measurement are
located along the waterway while other points are located moving away from the waterway.
In order to study the water bodies’ cooling effect unable to be investigated using the field
measurements, an ENVI-met simulation study was conducted. Five scenarios are simulated
to investigate the temperature profile of each scenario. A parametric study, which cross
references the results obtained from the investigation and boundary data, was performed to
observe the impact of the cooling effect for each scenario.
These research results support the hypothesis that the four water bodies in Singapore and
the simulation study have similar results. On a clear day with enough solar radiation,
temperatures in surrounding area increase by 0.15 to 0.20oC approximately 20–30 meters
away from the water bodies.
ix
LIST OF TABLES
Table 1: Data selection ......................................................................................................... 36
Table 2: Basic input parameters to the ENVI-met model .................................................... 44
x
LIST OF FIGURES
Figure 1.1: Research Methodologies...................................................................................... 6
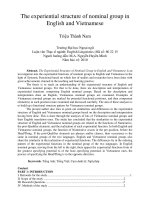
Figure 2.1: Illustration of the hydrologic cycle .................................................................... 11
Figure 3.1: Kallang Basin .................................................................................................... 30
Figure 3.2: Sungei Api-api River ......................................................................................... 31
Figure 3.3: Marina Bay ........................................................................................................ 31
Figure 3.4: Bedok Reservoir ................................................................................................ 32
Figure 3.5: Weather station .................................................................................................. 34
Figure 3.6: Hobo Data Logger ............................................................................................. 35
Figure 3.7: Points located along the Kallang waterway....................................................... 39
Figure 3.8: Points located along the Sungei Api-api waterway ........................................... 39
Figure 3.9: Points located along the Marina Bay Promenade points MP1 – MP5 .............. 40
Figure 3.10: Points located along the Marina Bay Promenade points MP6 – MP8 ............ 40
Figure 3.11: Points located away the Marina Bay Promontory ........................................... 41
Figure 3.12: Points located away the Bedok Reservoir ....................................................... 41
Figure 4.1: Comparison of daytime average temperature (clear days) at points at a distance
from the four water bodies .............................................................................. 46
Figure 4.2: Comparison of daytime average temperature (cloudy days) at points at a
distance from the four water bodies ................................................................ 50
Figure 4.3: Comparison of daytime average temperature (clear days) at points along the
water bodies ................................................................................................... 51
Figure 4.4: Correlation between temperature reduction and distance at Kallang ................ 53
Figure 4.5: Correlation between temperature reduction and distance at Sungei Api-api .... 53
Figure 4.6: Correlation between temperature reduction and distance at Marina Bay .......... 54
Figure 4.7: Correlation between temperature reduction and distance at Bedok Reservoir .. 55
Figure 4.8: Comparison of diurnal average temperatures (clear days) at points away from
the Kallang waterway ..................................................................................... 56
Figure 4.9: Diurnal average temperatures (clear days) at points along the Kallang waterway
........................................................................................................................ 56
xi
Figure 4.10: Comparison of diurnal average temperatures (cloudy days) at points away
from the Kallang waterway............................................................................. 57
Figure 4.11: Comparison of diurnal average temperature (clear days) at points along the
Kallang waterway with solar radiation ........................................................... 58
Figure 4.12: Comparison of diurnal average temperatures (clear days) at points away from
the Sungei Api-api River ................................................................................ 60
Figure 4.13: Comparison of diurnal average temperatures (cloudy days) at points away
from the Sungei Api-api River........................................................................ 60
Figure 4.14: Diurnal average temperatures (clear days) at points along the Sungei Api-api
waterway and the beach .................................................................................. 61
Figure 4.15: Comparison of diurnal average temperature (clear days) at points along the
Sungei Api-api waterway with solar radiation ............................................... 62
Figure 4.16: Comparison of diurnal average temperature (clear days) at points along the
Bedok Reservoir with solar radiation ............................................................. 63
Figure 4.17: Diurnal average temperatures (cloudy days) at points away from the Bedok
Reservoir ......................................................................................................... 64
Figure 4.18: Comparison of diurnal average temperatures (clear days) at points away from
the Marina Bay................................................................................................ 65
Figure 4.19: Comparison of diurnal average temperatures (clear days) at points along
Marina Bay ..................................................................................................... 66
Figure 4.20: Diurnal average temperatures (cloudy days) at points away from Marina Bay
........................................................................................................................ 67
Figure 4.21: Comparison of diurnal average temperature (clear days) at points along Marina
Bay with solar radiation .................................................................................. 68
Figure 4.22: Correlation between temperature reduction and solar radiation ...................... 70
Figure 4.23: Comparison between temperature and relative humidity along the waterway 72
Figure 4.24: Comparison between temperature and relative humidity away from the
waterway ......................................................................................................... 73
Figure 4.25: Correlation between avverage relative humidity and average temperature on
clear days in Kallang....................................................................................... 73
xii
Figure 5.1: Comparison of diurnal average temperature of field measurement and
simulation on Kallang River ........................................................................... 75
Figure 5.2: Temperature profile of Kallang River at 10:00 a.m .......................................... 78
Figure 5.3: Temperature profile in Kallang River at 1:00 p.m ............................................ 79
Figure 5.4: Temperature profile in Kallang River at 5:00 p.m ............................................ 81
Figure 5.5: Comparison of diurnal average temperatures of Kallang River at three times . 82
Figure 5.6: Temperature profile of Kallang River with a wider river width at 10:00 a.m ... 85
Figure 5.7: Temperature profile of Kallang River with a wider river width at 1:00 p.m .... 86
Figure 5.8: Temperature profile of Kallang River with a wider river width at 5:00 p.m .... 87
Figure 5.9: Comparison of diurnal average temperature of real condition and wider river on
Kallang ............................................................................................................ 88
Figure 5.10: Temperature profile of Kallang River with wind speed 2m/s at 10:00 a.m .... 90
Figure 5.11: Temperature profile of Kallang River with wind speed 2m/s at 1:00 p.m ...... 91
Figure 5.12: Temperature profile of Kallang River with wind speed 2m/s at 5:00 p.m ...... 93
Figure 5.13: Comparison of diurnal average temperature of Kallang real condition with
2m/s wind speed.............................................................................................. 94
Figure 5.14: Temperature profile of Kallang River with all grass surrounding cover at 10:00
a.m................................................................................................................... 96
Figure 5.15: Temperature profile of Kallang River with all grass surrounding cover at 1:00
p.m .................................................................................................................. 97
Figure 5.16: Temperature profile of Kallang River with all grass surrounding cover at 5:00
p.m .................................................................................................................. 98
Figure 5.17: Temperature profile of Kallang River with all pavement surrounding cover at
10:00 a.m ...................................................................................................... 100
Figure 5.18: Temperature profile of Kallang River with all pavement surrounding cover at
1:00 p.m ........................................................................................................ 101
Figure 5.19: Temperature profile of Kallang River with all pavement surrounding cover at
5:00 p.m ........................................................................................................ 102
Figure 5.20: Comparison of diurnal average temperature of Kallang River with different
surrounding cover at 10:00 a.m .................................................................... 103
xiii
Figure 5.21: Comparison of diurnal average temperature of Kallang River with different
surrounding cover at 1:00 p.m ...................................................................... 104
Figure 5.22: Comparison of diurnal average temperature of Kallang River with different
surrounding cover at 5:00 p.m ...................................................................... 105
xiv
CHAPTER 1
1.1
INTRODUCTION
Background
Urban heat islands (UHIs) have created serious environmental problems all over the world,
where differential heating is registered in urban areas unlike rural surroundings. The
concept of UHI, proposed by Manley (1958), stated that—when a city has expanded
enough to change the properties of the underlying surface to suffer from serious air
pollution and release substantial waste heat—the urban temperature is considerably higher
compared to the rural system, thereby generating the thermal isolated island. The
occurrence of UHI can be attributed to mainly manmade surroundings; however, the
amount of heat released is dependable on the prevailing natural environmental conditions
(Memon et al., 2008).
The phenomenon of the UHI effect is has affected the long-term trends of mean
temperature and the rise of both day- and night-time temperatures (Memon et al., 2008).
According to Santamouris et al. (2001), the heat island’s intensity can result in up to 10 K
temperature differences between dense urban areas and the surrounding rural zones. The
negative effect in especially hot and humid countries has resulted in an increase of energy
consumption associated with the need for air conditioning (Ca et al., 1998), elevation in
ground-level ozone (Rosenfeld et al., 1998), deterioration in the quality of living
environments with a significant increase of pollutant emissions and smog production
(Santamouris and Mihalakakou, 2000), decrease in human comfort, and even an increase in
mortality rates (Changnon et al., 1996; Ichinose et al., 2008).
1
Many studies have shown that the mitigation of UHI measures, such as increasing the
quantity of vegetation cover, might alter the severe impact of urbanization. The vegetation
provides a cooling effect, mainly through its shadowing effect and evapotranspiration
process. The process is basically a natural mechanism in which heat is removed by
changing the heat from sensible heat to latent heat. A similar process happens over water
bodies with the help of solar radiation. This process is known as evaporative cooling. When
solar radiation from the sun reaches the water’s surface, the water will vaporize and remove
the heat, thereby cooling the surrounding air.
Water features within an urban area have a positive effect on the microclimate of the
surrounding areas when natural cooling from the evaporative process is needed on hot
sunny days. The increased availability of water usually enhances evaporation, and the
related uptake of latent heat provides an additional daytime cooling effect. The air
temperature near or over bodies of water is much different from that over land due to
differences in the way water heats and cools. Water bodies are noted to be about the best
absorbers of radiation; on the other hand, they exhibit very little thermal response. Many
other researchers have argued that evaporative cooling from water bodies or water features
is one of the most efficient ways to passively cool building and urban spaces. However,
evaporative cooling might not work optimally in a hot, humid tropical country with high
relative humidity.
The lack of response can be attributed to four characteristics (Oke, 1987):
2
Penetration: as water allows short-wave radiation transmission to considerable
depths, energy absorption is diffused through a large volume.
Mixing: the existence of convection and mass transport by fluid motion also permits
the heat gains/losses to be spread throughout a large volume.
Evaporation: unlimited water availability provides an efficient latent heat sink, and
evaporative cooling tends to destabilize the surface layer and further enhance
mixing.
Thermal capacity: the thermal capacity of water is exceptionally large; therefore, it
requires about three times as much heat to raise a unit volume of water through the
same temperature interval as most soil.
These properties make the surface temperature of water bodies cooler than that over the
land. A cooler surface results in a cooler air temperature above the water. A study by
Murakawa (1990) showed a difference of approximately 3–5°C in air temperature between
the river and the city area in Japan. The water bodies of the river operate as a cooling
source on the microclimate of the surrounding area. Many other researchers have argued
that evaporative cooling from water bodies or water features is one of the most efficient
ways to provide passive cooling for building and urban spaces (Krüger, 2008; Adebayo,
1991). Thus, the current study examines this evaporative cooling performance of water
bodies for the surrounding microclimate of Singapore. Ambient air temperatures are
measured to make a clear distinction of the influence of cooling from the water bodies
horizontally.
3
1.2
Research Question
1.
How is solar radiation affecting the cooling effect of water bodies in the tropics,
especially Singapore?
2.
How do water bodies in hot and humid climates extend the cooling effect to the
surrounding area in terms of distance?
3.
How does the surrounding area impact the cooling effect performance of water bodies,
as determined using a simulation model?
1.3
Research Objectives
The objectives of the study are as follows:
1. To determine the cooling effect and benefit of water bodies to their surrounding
microclimate in hot and humid climates (field measurement study).
2. To determine the possible impact of water bodies’ cooling effect on the air
temperature on a hot sunny day (field measurement study).
3. To identify different types of surrounding areas near the water bodies in order to
investigate their impacts on the water bodies’ cooling effect (parametric study
using an ENVI-met simulation).
1.4
Scope of the Study and General Methodology
The scope of this research is focused on:
1.
Water bodies’ cooling effect performance in terms of distance in several
locations in Singapore based on solar radiation performance; and
4
2.
The use of field measurement method and ENVI-met simulations to study the
effect of a water body’s surrounding area cover on the cooling performance on a
hot sunny day; but
3.
No mean radiant temperature (MRT) reading was used as this research is not
focused on human thermal comfort.
Figure 1.1 shows the general methodology of this study. The process started with a
preliminary literature review, focusing on UHI, the water cycle, and the variables that affect
the water’s evaporation process to create a cooling performance on its surroundings. Water
bodies in sub-tropic areas seem to have a significant cooling effect amount. On the other
hand, Singapore, with its hot and humid climate, seeks to achieve the same effect. Some
researchers in Singapore have measured water facilities such as water walls, fountains, and
ponds. They found that evaporation from the water facilities could help reduce the
surrounding heat. Hence, the aim of the study is to determine the cooling effect of water
bodies (rivers, bays, and reservoirs) on a larger scale in Singapore. Field measurements and
an ENVI-met simulation were conducted to determine the water bodies’ cooling effect
performance.
5
Preliminary literature review
Formulation of research problem
In-depth literature review
Design of research
Field Measurement
study
Simulation study with
ENVI-met
Data measurement and
collection
Modeling and running
simulation
Data analysis using
EXCEL
Extract data for ENVImet using LEONARDO
Research findings
Simulation findings
Recommendations
Thesis report
Figure 1.1 Research Methodologies
6
Generate
hypothesis
1.5
Contribution of the Study
These findings could be used to understand the extent of water bodies’ cooling effect on the
surroundings area in hot and humid climates based on solar radiation performance. In
addition, through simulation study, the findings could be used to determine how the
surroundings near the water bodies affect the water bodies’ cooling effect performance.
1.6
Organization of Study
This thesis paper will be organized as follows:
Chapter 1 provides an introduction to the background and rationale of this study. A brief
outline of the research paper is provided.
Chapter 2 presents an extensive literature review on past research and papers done in
relation to the cooling effect of water features in Singapore (a hot and humid climate). The
literature on the water evaporation process and factors that affect it to produce water
bodies’ cooling effect, such as solar radiation and wind speed, are also described.
Chapter 3 introduces the research methodology used in this study. An account of the
measurement instruments deployed and the parameters measured will be included in the
chapter. It also covers the methodology of the ENVI-met simulation program to conduct
simulations in water bodies’ areas in Singapore regions.
Chapter 4 delivers the analyses of water bodies’ cooling effect based on solar radiation
performance using data collected from four field measurements in Singapore’s water
bodies’ areas. It further discusses the distance effect based on clear days at the study cases.
7
Chapter 5 produces the simulation outcome of the water bodies by conducting an ENVImet simulation on the Kallang River in Singapore to analyze how much the water cooling
effect might vary on a hot sunny day in the region as it refers to real conditions on site.
Chapter 6 puts forward a summary of the issues, in which the conclusions from the
analyses will be established. It also discusses the limitations of this study and suggests
recommendations for future works.
8
CHAPTER 2
2.1
LITERATURE REVIEW
Climate of Singapore
Based on National Environmental Agency (NEA) Meteorological Services, Singapore, with
an area of approximately 710.2 km2, is located in the tropics surrounded by sea (lies at 15
meters sea level) and has fairly high humidity. The climate is characterized by a uniformity
of temperature, pressure, high relative humidity (RH), and heavy rainfall. Singapore is
influenced by the sea based on its geographical location and maritime exposure. The sea
breeze is a steady wind that blows inland during the day from the sea, carrying humidity.
Singapore has a stable climate condition, with temperatures varying from 22°C to 34°C and
average RH of 85%–90% in the morning and 55%– 60% during the daytime. On a rainy
day, the RH could easily reach 100%. June and July are the hottest months of the year, and
November and December are considered as the rainy season. Generally, due to Singapore's
geographic location (i.e., close to the equator), Singapore has warm weather conditions
with relatively high RH.
Located between latitudes 1 degree 09’N and 1 degree 29’N and longitudes 103 degree
36’E and 104 degree 25’E, Singapore can be classified as having a hot humid climate.
Uniform high temperatures, humidity, and rainfall throughout the year characterize the
climate. The diurnal temperature variations are small, ranging from 23 to 26°C and 31 to
34°C. The mean annual temperature was 27.4oC between 1982 and 2001.
Relative humidity is generally high and, although it invariably exceeds 90% in the early
hours of the morning just before sunrise, it frequently falls to 60% during the afternoons
9
when there is no rain. During prolonged heavy rains, relative humidity often reaches 100%.
The mean annual relative humidity is 84.2%.
There are two main seasons in Singapore, the northeast (NE) monsoon and the southwest
(SW) monsoon seasons. The NE monsoon occurs between November and early March,
with the prevailing wind blowing from the north to northeast. Meanwhile, the SW monsoon
occurs between June and September, with the prevailing wind blowing from the south to
southwest. Two short inter-monsoon periods lasting two months separate the main seasons.
There is no clear distinct wet or dry season as rainfall occurs throughout the year. However,
the NE monsoon season is considered to be wet weather as the wind is generally cool and
brings frequent spells of wet weather, accounting for about 48% of the total annual rainfall.
On the other hand, the SW monsoon wind brings about 36% of the total annual rainfall.
2.2
Solar Radiation
Solar radiation is a radiant energy derived from thermonuclear processes occurring in the
sun. Solar radiation controls the climate conditions on earth and varies at different latitudes
(Kiehl, 1992). This is mainly due to differences in solar radiation that reaches the surface.
The distribution of solar radiation is generally larger at low altitudes and much less nearer
the poles. This imbalance in the net radiation for the surface and the atmosphere system as
a whole (positive in lower altitudes and negative in higher altitudes) combined with the
effect of the earth’s rotation on its axis produces the dynamic circulation system of the
atmosphere (Henderson-Sellers and McGuffie, 1987).
As previously mentioned, the most influential factor for determining the climatic conditions
on earth is solar radiation. According to an earth energy budget by Schneider (1992), 45%
10
of incoming solar radiation is absorbed by the surface of the planet, 25% by the
atmosphere, and 23% is reflected by the atmosphere.
2.3
The Hydrologic Cycle (Water Cycle): Evaporation
Figure 2.1 Illustration of the hydrologic cycle.
Source: National Weather Service, NOAA (www.srh.noaa.gov/jetstream//atmos/hydrocycle_max.htm)
The hydrologic cycle, or the water cycle, as seen in figure 2.1 is the continuous cycling of
water through the atmosphere, ocean, land surface, and biosphere. The hydrologic cycle is
mainly driven by energy from the sun. The major reservoirs of water on Earth include
oceans, lakes, rivers, wetlands, land, and seas. Water can move through several different
processes—namely, evaporation, precipitation, melting, and running downhill in rivers or
underground. Evaporation is the process by which water gradually changes from a liquid to
a gas or vapor at a significant volume. Evaporation is the primary pathway that water
11