Dissecting gene regulatory networks in vertebrate development using genomic and proteomic approaches
Bạn đang xem bản rút gọn của tài liệu. Xem và tải ngay bản đầy đủ của tài liệu tại đây (9.05 MB, 150 trang )
DISSECTING GENE REGULATORY NETWORKS IN
VERTEBRATE DEVELOPMENT USING GENOMIC AND
PROTEOMIC APPROACHES
VISHNU RAMASUBRAMANIAN
A THESIS SUBMITTED
FOR THE
DEGREE OF MASTER OF SCIENCE
DEPARTMENT OF BIOLOGICAL SCIENCES
NATIONAL UNIVERSITY OF SINGAPORE
2009
TABLE OF CONTENTS
Title
Page No
ACKNOWLEDGMENT
i
ABSTRACT
ii
MY CONTRIBUTIONS
v
ABBREVIATIONS
vii
LIST OF TABLES
ix
LIST OF FIGURES
xi
CHAPTER 1
INTRODUCTION
1
1.1
Gene regulatory networks in development
1
CHAPTER 2
NOVEL APPROACHES TO STUDY CELL TYPE
SPECIFICATION
7
2.1
Technology development
13
2.2
Preliminary testing of the technology
18
2.2.1
Results and Discussion
19
2.3
Analysis of main dataset
23
2.3.1
Differential expression analysis
23
2..3.2
Sample information and preprocessing
25
2.3.3
Differential expression at E13.5
29
2.3.4
The time effect
36
2.3.5
Discussion
42
CHAPTER 3
IDENTIFICATION OF ENHANCERS
Dlx5/Dlx6 BI-GENE CLUSTER
FOR
44
3.1
Can you tell me where the switch is?
44
3.2
Identification of enhancers for Dlx5/Dlx6 bi-gene cluster
46
3.3
Methods
54
3.4
Results & Discussion
56
CHAPTER 4
EPITOPE TAGGING OF OCT4 FOR MAPPING
PLURIPOTENCY NETWORK
68
4.1
Introduction
68
4.2.1
Methods and Results
74
4.2.2
Screening results for Oct4-2xflag-TEV-BAP
78
4.2.3
Screening results for Oct4-pre-flag-TEV-BAP
81
4.3
Discussion
85
87
REFRENCES
APPENDICES
A_2.1
Protocol for purification of total RNA from sorted cells
using Qiagen RNeasy mini kit
FA
A.2.2
R code used for analyzing E13.5 Sox9 microarray data
set
FA
A.2.3
R code used for analyzing the time effect
FA
A.2.4
List of top 200 differentially expressed genes in E13.5
Sox9+/+ vs Sox9-/-
FA
A.2.5
List of top 200 differentially expressed genes in E13.5
Sox9+/- vs Sox9-/-
FA
A.2.6
List of top 200 differentially expressed genes in E13.5
Sox9+/+ vs Sox9+/-
FA
A.2.7
List of differentially expressed genes in E13.5 Sox9+/+ vs
E12.5 Sox9+/+
FA
FA
A.2.9
List of differentially expressed genes in E13.5 Sox9 +/- vs
E12.5 Sox9 +/List of genes that are differentially expressed between
Sox9+/+ and Sox9+/- and between the two time points
E13.5 and E12.5
A.2.10
Illumina total prep RNA amplification protocol
FA
A.2.11
Array hybridization protocol
FA
A.3.1
PCR primers used for the amplification of CNEs
FA
A.3.2
Extraction of zebrafish genomic DNA
FA
A.2.8
FA--------------- File attached
FA
ACKNOWLEDGEMENTS
I would like to thank my supervisor Dr. Thomas Lufkin for his guidance and tremendous
support throughout my study. And I also wish to thank Dr. Guillaume Bourque for his
valuable advice and guidance during the brief period I was in his lab.
I take this opportunity to thank the all the members in both the labs for their help and
support. A special thanks to Dr. Sook Peng and Dr. Selvi for sharing their data and reagents
with me.
And a special thanks to all my friends in Singapore for “putting up with me” and helping me
in all my endeavors. I must thank Kamesh, Karthik, Nithya and Ayshwarya for all their help
and support
I would also like to express my gratitude to people in NUS/DBS for their support.
And finally I take this opportunity to thank my parents for all the encouragement, support
and freedom they’ve given me throughout my life.
i
ABSTRACT
The development of a multi-cellular organism from a single-celled fertilized egg is an
autonomous process, requiring no instructions from the environment in which it develops.
So the program specifying the instructions for the development of an organism lies hidden
in the genome. In any cell, it is the specific combination of transcription factors present; in
the context of its environment that defines the identity of the cell. It is these 2 components,
the transcription factors and the cis-regulatory elements that read the regulatory state of a
cell that form the Gene Regulatory Networks (GRNs) which control development.
Studying gene regulatory networks involves the identification of the transcription factors
expressed and the cis-regulatory elements that are active in a particular cell lineage. It also
involves studying gene interactions at the transcriptional regulatory level and at protein
interaction level. GRNs for certain lineage specification have been mapped in detail in
invertebrate systems like sea urchin and in certain in vitro model systems for vertebrates.
Studying GRNs in vertebrate development poses various challenges, arising from the
complexity of the genome and the body plans of vertebrates. This necessitates the
development of novel approaches to study GRNs in development. Developments in
transgenic methods, genomic and proteomic technologies have opened new vistas for
exploring gene regulatory networks in detail. Whole genome gene expression profiling using
microarrays and mass spectrometry based methods for identification of protein-protein
interaction and massively parallel sequencing methods for mapping transcription factor
binding sites are some of the new developments that enable us to dissect gene regulatory
ii
networks. My projects involve developing methods and strategies to study GRNs in
vertebrate development.
One of the projects involves developing technology to isolate cells of a specific lineage from
a mixture of other cells in the developing mouse embryo and study the gene regulatory
pathway involved in the specification process. In a collaborative effort with in the lab, we
have successfully generated Sox9+/+, Sox9+/- and Sox9 -/- chimeras expressing EGFP in Sox9
expressing cells in the developing mouse embryo. For studying the chondrogenic
specification pathway, for which Sox9 is a master regulator, we have obtained whole
genome gene expression data from sorted EGFP+ cells of all the three genotypes at E13.5
and E12.5 stages. Several differentially expressed genes between the three genotypes and
the two time points have been identified. This includes well known targets of Sox9 and
other known factors involved in osteo-chondro lineage development. Further studies are
required to dissect out the GRN involved in this developmental pathway.
My second project aims to develop and refine a method to identify long and short range cisregulatory elements for developmental genes. These elements are often hidden in the vast
deserts of non-coding DNA in vertebrate genomes. Computationally predicted conserved
non-coding elements are assayed in vivo in developing zebrafish embryos for regulatory
activity. A strong forebrain enhancer for the dlx5a/dlx6a bi-gene cluster in zebrafish has
been identified. Enhancers driving the expression of this gene pair in other domains are yet
to be identified.
And finally, my other project involves developing a method for generating ES cell lines
expressing epitope tagged transcription factors for mapping protein-protein interaction
iii
networks involved in pluripotency in mouse ES cells. Oct4-2xFlag-TEV-BAP expressing lines
have been successfully generated. This can be used for TAP-MS analysis of the pluripotency
network.
iv
A note on my contributions
As the first two projects described in the thesis are multi-authored projects, I’ve described
my contribution to the specific steps in each of the projects.
1) Chapter 2: Novel approaches to study cell type specification
This project was started by Dr. Yap Sook Peng. All the three targeting constructs
were made by her and the ES cell screening for the required genome modification
was also done by her. Microinjection and most of the mouse work was done by
Hsiao Yun and Dr. Petra. They generated the chimeras and dissected out the
embryos.
Section 2.2: In the preliminary technology testing section described in chapter 2, my
contribution begins with preparing embryos for FACS. The sorting was done at the
Biopolis Shared Facility. RNA extraction, quality checking, target preparation,
microarray experiment and the preliminary data analysis described in this section
were done by me. In the method and results section, I’ve only explained those
experiments done by me.
Section 2.3: As mentioned in the thesis, for the main dataset, RNA extraction, target
preparation and the microarray experiment was done by Dr. Yap Sook Peng. For this
main dataset, my contribution begins with the collection of raw microarray data. In
this section, I’ve only explained the data analysis part of the experiment done by me.
2) Chapter 3: Identification of enhancers for the Dlx5/Dlx6 bi-gene cluster
This project was started by Dr. Selvi. The construction of the basal reporter vector
and the cloning of the intergenic element, CNE2, CNE3 were done by her. The rest of
the steps described in this section from setting up mating of zebrafish, preparation
of constructs for microinjection, microinjection of zebrafish embryos, assaying for
EGFP expression, and data consolidation was done by me.
v
3) Chapter 4: Epitope tagging of Oct4 for mapping pluripotency network
All the experiments explained in this section were done by me.
vi
ABBREVIATIONS
GRN
-
Gene Regulatory Network
BAC
-
Bacterial Artificial Chromosome
CNE
-
Conserved Non-coding Element
EGFP
-
Enhanced Green Fluorescent Protein
ES cells
-
Embryonic Stem Cells
FACS
-
Fluorescence Activated Cell Sorting
FCS
-
Foetal Calf Serum
GO
-
Gene Ontology
AER
-
Apical Ectodermal Ridge
PCR
-
Polymerase Chain Reaction
UTR
-
Untranslated region
LC
-
Liquid Chromatography
MS
-
Mass Spectrometry
TAP
-
Tandem Affinity Purification
TEV
-
Tobacco Etch Virus
BAP
-
Biotin Acceptor Peptide
vii
DNA
-
Deoxyribo Nucleic Acid
RNA
-
Ribo Nucleic Acid
SOX
-
Sry-related HMG box transcription factors
DLX
-
Distal-less related homeo-box containing transcription factors
OCT4
-
Octamer-4; Synonym of POU5F1
viii
LIST OF TABLES
Table
Title
Page No
1.1
Some of the domains/specification pathways for which GRNs
have been mapped in various model organisms (Smadar et al.,
2007; Davidson EH. 2006)
4
2.1
List of genes that are enriched in the EGFP+ fraction
22
2.2A
List of up and down regulated genes in E13.5 Sox9 +/+ vs Sox9 -/known to be involved in osteo-chondrogenic pathway
31
2.2B
List of up and down regulated genes in E 13.5 Sox9 +/- vs Sox9 -/known to be involved in osteo-chondrogenic pathway and
skeletal development
33
2.2C
List of up and down regulated genes in E 13.5 Sox9 +/+ vs Sox9
+/known to be involved in osteo-chondrogenic pathway
34
2.3A
List of up and down regulated genes in E13.5 Sox9 +/+ vs E12.5
Sox9 +/+ known to be involved in osteo-chondrogenic pathway
39
2.3B
List of up and down regulated genes in E13.5 Sox9 +/- vs E12.5
Sox9 +/- known to be involved in osteo-chondrogenic pathway
40
2.3C
List of up and down regulated genes in (E13.5 Sox9 +/+ - E13.5
Sox9 +/-)-(E12.5 Sox9+/+ -E12.5 Sox9 +/-) known to be involved in
osteo-chondrogenic pathway
41
ix
3.1
List of CNEs to be tested
55
3.2
Table of the fraction of embryos showing EGFP expression in
the various domains in 48hpf zebrafish embryos injected with
basal reporter vector
58
3.3
Table of the fraction of embryos showing EGFP expression in
the various domains in 48hpf zebrafish embryos injected with
basal reporter vector + intergenic element
60
3.4
Table of the fraction of embryos showing EGFP expression in
the various domains in 48hpf zebrafish embryos injected with
basal reporter vector + CNE1
62
3.5
Table of the fraction of embryos showing EGFP expression in
the various domains in 48hpf zebrafish embryos injected with
basal reporter vector + CNE2
63
3.6
Table of the fraction of embryos showing EGFP expression in
the various domains in 48hpf zebrafish embryos injected with
basal reporter vector + CNE3
65
4.1
List of factors important for pluripotency
72
x
LIST OF FIGURES
Figure
Title
Page No
1.1
Genomic regulatory system (adapted from Smadar et al.,
2007)
3
1.2
Endomesoderm specification pathway in Sea urchin (adapted 5
from Smadar et al.,2007)
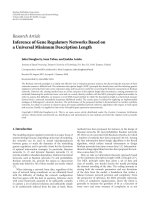
2.1
Schematic diagram of the process for global gene expression
profiling of specific cell populations
9
2.2
Whole mount in situ hybridization for Sox9 at E13.5 (adapted
from Wright et al.,1995)
14
2.3
Diagram of transcription factors involved in osteo-chondro
specification pathway (adapted from Crombrugghe et al.,
2001)
14
2.4
Diagram of targeting constructs for generating Sox9 +/+,+/-,-/chimeras
16
2.5
E13.5 Sox9+/- (EGFP+) & Wt Sox9+/+ under white light and
fluorescence microscope (images were obtained from Yap
Sook Peng)
17
2.6
Sox9 +/- chimeric embryo generated using veloci-mouse
technology under light and fluorescence microscope (images
were obtained from Yap Sook Peng)
17
xi
2.7
Presort analysis of one of the Sox9+/- chimeric embryos
19
2.8
Post sort analysis of the EGFP+ fraction
20
2.9
Representative electropherogram of RNA samples from EGFP 21
+ fractions
2.10
Schematics of the sample assignment to five chips
26
2.11
Boxplot of log transformed sample intensities before
normalization
28
2.12
Boxplot of log transformed sample intensities after quantile
normalization
28
2.13
Venn diagram showing cluster overlap amongst the first
three contrasts
30
2.14
Heatmap of probes that have a p-value less than 0.01 in all
three contrasts
35
2.15
Hierarchical clustering of the samples
36
2.16
Overlap among probes differentially expressed in the second
set of 3 contrasts
38
xii
2.17
Heatmap image of probes with p-value less than 0.01 in all
the three contrasts in the time effect section
42
3.1
Schematic representation of BAC modification
47
3.2
UCSC browser on zebra fish genome (March 2006 assembly),
showing the conservation tracks
47
3.3
Schematic diagram of the reporter construct
48
3.4
The dlx5a/dlx6a bi-gene cluster in the zebrafish genome
50
3.5
Wt and Dlx5/Dlx6 -/- E16.5 mouse embryos stained with
alician blue reveals chondrogenic regions (adapted from
Petra Kraus and Thomas Lufkin. 2006)
50
3.6
In situ hybridization images for dlx5a in 48hpf zebrafish
embryos
51
3.7
Sections from E15.5 transgenic embryos showing EGFP
expression in the cerebral cortex
54
3.8
Schematic diagram of the basal reporter vector
56
3.9A
UCSC track showing the basal promoter in the zebrafish
genome
57
xiii
3.9B
Template drawing showing EGFP expression in the various
domains of 48hpf zebrafish embryo
57
3.10A
UCSC genome browser track showing the intergenic element
58
3.10B
Template drawing showing EGFP expression in 48hpf
zebrafish embryo injected with basal reporter vector+
intergenic element
59
3.10C
Fluorescence microscope images of 48hpf zebrafish embryos
showing EGFP expression in the forebrain and AER of
pectoral fin injected with basal reporter vector + intergenic
element
59
3.10D
EGFP expression in the dorsal thalamus in 72hpf zebrafish
embryo injected with intergenic element + basal construct
under confocal fluorescence microscope
60
3.11A
UCSC genome browser track showing CNE 1 in the zebrafish
genome
61
3.11B
Template drawing of 48hpf zebrafish embryo showing EGFP
expression in the various domains of zebrafish embryos
injected with basal reporter vector+CNE1
61
3.12A
UCSC genome browser track showing CNE2 in the zebrafish
genome
62
3.12B
Template drawing of 48hpf zebrafish embryo showing EGFP
expression in the various domains of zebrafish embryos
injected with basal vector+CNE2
63
xiv
3.13A
UCSC genome browser track showing CNE3 in the zebrafish
genome
64
3.13B
Template drawing of 48hpf zebrafish embryo showing EGFP
expression in the various domains of zebrafish embryos
injected with basal vector+CNE3
64
3.14
48hpf zebrafish embryo showing EGFP expression in the AER
of pectoral fin injected with basal vector+CNE3
65
4.1
Pluripotent lineages in mouse embryo (adapted from
Niwa,H.2007)
69
4.2
Protein interaction network for pluripotency (adapted from
Wang et al.,2006)
71
4.3
Schematic diagram of the vector used for tagging
75
4.4
Light micrographs of ES cell colonies of both wild type and
Oct4-2xflag-TEV-BAP clones
78
4.5
Screening for Oct4-2xflag-TEV-BAP: Blot probed with antiflag
79
4.6
Screening for Oct4-2xflag-TEV-BAP: Blot probed with antiEGFP
79
xv
4.7
Screening for Oct4-2xflag-TEV-BAP: Blot probed with
streptavidin-HRP
80
4.8
Screening for Oct4-2xflag-TEV-BAP: Blot probed with antiOct4
81
4.9A
Screening for Oct4-pre-flag-TEV-BAP: Blot probed with antiflag
82
4.9B
Screening for Oct4-pre-flag-TEV-BAP: Blot probed with antiflag
82
4.10A
Screening for Oct4-pre-flag-TEV-BAP: Blot probed with antiEGFP
83
4.10B
Screening for Oct4-pre-flag-TEV-BAP: Blot probed with antiEGFP
83
4.11A
Screening for Oct4-pre-flag-TEV-BAP: Blot probed with
streptavidin-HRP
84
4.11B
Screening for Oct4-pre-flag-TEV-BAP: Blot probed with
streptavidin-HRP
85
xvi
CHAPTER 1
INTRODUCTION
GENE REGULATORY NETWORKS (GRNs) IN DEVELOPMENT
The development of a multi-cellular animal from a single cell involves a myriad of
processes ranging from cell-division, differentiation to cells that perform specific
functions, and migration of these cells to distinct domains in the developing embryo.
“The mechanism of development has many layers. At the outside development is
mediated by the spatial and temporal regulation of expression of thousands and
thousands of genes that encodes the diverse proteins of the organism. Deeper in is a
dynamic progression of regulatory state, defined by the presence and activity in the
cell nuclei of particular sets of DNA recognizing regulatory proteins (transcription
factors), which determines gene expression. At the core is the genomic apparatus
that encodes the interpretation of these regulatory states. Physically the core
apparatus consists of the sum of modular DNA sequence elements that interact with
transcription factors. The regulatory sequences read the information conveyed by the
regulatory state of the cell, process that information and enable it to be transduced
into instructions that can be utilized by the biochemical machines for expressing
genes that all cells possess.”
– Eric H. Davidson – The Regulatory Genome: Gene Regulatory Networks in
Development and Evolution, 2006.
1
The whole process of development of an embryo can be viewed as dynamic
progression through a series of regulatory states. Wherein, the regulatory state is
defined as the total sum of all the transcription factors present in the nucleus of a
cell. The fertilized egg and its descendants share the same genome. The regulatory
state in a cell along with other signaling cues from its environment are read by the
genome’s processing units referred to as cis-regulatory modules (Smadar et al.,
2007; Davidson E.H. 2006)
Cis-regulatory elements act as processors for regulatory inputs and process the
various signals to generate an output in the form of an expression level of a gene at a
particular time point. Through transcription factor-specific binding sites, it brings
together proteins of specific regulatory properties into close proximity, and the
complex regulates the rate at which specific genes are expressed (Davidson
E.H.2006).
These inter-regulating genes form the gene regulatory networks that control
development. There are some general features of Gene Regulatory Networks: 1) It is
the specific combination of transcription factors present in the nucleus at a
particular state of the cell, along with the signaling cues that arise as a result of its
spatial domain in the embryo, that controls the activation or repression of cisregulatory elements that drives/silences the expression of the regulatory genes; 2)
The networks are modular and consisting of several sub-circuits, with each subcircuit performing a specific developmental task; 3) And the sub-circuits are
generally composed of functional units: regulatory states turn on by specific
2
signaling, specification establishment and persistence by positive feed-back loops
and domain specification by repression (Davidson E.H.2006; Smadar et al.,2007)
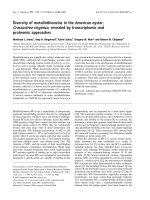
Fig 1.1: Genomic Regulatory system (Figure taken from Smadar et al., 2007)
a) An individual cis-regulatory element – non-random tight cluster of transcription
factor binding sites.
b) A regulatory gene – The exons of the gene are shown as green boxes and the cisregulatory elements are shown as pink boxes. This gene has 6 cis-regulatory
modules, each of which or a subset of these direct the lineage specific expression of
the gene at different time points.
c) Developmental Gene Regulatory Network: Transient spatial signaling cues are
conveyed to the transcriptional machinery in the nucleus by intra-cellular signaling
pathways. These cues along with the transcription factors already present in the
nucleus drive the expression of regulatory genes, which regulates the expression of
a subset of its target genes (in the context of the present regulatory state). These
factors in turn may establish feed-forward loops to establish a stable regulatory
state (Davidson EH. 2006: Smadar et al., 2007)
Gene regulatory networks involved in various specification pathways have been
mapped. But the list mainly includes invertebrate systems and vertebrate systems
3
for which in vitro models are available. Table 1.1 lists some of the systems and the
domain/specification pathway studied.
Table 1.1: Some of the domains/specification pathways for which GRNs have
been mapped in various model organisms (Smadar et al., 2007; Davidson EH.
2006)
Organism
Domain specification
References
Sea urchin
Endomesoderm
Davidson EH et
al.,2006
Starfish
Endoderm
Hinman EF et al.,2003
Mouse
Pancreatic β-cells
Davidson EH et
al.,2006;
Mouse
Hematopoietic stem
cells
Servitja JM et al.,2004
Mammals
B-cell specification
Swiers G et al.,2006
Mammals
T-cell specification
Singh H et al.,2006;
Anderson MK et
al.,2002
Vertebrates
Heart field
specification
Davidson EH. 2006
Frog
Mesoderm
Koide T et al.,2005
Ascidian
Notochord
Corbo JC et al.,1997
Drosophila
Heart field
Davidson EH et
al.,2006
Drosophila
Dorso-ventral axis
Levine M et al., 2005
Nematode
Vulva
Inoue T et al., 2005
Nematode
C-cell lineage
Baugh LR et al.,2005
4
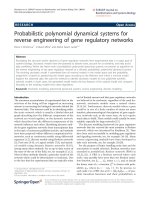
Construction of gene regulatory network maps involves the analysis of large
amounts of experimental data such as gene expression data, data from gene
perturbation studies, protein-protein interaction data and direct assays of cisregulatory regions using transgenic methods. The following diagram shows the
endomesoderm specification pathway in sea urchin. Arriving at such a detailed cisregulatory logic diagram for all the genes involved in a pathway takes tremendous
effort and is in itself a huge undertaking.
Fig 1.2: Endomesoderm specification pathway to 30hr (just before gastrulation)
in sea urchin. Gene regulatory network map for the specification of several
endomesodermal lineages till gastrulation. Progression through time is
represented from top to bottom in the picture. (Figure adapted from Smadar et
al., 2007).
5