Effects of ovariectomy, anabolic and anti resorptive treatments and their combined effects on bone micro architecture assessed using micro CT
Bạn đang xem bản rút gọn của tài liệu. Xem và tải ngay bản đầy đủ của tài liệu tại đây (4.41 MB, 101 trang )
EFFECTS OF OVARIECTOMY, ANABOLIC AND
ANTI-RESORPTIVE TREATMENTS AND THEIR
COMBINED EFFECTS ON BONE MICROARCHITECTURE ASSESSED USING MICRO-CT
CHAN YONG HOOW
A THESIS SUBMITTED FOR THE DEGREE OF
MASTER OF ENGINEERING
DIVISION OF BIOENGINEERING
NATIONAL UNIVERSITY OF SINGAPORE
2011
Acknowledgements
First and foremost, I like to acknowledge my academic supervisor, Prof Lee
Taeyong for all that he has done for me.
I will also like to express my gratitude to Prof Teoh Swee Hin, Zhang
Zhiyong and Wang Zhuyong for allowing me to use their micro-CT machine
in NUS Biomaterials laboratory. I am also indebted to Mr Khoo Hock Hee
and Yeow Chen Hua for helping me with the numerous micro-CT bone scans
in the NUS Tissue Engineering laboratory.
Special thanks to Prof Chan Yiong Huat for helping us with statistics and
Dr Jonnathan Peneyra for performing the ovariectomy surgeries.
I also want to thank Prof Dieter Trau and Prof Martin Buist for reviewing
and providing valuable suggestions to improve this report.
Last but not least, I need to say that I have learned much and enjoyed
working together with past and present members of the NUS Biomedical and
Materials laboratory.
ii
Table of Contents
Acknowledgements
ii
Summary
vi
List of Abbreviations
x
1 Introduction
1
1.1
Osteoporosis condition . . . . . . . . . . . . . . . . . . . . . .
1
1.2
Bone mineral density measurement . . . . . . . . . . . . . . .
2
1.3
Limitations of current measurement . . . . . . . . . . . . . . .
4
1.4
Available treatments . . . . . . . . . . . . . . . . . . . . . . .
5
1.5
Micro-architecture . . . . . . . . . . . . . . . . . . . . . . . .
6
1.6
Scientific questions . . . . . . . . . . . . . . . . . . . . . . . .
8
1.7
Aim . . . . . . . . . . . . . . . . . . . . . . . . . . . . . . . .
9
2 Methods
11
2.1
Overview . . . . . . . . . . . . . . . . . . . . . . . . . . . . . . 11
2.2
Resolution . . . . . . . . . . . . . . . . . . . . . . . . . . . . . 12
iii
iv
TABLE OF CONTENTS
2.3
Experimental design . . . . . . . . . . . . . . . . . . . . . . . 13
2.4
Animals . . . . . . . . . . . . . . . . . . . . . . . . . . . . . . 14
2.5
Anabolic or anti-resorptive treatment . . . . . . . . . . . . . . 16
2.6
Combining anabolics and anti-resorptives . . . . . . . . . . . . 16
2.7
Sample . . . . . . . . . . . . . . . . . . . . . . . . . . . . . . . 17
2.8
Tibia scan . . . . . . . . . . . . . . . . . . . . . . . . . . . . . 20
2.9
Medium . . . . . . . . . . . . . . . . . . . . . . . . . . . . . . 22
2.10 Voxel . . . . . . . . . . . . . . . . . . . . . . . . . . . . . . . . 22
2.11 Segmentation . . . . . . . . . . . . . . . . . . . . . . . . . . . 23
2.12 Region of Interest . . . . . . . . . . . . . . . . . . . . . . . . . 25
2.13 Rendering of bone volume . . . . . . . . . . . . . . . . . . . . 26
2.14 Morphological analysis . . . . . . . . . . . . . . . . . . . . . . 27
2.15 Bone volume fraction, BV/TV . . . . . . . . . . . . . . . . . . 28
2.16 Bone Surface Density, BS/TV . . . . . . . . . . . . . . . . . . 29
2.17 Bone surface ratio, BS/BV . . . . . . . . . . . . . . . . . . . . 30
2.18 Structure Model Index, SMI . . . . . . . . . . . . . . . . . . . 30
2.19 Trabecular Thickness, Tb.Th . . . . . . . . . . . . . . . . . . 31
2.20 Trabecular Separation, Tb.Sp . . . . . . . . . . . . . . . . . . 32
2.21 Trabecular Number, Tb.N . . . . . . . . . . . . . . . . . . . . 33
2.22 Trabecular Porosity, Tb.Po . . . . . . . . . . . . . . . . . . . . 33
3 Results
3.1
35
Visualization of trabecular region . . . . . . . . . . . . . . . . 35
TABLE OF CONTENTS
v
3.2
Micro-architectural changes . . . . . . . . . . . . . . . . . . . 36
3.3
Anabolic or Antiresorptive treatment . . . . . . . . . . . . . . 37
3.4
Statistical analysis . . . . . . . . . . . . . . . . . . . . . . . . 41
3.5
Biomarkers of bone turnover . . . . . . . . . . . . . . . . . . . 41
3.6
Combining PTH and Ibandronate . . . . . . . . . . . . . . . . 43
4 Discussion
48
4.1
Ovariectomy-induced bone loss
4.2
Beneficial effects of ibandronate . . . . . . . . . . . . . . . . . 49
4.3
Beneficial effects of PTH . . . . . . . . . . . . . . . . . . . . . 50
4.4
Beneficial effects of combining PTH with ibandronate . . . . . 50
4.5
Serum levels of bone biomarkers . . . . . . . . . . . . . . . . . 51
4.6
Drug ratio . . . . . . . . . . . . . . . . . . . . . . . . . . . . . 52
5 Conclusion
. . . . . . . . . . . . . . . . . 48
55
5.1
Importance of early intervention . . . . . . . . . . . . . . . . . 55
5.2
Additive effect . . . . . . . . . . . . . . . . . . . . . . . . . . . 56
5.3
Future work . . . . . . . . . . . . . . . . . . . . . . . . . . . . 56
Appendices
70
Summary
Post-menopausal osteoporosis can be a debilitating condition resulting from
increased fracture risks caused by reduced bone formation and increased
bone resorption. Two distinct classes of drugs can be used to slow down
the process of this condtiion. Anabolic drugs like parathyroid hormone
(PTH) and anti-resorptive agents (bisphosphonates) are currently available
therapies and their combined effects might be better than single therapy.
However, the advantages of prescribing a combined treatment using PTH
and bisphosphonate is still controversial. The main drawback of a combined
therapy is that the anti-resorptive agent could possibly counter the anabolic
treatment when used together.
This study was conducted to investigate the changes in bone microarchitecture to assess the efficacy of using PTH, an anabolic drug together with
an anti-resorptive agent, ibandronate and quantify their combined influence
on trabecular bone using the rat model for osteoporosis.
Sixty female Sprague Dawley rats were subjected to either ovariectomy
(OVX) or sham surgery. Weekly subcutaneous injections of saline vehicle,
vi
vii
PTH (1-34), ibandronate or both were administered respectively, beginning
from the 4th week after OVX surgery.
Both tibias of the animals were used for ex vivo micro-CT scans, where
several micro-architectural indices like bone volume fraction (BV/TV) were
compared between treatment groups. Serum levels of bone formation and
bone resorption markers were assayed using ELISA. A one-way ANOVA was
performed to compare the changes between all groups over a period of 12
weeks.
Results from micro-architectural indices suggest that ibandronate did not
reduce PTH’s anabolic effect in the combined treatment (OVX+PTH+IBAN)
group. Serum analysis of this group showed higher (p < 0.05) levels of bone
formation markers than all other groups and lower (p < 0.01) bone resorption
markers than in the (OVX+PTH) group, indicating their additive effects at
the systemic level.
Our conclusion is that at weekly low dosages, ibandronate proved to be
more effective thah PTH for most assessments. Furthermore, a partial additive
effect was observed in this combination where a low ratio of ibandronate
is used together with PTH. We suggest that the additive effect from the
combined treatment may be dependent on the PTH to bishosphonate ratio.
This positive effect could be maximized at an optimum ratio and further
investigations may enable us to maximize the use of this combined therapy
for osteoporosis.
List of Tables
2.1
Summary of bone morphological indices . . . . . . . . . . . . . 34
viii
List of Figures
2.1
Visualization of high steroid administration
2.2
Region of interest for rat tibia . . . . . . . . . . . . . . . . . . 21
2.3
Gray levels in micro-CT images . . . . . . . . . . . . . . . . . 24
2.4
Segmentation and rendering . . . . . . . . . . . . . . . . . . . 27
3.1
Effect of OVX, PTH or IBAN treatment in rat tibiae . . . . . 38
3.2
Graphs of BV/TV and BS/BV . . . . . . . . . . . . . . . . . 39
3.3
Graphs of SMI and Tb.Po . . . . . . . . . . . . . . . . . . . . 40
3.4
Graphs of Tb.Th and Tb.Sp . . . . . . . . . . . . . . . . . . . 41
3.5
Graph of Tb.N . . . . . . . . . . . . . . . . . . . . . . . . . . 42
3.6
Effects of single and combined treatments . . . . . . . . . . . 44
3.7
Graphs of BV/TV and SMI . . . . . . . . . . . . . . . . . . . 45
3.8
Graphs of Tb.Po and Tb.Th . . . . . . . . . . . . . . . . . . . 45
3.9
Graphs of Tb.N and Tb.Sp . . . . . . . . . . . . . . . . . . . . 46
5.1
Stress distribution in tibia (cortical region) from micro-CT data. 57
ix
. . . . . . . . . . 13
List of Abbreviations
BMD
Bone mineral density
BS/BV
Bone surface ratio
BS/TV
Bone surface density
BV/TV
Bone volume fraction
IBAN
Ibandronate (anti–resorptive effect)
PTH
Parathyroid hormone (anabolic effect)
SHAM
Ovary glands intact after sham surgery (control group)
SMI
Structure model index
Tb.N
Trabecular number
Tb.Po
Trabecular porosity
Tb.Sp
Trabecular separation
Tb.Th
Trabecular thickness
x
Chapter 1
Introduction
1.1
Osteoporosis condition
Osteoporosis is a condition which affects about 75 million people in Europe,
USA and Japan and is generally characterized by increased skeletal fragility as
a result of reduced bone strength. The most severe consequences include bone
fractures from unexpected and sudden increased in load (e.g. in accidents)
which the bone is not usually accustomed to.
The condition in osteoporosis where bone strength is compromised results
from the imbalance where bone formation rate is reduced compared to resorption. For every 10% loss of bone mass, the fracture risk doubles. The rapid
loss of trabecular bone1 tissue as a result of drastic reduction in estrogen
levels after menopause (type I) is the focus of this report. The other class of
1
also known as cancellous or spongy bone
1
2
CHAPTER 1. INTRODUCTION
osteoporosis (type II) refers to the age-related loss of cortical and trabecular
bone in both men and women, is also applicable during the discussion of
type I osteoporosis. While type I disorder is mainly a result of a drop in
plasma estrogen concentration, type II is caused by a combination of factors:
remodeling inefficiency, insufficient nutritional level of calcium and the change
in endogenous parathyroid hormone (PTH) levels.
Osteoporosis is becoming a major health concern with the rapidly greying
population in many countries. Bone fractures from falls and accidents could
result in major costs in hospitalizations and surgery, especially for the elderly
where the chances of complete recovery is low and permanent disability is
likely.
1.2
Bone mineral density measurement
In 1994, a definition of osteoporosis based on the dual X-ray absorptiometry
(DXA) derived bone mineral density (BMD) measurement is proposed by the
several senior researchers [1, 2] in working in this area for the World Health
Organization (WHO). It is suggested that a BMD value below 2.5 standard
deviations (SD) compared to the meaurements obtained from healthy young
adult women to be considered “osteoporotic”. Skeletons of elderly women
are typically only 50 to 80% as dense as their peak at 35 years. Elderly
men’s skeleton retain 80 to 90% of their BMD at youth. The higher risk of
post-menopausal osteoporosis in women compared to men is caused by the
1.2. BONE MINERAL DENSITY MEASUREMENT
3
rapid reduction in the female hormone, estrogen. This decline of estrogen level
following menopause results in depressed bone formation and accelerated bone
resorption. The same researchers also suggested that the BMD values that fall
below 1 to 2 SD to be diagnosed as “osteopenic”. Such classifications provide
a standard to identify individuals with their risks for potential bone fractures
where medical intervention (hormone replacement therapy, anti-resorptive
or anabolic treatments) can be prescribed to remedy the likely causes for
post-menopausal osteoporosis.
However, while easy to administer, the limitation of relying on DXAderived measurements is that they are planar. The three-dimensional structure
of bone is reduced to two dimensions because DXA scans from only in one
plane. BMD, measured using DXA, is therefore planar in nature. This single
BMD value, while easy for means of comparison between individuals, may
not provide sufficient evaluation of bone trabecular architecture [3]. Hence,
additional data is needed for predicting bone strength. Furthermore, studies
have shown that higher BMD measurements do not directly translate to lower
fracture risks [4, 5, 6, 7, 8, 9]. It is understandable that for most studies
that involved the ovariectomized rat as a model model for post-menopausal
osteoporosis, the severity of osteoporosis is tested at the metaphyseal region
by studying micro-architectural analysis using micro-CT [10, 11]. BMD may
not be sufficient to predict the likelihood of fractures as the micro-architecture
changes in the trabecular bone are not taken into account. Hence it could
be useful to study these micro-architectural changes in addition to BMD in
4
CHAPTER 1. INTRODUCTION
order to understand the progress of osteoporosis and to assess the therapeutic
effects of drugs to treat osteoporosis.
1.3
Limitations of current measurement
The osteoporosis criteria based on DXA-derived BMD measurement can be
limited in a few aspects. First and foremost is that young people who have
not reached their peak bone mass (around 30 years old) will be excluded
from using this selection criteria. Fortunately, osteoporosis is not yet a
major health worry among this group of indiviudals. Another shortcoming
of using BMD is that this singular average value will not be able to account
for variation in bone size and geometry. This leads to another limitation
concerning the accuracy of using BMD as a sole indicator for likelihood of
potential fractures. While a low BMD value is a good indicator for high
fracture risks, there are false negative instances of fractures in individuals
with BMD in the normal to osteopenic range [12, 13]. Another instance of
this limitation is when postmenopausal Chinese women with significantly
lower hip BMD than Caucassian women and are classified at higher risk for
fractures initially. However, the Chinese women turned out to have fewer
fractures because their rate of bone loss and turnover rate is lower [4]. The
underlying cause for osteoporosis is high bone resorption, and low BMD
mesurement is a indicator of this condition. The strength of bone is really
dependent on its micro-architecture and the rate of remodeling.
1.4. AVAILABLE TREATMENTS
1.4
5
Available treatments
There are two main classes of drugs that are effective in mitigating bone loss in
order to delay the progress of osteoporosis. One class known as anabolic agents
like Parathyroid Hormone (PTH) has been proven to stimulate bone formation
in animal osteoporosis models [14] as well as in human clinical trials [15, 16].
Another class known as anti-resorptive agents includes bisphosphonates like
ibandronate that effectively supresses bone resorption [16, 17].
Parathyroid hormone (PTH) is a polypeptide that plays a major contributing role in maintaining the balance between bone mass and calcium
homeostasis. When circulating plasma calcium concentration drops, parathyroid glands are stimulated to secrete PTH. The intact PTH hormone (1-84)
is cleaved in the parathyroid gland to produce the amino-terminal fragment,
PTH(1-34). The amino-terminal sequence (1-34) is required for binding to
the PTH receptors in osteoblasts in order to elicit their effects on bones.
The circulating PTH(1-34) amino-terminal fragments are constantly being
degraded by enzymes in the parathyroid gland and other organs, in order to
regulate their effects.
Although high concentration of PTH enhances osteoclastic resorption
of bone, intermittent administration of PTH produces an anabolic effect in
bones. PTH stimulates bone formation in both cortical and trabecular bone,
resulting in the increase in trabecular thickness and bone strength.
6
CHAPTER 1. INTRODUCTION
1.5
Micro-architecture
Although BMD measurement is currently the working standard of predicting
fracture likelihood, trabecular micro-architecture can affect the overall bone
strength to a large extent.
The idea about the relationship between trabecular micro-architectural
pattern and bone strength has a long history since Hermann von Meyer,
an anatomist and Karl Culmann, an engineer, observed that the trabeculae
struts in the femur are arranged along directions of maximum compression
and tension stresses similar to the structure of a Fairbank crane. This
arrangement ensures maximum strength with the available bone material.
From their results, Julius Wolff based his theory on the similarity of trabecular
pattern and maximum stress which is the main idea in Wolff’s law. In the
case of osteoporisis, the compressive trabeculae become thicker while those in
other orientations become thinner or disappear. The Singh index [18] provides
6 grades of osteoporosis severity by comparing trabecular pattern in x-rays
images with standard charts. Grade 6 refers to normal individuals, grade 3
points to established osteoporosis and grade 1 refers to severe osteoporosis.
The only drawback of this method is that it may not be quantitatively accurate
as two-dimensional x-rays images are used.
Currently, micro-architecture of trabecular can be measured by several
histomorphological indicators like the number of trabeculae defined in a given
1.5. MICRO-ARCHITECTURE
7
volume (Tb.N)2 , their mean thickness (Tb.Th) and their average separation
distance (Tb.Sp). The spatial distribution of trabecular tissue can be described
by its porosity (Tb.Po), its three-dimensional volume (BV/TV) and its
total surface area to volume ratio (BS/BV). An indication of the overall
shape of each trabeculae (either more plate-like or rod-like) is measured
by its structure model index (SMI) [19]. In the past, evaluation of these
histomorphological indices was done using two-dimensional histomorphometry.
With the increase in computing power, modern imaging modalities like microcomputed tomography (micro-CT) has enabled routine three-dimensional
measurements for both excised bone tissues as well as for in vivo conditions
in high resolutions.
It is also feasible to employ micro-CT analysis to evaluate the effectiveness
of current drugs against osteoporosis. Ibandronate has been proven to be
more potent than other bisphosphonates in animal experiments [20, 21, 22] to
reduce bone resorption at lower dosages compared to other bisphosphonates.
Parathyroid hormone is currently available for increasing the rate of bone
formation. Both classes of drugs uses different mechanisms to delay the
undesirable effects of osteoporosis. However, there is little documentation
about the morphological changes in the trabecular bone following these drug
treatments. Therefore this study was carried out to investigate the differences
between PTH’s anabolic effect and ibandronate’s anti-resorptive effect on
micro-architectural changes following the onset of osteoporosis. It addresses
2
More details about these indices in chapter 2, section 2.15 to section 2.22
8
CHAPTER 1. INTRODUCTION
the changes in morphological indices in the ovariectomized (OVX) rat as a
model for osteoporosis and investigates the changes under the influence of
PTH or ibandronate.
Just as we must not overlook the whole forest for the trees, it is important
not to forget the fact that micro-architecture is the combined result from the
direction of weight bearing as well as bone turnover, contributed by bone
formation and resorption. Data is accumulating that bone turnover markers
may also complement the assessment for bone strength [5].
1.6
Scientific questions
Especially for the rapidly greying population, osteoporosis continues to be
a medical challenge. It is a condition that leads to pain and higher risk of
fracture due to the reduction in bone strength and stability [38, 39, 2].
The most common strategies used to mitigate the effects of osteoporosis
include 2 distinct classes of drugs: both the anabolic parathyroid hormone
(PTH) and anti-resorptive bisphonates (BP) are effective when used individually even though their mechanisms of action differs.
Administration of PTH has been studied and found to have anabolic effect
on bone structural properties in mouse models [40] and human clinical trials
using alendronate and PTH (1-84) [15, 16]. PTH increases bone formation,
eventually increasing bone volume and strength. An alternative is to employ
the use of bisphonates (e.g. ibandronate or zolendronate), which have been
1.7. AIM
9
successfully shown to reduce fracture incidences by suppressing bone resorption
[17, 41, 42, 43]. The bisphonate – ibandronate, has shown to be effective
in inhibiting resorption in rats [20] and ovariohysterectomized dogs [21, 22].
With the administration of long-term treatment with ibandronate, bone
volume, bone strength and micro-architecture were restored [44].
There are still controversies involved in the merits of using both BP and
PTH to produce an additive effect [15, 45, 46, 47, 48, 49]. One school of
thought suggests that a combined administration of the full intact hormone,
PTH (1-84) and alendronate has no significant synergistic effect on postmenopausal women when measuring their bone mineral density (BMD) and
changes in biomarkers [15]. However, BMD measurment alone does not take
into acount the fine trabecular architecture [19] and bone stiffness. Moreover,
there are increasing evidences showing that a high BMD measurement does
not always correlate to a lower fracture risk [4, 5, 6, 7]. A recent study done
on C57BL/6 mice found that the combined therapy using alendronate and
the truncated PTH (1-34) is synergistic in the lumbar vertebra and additive
in the femur [48].
1.7
Aim
Our current aim is to assess the net advantages of combining PTH (1-34)
with with a bisphosphonate, ibandronate, and whether there is an optimal
ratio between the 2 drugs to reverse the effects of osteoporosis.
10
CHAPTER 1. INTRODUCTION
In this study, we are looking into the net additive advantage of the anabolic
PTH with anti-resorptive ibandronate using the established OVX rat model.
Micro-architectural [28] changes and biomarkers for bone formation and
resorption were assessed between sham or ovariectomized animals administered
a single drug or a combination of both drugs. Weekly administaration of
low dosages of PTH and ibandronate were used to reduce the undesirable
side effects present in higher dosages [44, 50, 51]. To evaluate the efficacy of
the combined treatment, micro-architectural changes and biomarkers were
investigated for PTH alone, ibandronate alone and a combination of PTH
and ibandronate.
Chapter 2
Methods
2.1
Overview
Until recently, histological staining and microscope measurement methods
were used to quantify bone loss from osteoporosis. Although these methods can
provide an indication regarding the effects of bone modeling and remodeling,
they are limited to a few two-dimensional bone cross-sections. Another
limitation of these methods is that an assumption of plate-like [23] trabecular
structures had to be assumed.
In recent years, micro-computed tomography (micro-CT) is becoming the
more preferred quantitative method to investigate bone micro-architectural
changes in laboratory animals in genetic studies or drug trials. The advantages
of using an imaging modality based on three-dimensional acquisition of xrays attenuation include high resolution images, relatively short scan times,
11
12
CHAPTER 2. METHODS
three-dimensional rendering capabilities and non-destructive analysis of bone
micro-architecture and strength.
2.2
Resolution
Higher resolution from micro-CT scans provides the visualization of microscopic details. The higher the resolution, the lower the inter-pixel distances.
Typical resolutions can range from 14 µm to 36 µm. Image resolutions at this
range will be sufficient to elucidate the fine rod and plate structures of the
trabecular bone, where the thinnest sturctures could measure between 30 µm
to 50 µm. Inter-pixel distances in three-dimensional space can be converted
to voxel space. Usually when reporting results where micro-CT is applicable,
voxel size is preferred over resolution [24].
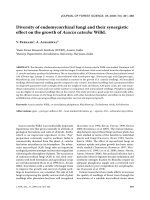
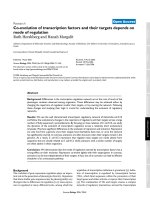
Figure 2.1 shows the rendering using 14 µm voxel size to illustrate the
effects of steroid-induced osteoporosis in mice. The region of interest (ROI)
is located at the distal metaphysis. The effects of glucocorticoid (a steroid
to suppress the immune system) at high concentration (left) versus normal
(right) is easily visible.
To achieve accurate rendering and analysis from the images obtained from
a scanned bone sample, it will be useful to consider carefully several factors
beforehand. The factors include: sample preparation, type of surrounding
medium, voxel size (resolution) of the image needed, region of interest for
segmentation and the type of indices for mrophological analysis.
2.3. EXPERIMENTAL DESIGN
(a) High steroid administration
13
(b) Normal
Fig. 2.1: Effects on trabecular bone by (a) High steroids levels compared to (b) Normal levels
2.3
Experimental design
This study investigated the effects of ovariectomy-induced osteoporosis and
the efficacy of combining PTH (anabolic) and ibandronate (anti-resorptive)
treatemnts. By using the well-established rat OVX model, changes in trabecular bone and the effectiveness of a combined therapy were evaluated using
micro-CT analyses.
The experimental control (SHAM) group served to identify any bone
growth over the course of the experiment. The untreated (OVX+VEH) group
administered with saline vehicle served as the placebo group to determine
the time when each treatment caused a significant improvement from the
osteoporotic condition. Since the difference between OVX and SHAM have
14
CHAPTER 2. METHODS
already been well-established from previous studies using micro-CT, fewer
animals (2 animals per time point) were allocated to SHAM and OVX groups
in this study. For most of the indices measured, standard deviations of SHAM
and OVX+VEH were no larger than other groups. Nevertheless, the limited
number of animals used per time point made it difficult to establish significant
differencess in some indices.
In this study, relatively young rats (12 weeks old) were used. Nevertheless,
There have been studies done using 3-months-old (12 weeks) rats to investigate
the effects of estrogen, testosterone and raloxifene in fracture healing during
early osteoporosis. Furthermore, the effects of vibrational stimulation to
prevent bone loss in the OVX model were thoroughly investigated using
3-months old rats [54, 55, 56]. Unlike the rabbit osteoporosis model [36], even
the skeletons of aged rats (3 months old) do not achieve full skeletal maturity
and have very low rates of remodelling in the cortical bone.
2.4
Animals
This section is included for the sole reason that the reader has some idea
about the origin of the animals involved and the treatments given prior to
obtaining the tibia sample for micro-CT scans1 .
Sixty female rats from the Sprague Dawley stock were purchased from
the NUS Centre for Animal Resources and housed in the Animal Holding
1
The author of this manuscript had little contribution in this section, and shamelessly
left the most laborious part of the work to other researchers in the group
2.4. ANIMALS
15
Unit (AHU). They were maintained at a room with temperature of 23 ◦ C and
controlled 12:12-hour light:dark cycle for regular circadian rhythm. They were
kept in groups of 2 animals per cage and provided with standard rodent chow
(Harland, Model T.2018S) and water ad libitum. The animals were subjected
to either OVX or sham surgery following one week of acclimatization after
arrival to AHU. All procedures were kept in accordance with the protocol
from the NUS Instutional Animal Care and Use Committee.
Ovariectomized (OVX) rats have their levels of estrogen greatly reduced
from the removal of the ovary glands and are established animal models for
osteoporosis. In this study, female rats from the Sprague Dawley stock of age
6 to 8 weeks were either subjected to OVX or sham surgery.
The group of rats that underwent sham surgeries were subjected to
identical surgical procedures as their counterparts in the OVX groups. The
only difference in surgical protocol is that their ovaries are left intact. This
group of rats served as the control group.
Those rats with their ovaries removed were divided into groups and were
administered either with saline vehicle (VEH), parathyroid hormone2 (PTH)
or ibandronate3 (IBAN). They were eventually divided into five study roups:
SHAM, OVX+VEH, OVX+PTH, OVX+IBAN and OVX+PTH+IBAN.
0.9% saline (vehicle) was used to dilute PTH (1-34) from Sigma-Aldrich,
Singapore and ibandronate from Roche Diagnostics GmbH, Mannheim, Ger2
3
anabolic therapy
anti-resorptive therapy