2010 ASHRAE HANDBOOK
Bạn đang xem bản rút gọn của tài liệu. Xem và tải ngay bản đầy đủ của tài liệu tại đây (26.46 MB, 722 trang )
2010 ASHRAE HANDBOOK
REFRIGERATION
--``,`,,``,,,`,,,````,``````,,``-`-`,,`,,`,`,,`---
Inch-Pound Edition
American Society of Heating, Refrigerating and Air-Conditioning Engineers, Inc.
1791 Tullie Circle, N.E., Atlanta, GA 30329
(404) 636-8400
Copyright ASHRAE
Provided by IHS under license with ASHRAE
No reproduction or networking permitted without license from IHS
Licensee=AECOM User Geography and Business Line/5906698001, User=Irlandez, Jendl
Not for Resale, 10/17/2011 15:40:15 MDT
©2010 by the American Society of Heating, Refrigerating and Air-Conditioning Engineers,
Inc. All rights reserved.
DEDICATED TO THE ADVANCEMENT OF
THE PROFESSION AND ITS ALLIED INDUSTRIES
No part of this book may be reproduced without permission in writing from ASHRAE,
except by a reviewer who may quote brief passages or reproduce illustrations in a review
with appropriate credit; nor may any part of this book be reproduced, stored in a retrieval
system, or transmitted in any form or by any means—electronic, photocopying, recording,
or other—without permission in writing from ASHRAE.
Volunteer members of ASHRAE Technical Committees and others compiled the information in this handbook, and it is generally reviewed and updated every four years. Comments, criticisms, and suggestions regarding the subject matter are invited. Any errors or
omissions in the data should be brought to the attention of the Editor. Additions and corrections to Handbook volumes in print will be published in the Handbook published the year
following their verification and, as soon as verified, on the ASHRAE Internet Web site.
DISCLAIMER
ASHRAE has compiled this publication with care, but ASHRAE has not investigated,
and ASHRAE expressly disclaims any duty to investigate, any product, service, process,
procedure, design, or the like that may be described herein. The appearance of any technical
data or editorial material in this publication does not constitute endorsement, warranty, or
guaranty by ASHRAE of any product, service, process, procedure, design, or the like.
ASHRAE does not warrant that the information in this publication is free of errors. The
entire risk of the use of any information in this publication is assumed by the user.
--``,`,,``,,,`,,,````,``````,,``-`-`,,`,,`,`,,`---
Copyright ASHRAE
Provided by IHS under license with ASHRAE
No reproduction or networking permitted without license from IHS
ISBN 978-1-933742-81-6
ISSN 1930-7195
The paper for this book was manufactured in an acid- and
elemental-chlorine-free process with pulp obtained from sources
using sustainable forestry practices.
Licensee=AECOM User Geography and Business Line/5906698001, User=Irlandez, Jendl
Not for Resale, 10/17/2011 15:40:15 MDT
CONTENTS
Contributors
ASHRAE Technical Committees, Task Groups, and Technical Resource Groups
ASHRAE Research: Improving the Quality of Life
Preface
SYSTEMS AND PRACTICES
Chapter
1.
2.
3.
4.
5.
6.
7.
Halocarbon Refrigeration Systems (TC 10.3, Refrigerant Piping)
Ammonia Refrigeration Systems (TC 10.3)
Carbon Dioxide Refrigeration Systems (TC 10.3)
Liquid Overfeed Systems (TC 10.1, Custom-Engineered Refrigeration Systems)
Component Balancing in Refrigeration Systems (TC 10.1)
Refrigerant System Chemistry (TC 3.2, Refrigerant System Chemistry)
Control of Moisture and Other Contaminants in Refrigerant Systems (TC 3.3, Refrigerant
Contaminant Control)
8. Equipment and System Dehydrating, Charging, and Testing (TC 8.1, Positive-Displacement
Compressors)
9. Refrigerant Containment, Recovery, Recycling, and Reclamation (TC 8.3, Refrigerant
Containment)
COMPONENTS AND EQUIPMENT
Chapter
--``,`,,``,,,`,,,````,``````,,``-`-`,,`,,`,`,,`---
10.
11.
12.
13.
14.
15.
Insulation Systems for Refrigerant Piping (TC 10.3)
Refrigerant-Control Devices (TC 8.8, Refrigerant System Controls and Accessories)
Lubricants in Refrigerant Systems (TC 3.4, Lubrication)
Secondary Coolants in Refrigeration Systems (TC 10.1)
Forced-Circulation Air Coolers (TC 8.4, Air-to-Refrigerant Heat Transfer Equipment)
Retail Food Store Refrigeration and Equipment (TC 10.7, Commercial Food and Beverage
Cooling, Display, and Storage)
16. Food Service and General Commercial Refrigeration Equipment (TC 10.7)
17. Household Refrigerators and Freezers (TC 8.9, Residential Refrigerators and Food Freezers)
18. Absorption Equipment (TC 8.3, Absorption and Heat-Operated Machines)
FOOD COOLING AND STORAGE
Chapter
19.
20.
21.
22.
23.
24.
Thermal Properties of Foods (TC 10.9, Refrigeration Applications for Foods and Beverages)
Cooling and Freezing Times of Foods (TC 10.9)
Commodity Storage Requirements (TC 10.5, Refrigerated Distribution and Storage Facilities)
Food Microbiology and Refrigeration (TC 10.9)
Refrigerated-Facility Design (TC 10.5)
Refrigerated-Facility Loads (TC 10.8, Refrigeration Load Calculations)
REFRIGERATED TRANSPORT
Chapter
25. Cargo Containers, Rail Cars, Trailers, and Trucks (TC 10.6, Transport Refrigeration)
26. Marine Refrigeration (TC 10.6)
27. Air Transport (TC 10.6)
Copyright ASHRAE
Provided by IHS under license with ASHRAE
No reproduction or networking permitted without license from IHS
Licensee=AECOM User Geography and Business Line/5906698001, User=Irlandez, Jendl
Not for Resale, 10/17/2011 15:40:15 MDT
FOOD, BEVERAGE, AND FLORAL APPLICATIONS
Chapter
28.
29.
30.
31.
32.
33.
34.
35.
36.
37.
38.
39.
40.
41.
42.
Methods of Precooling Fruits, Vegetables, and Cut Flowers (TC 10.9)
Industrial Food-Freezing Systems (TC 10.9)
Meat Products (TC 10.9)
Poultry Products (TC 10.9)
Fishery Products (TC 10.9)
Dairy Products (TC 10.9)
Eggs and Egg Products (TC 10.9)
Deciduous Tree and Vine Fruit (TC 10.9)
Citrus Fruit, Bananas, and Subtropical Fruit (TC 10.9)
Vegetables (TC 10.9)
Fruit Juice Concentrates and Chilled Juice Products (TC 10.9)
Beverages (TC 10.9)
Processed, Precooked, and Prepared Foods (TC 10.9)
Bakery Products (TC 10.9)
Chocolates, Candies, Nuts, Dried Fruits, and Dried Vegetables (TC 10.9)
INDUSTRIAL APPLICATIONS
Chapter
--``,`,,``,,,`,,,````,``````,,``-`-`,,`,,`,`,,`---
43.
44.
45.
46.
Ice Manufacture (TC 10.2, Automatic Icemaking Plants and Skating Rinks)
Ice Rinks (TC 10.2)
Concrete Dams and Subsurface Soils (TC 10.1)
Refrigeration in the Chemical Industry (TC 10.1)
LOW-TEMPERATURE APPLICATIONS
Chapter
47. Cryogenics (TC 10.4, Ultralow-Temperature Systems and Cryogenics)
48. Ultralow-Temperature Refrigeration (TC 10.4)
49. Biomedical Applications of Cryogenic Refrigeration (TC 10.4)
GENERAL
Chapter
50. Terminology of Refrigeration (TC 10.1)
51. Codes and Standards
Additions and Corrections
Index
Composite index to the 2007 HVAC Applications, 2008 HVAC Systems and Equipment, 2009
Fundamentals, and 2010 Refrigeration volumes
Comment Pages
Copyright ASHRAE
Provided by IHS under license with ASHRAE
No reproduction or networking permitted without license from IHS
Licensee=AECOM User Geography and Business Line/5906698001, User=Irlandez, Jendl
Not for Resale, 10/17/2011 15:40:15 MDT
CONTRIBUTORS
In addition to the Technical Committees, the following individuals contributed significantly
to this volume. The appropriate chapter numbers follow each contributor’s name.
Lane Loyko (2)
PLA Corporation
Alex Lifson (8)
UT Carrier Co.
Bryan R. Becker (19)
University of Missouri–Kansas City
John Sluga (2)
Hansen Technologies Corporation
Danny Halel (9)
Hussman Corporation
Matt Musich (25)
Ingersoll Rand
M. Kent Anderson (3)
Daniel Miles (9)
Vacuum Technologies, Inc.
Robert Srichai (25)
Ingersoll Rand
Bruce Griffith (3)
Johnson Controls/Frick
James W. Young, Jr. (10)
ITW Insulation Systems
Andrew B. Pearson (3)
Star Refrigeration, Ltd.
Robert A. Jones (11)
Sporlan Division, Parker Hannifin
Don Siller (3)
John R. Topliss (3)
Refrigeration Components (RCC) Canada
Ltd.
Robert Doerr (6)
Jay Field (6)
Trane Company
Ganesan Sundaresan (6)
Sundaresan Consulting Services, LLC
Raymond Tomas (6)
Honeywell
Alan P. Cohen (7)
UOP LLC
Joseph Longo (7)
Hudson Technologies Company
Danny Halel (7)
Ingersoll Rand
Alexander D. Leyderman (8)
Fairchild Controls
Dennis Littwin (11)
Fujikoki America
Ernest Schumacher (11)
Jeff Berge (26)
Ingersoll Rand
Josh Ide (26)
Ingersoll Rand
Bill Mohs (27)
Ingersoll Rand
Joe Karnaz (12)
CPI Engineering
George Johnston (38)
Tropicana
Liwen Wei (12)
Novitas Chem Solutions
Daniel Dettmers (38, 50)
IRC-University of Wisconsin, Madison
Rob Yost (12)
National Refrigerant
John Edmonds (43)
Edmonds Engineering Co.
Pradeep Bansal (17)
University of Auckland
John Scott (43, 44)
Natural Resources Canada
John Dieckmann (17)
TIAX LLC
Detlef Westphalen (17)
Navigant Consulting, Inc.
David Yashar (17)
National Institute of Standards and
Technology
Wayne Borrowman (44)
Cimco Refrigeration
Roger Taliotis (44)
Geoxergy
Nick Dimick (50)
IRC-University of Wisconsin, Madison
ASHRAE HANDBOOK COMMITTEE
Dennis L. O’Neal, Chair
2010 Refrigeration Volume Subcommittee: William J. McCartney, Chair
Roberto R. Aguilo
Daniel J. Dettmers
Cecily M. Grzywacz
ASHRAE HANDBOOK STAFF
W. Stephen Comstock, Publisher
Director of Publications and Education
Mark S. Owen, Editor
Heather E. Kennedy, Associate Editor
Nancy F. Thysell, Typographer/Page Designer
David Soltis, Manager and Jayne E. Jackson, Publications Traffic Administrator
Publishing Services
--``,`,,``,,,`,,
Copyright ASHRAE
Provided by IHS under license with ASHRAE
No reproduction or networking permitted without license from IHS
Licensee=AECOM User Geography and Business Line/5906698001, User=Irlandez, Jendl
Not for Resale, 10/17/2011 15:40:15 MDT
--``,`,,``,,,`,,,````,``````,,``-`-`,,`,,`,`,,`---
Copyright ASHRAE
Provided by IHS under license with ASHRAE
No reproduction or networking permitted without license from IHS
Licensee=AECOM User Geography and Business Line/5906698001, User=Irlandez, Jendl
Not for Resale, 10/17/2011 15:40:15 MDT
ASHRAE TECHNICAL COMMITTEES, TASK GROUPS, AND
TECHNICAL RESOURCE GROUPS
--``,`,,``,,,`,,,````,``````,,``-`-`,,`,
SECTION 1.0—FUNDAMENTALS AND GENERAL
1.1
Thermodynamics and Psychrometrics
1.2
Instruments and Measurements
1.3
Heat Transfer and Fluid Flow
1.4
Control Theory and Application
1.5
Computer Applications
1.6
Terminology
1.7
Business, Management, and General Legal Education
1.8
Mechanical Systems Insulation
1.9
Electrical Systems
1.10 Cogeneration Systems
1.11 Electric Motors and Motor Control
1.12 Moisture Management in Buildings
TG1
Exergy Analysis for Sustainable Buildings (EXER)
TG1
Optimization (OPT)
SECTION 2.0—ENVIRONMENTAL QUALITY
2.1
Physiology and Human Environment
2.2
Plant and Animal Environment
2.3
Gaseous Air Contaminants and Gas Contaminant
Removal Equipment
2.4
Particulate Air Contaminants and Particulate
Contaminant Removal Equipment
2.5
Global Climate Change
2.6
Sound and Vibration Control
2.7
Seismic and Wind Restraint Design
2.8
Building Environmental Impacts and Sustainability
2.9
Ultraviolet Air and Surface Treatment
TG2
Heating, Ventilation, and Air-Conditioning Security (HVAC)
SECTION 3.0—MATERIALS AND PROCESSES
3.1
Refrigerants and Secondary Coolants
3.2
Refrigerant System Chemistry
3.3
Refrigerant Contaminant Control
3.4
Lubrication
3.6
Water Treatment
3.8
Refrigerant Containment
TG3
HVAC&R Contractors and Design-Build Firms (CDBF)
SECTION 4.0—LOAD CALCULATIONS AND ENERGY
REQUIREMENTS
4.1
Load Calculation Data and Procedures
4.2
Climatic Information
4.3
Ventilation Requirements and Infiltration
4.4
Building Materials and Building Envelope Performance
4.5
Fenestration
4.7
Energy Calculations
4.10 Indoor Environmental Modeling
TRG4 Sustainable Building Guidance and Metrics (SBGM)
SECTION 5.0—VENTILATION AND AIR DISTRIBUTION
5.1
Fans
5.2
Duct Design
5.3
Room Air Distribution
5.4
Industrial Process Air Cleaning (Air Pollution Control)
5.5
Air-to-Air Energy Recovery
5.6
Control of Fire and Smoke
5.7
Evaporative Cooling
5.8
Industrial Ventilation Systems
5.9
Enclosed Vehicular Facilities
5.10 Kitchen Ventilation
5.11 Humidifying Equipment
SECTION 6.0—HEATING EQUIPMENT, HEATING AND
COOLING SYSTEMS AND APPLICATIONS
6.1
Hydronic and Steam Equipment and Systems
Copyright ASHRAE
Provided by IHS under license with ASHRAE
No reproduction or networking permitted without license from IHS
6.2
6.3
6.5
6.6
6.7
6.8
6.9
6.10
District Energy
Central Forced-Air Heating and Cooling Systems
Radiant Heating and Cooling
Service Water Heating Systems
Solar Energy Utilization
Geothermal Energy Utilization
Thermal Storage
Fuels and Combustion
SECTION 7.0—BUILDING PERFORMANCE
7.1
Integrated Building Design
7.3
Operation and Maintenance Management
7.5
Smart Building Systems
7.6
Systems Energy Utilization
7.7
Testing and Balancing
7.8
Owning and Operating Costs
7.9
Building Commissioning
TRG7 Tools for Sustainable Building Operations, Maintenance,
and Cost Analysis (SBOMC)
TRG7 Underfloor Air Distribution (UFAD)
SECTION 8.0—AIR-CONDITIONING AND
REFRIGERATION SYSTEM COMPONENTS
8.1
Positive-Displacement Compressors
8.2
Centrifugal Machines
8.3
Absorption and Heat-Operated Machines
8.4
Air-to-Refrigerant Heat Transfer Equipment
8.5
Liquid-to-Refrigerant Heat Exchangers
8.6
Cooling Towers and Evaporative Condensers
8.7
Variable Refrigerant Flow
8.8
Refrigerant System Controls and Accessories
8.9
Residential Refrigerators and Food Freezers
8.10 Mechanical Dehumidification Equipment and Heat Pipes
8.11 Unitary and Room Air Conditioners and Heat Pumps
8.12 Desiccant Dehumidification Equipment and Components
SECTION 9.0—BUILDING APPLICATIONS
9.1
Large-Building Air-Conditioning Systems
9.2
Industrial Air Conditioning
9.3
Transportation Air Conditioning
9.4
Applied Heat Pump/Heat Recovery Systems
9.5
Residential and Small-Building Applications
9.6
Healthcare Facilities
9.7
Educational Facilities
9.8
Large-Building Air-Conditioning Applications
9.9
Mission-Critical Facilities, Technology Spaces, and
Electronic Equipment
9.10 Laboratory Systems
9.11 Clean Spaces
9.12 Tall Buildings
TG9
Justice Facilities
SECTION 10.0—REFRIGERATION SYSTEMS
10.1
Custom-Engineered Refrigeration Systems
10.2
Automatic Icemaking Plants and Skating Rinks
10.3
Refrigerant Piping
10.4
Ultralow-Temperature Systems and Cryogenics
10.5
Refrigerated Distribution and Storage Facilities
10.6
Transport Refrigeration
10.7
Commercial Food and Beverage Cooling, Display, and
Storage
10.8
Refrigeration Load Calculations
10.9
Refrigeration Application for Foods and Beverages
10.10 Management of Lubricant in Circulation
Licensee=AECOM User Geography and Business Line/5906698001, User=Irlandez, Jendl
Not for Resale, 10/17/2011 15:40:15 MDT
ASHRAE Research: Improving the Quality of Life
The American Society of Heating, Refrigerating and AirConditioning Engineers is the world’s foremost technical society in
the fields of heating, ventilation, air conditioning, and refrigeration.
Its members worldwide are individuals who share ideas, identify
needs, support research, and write the industry’s standards for testing and practice. The result is that engineers are better able to keep
indoor environments safe and productive while protecting and preserving the outdoors for generations to come.
One of the ways that ASHRAE supports its members’ and industry’s need for information is through ASHRAE Research. Thousands of individuals and companies support ASHRAE Research
annually, enabling ASHRAE to report new data about material
properties and building physics and to promote the application of
innovative technologies.
Chapters in the ASHRAE Handbook are updated through the
experience of members of ASHRAE Technical Committees and
through results of ASHRAE Research reported at ASHRAE conferences and published in ASHRAE special publications and in
ASHRAE Transactions.
For information about ASHRAE Research or to become a member, contact ASHRAE, 1791 Tullie Circle, Atlanta, GA 30329; telephone: 404-636-8400; www.ashrae.org.
Preface
The 2010 ASHRAE Handbook—Refrigeration covers the refrigeration equipment and systems for applications other than human
comfort. This book includes information on cooling, freezing, and
storing food; industrial applications of refrigeration; and low-temperature refrigeration. Primarily a reference for the practicing engineer, this volume is also useful for anyone involved in cooling and
storage of food products.
An accompanying CD-ROM contains all the volume’s chapters
in both I-P and SI units.
This edition includes two new chapters:
• Chapter 3, Carbon Dioxide Refrigeration Systems, describes the
history of this “natural refrigerant” and why it is the subject of
renewed interest today. The chapter contains discussion and diagrams on CO2 refrigerant applications, system design, equipment, safety, lubricants, commissioning, operation, and
maintenance.
• Chapter 50, Terminology of Refrigeration, lists some of the common terms used in industrial refrigeration systems, particularly
systems using ammonia as the refrigerant.
Also new for this volume, chapter titles, order, and groupings
have been revised for more logical flow and use. Some of the other
revisions and additions are as follows:
•
•
•
•
This volume is published, both as a bound print volume and in
electronic format on a CD-ROM, in two editions: one using inchpound (I-P) units of measurement, the other using the International
System of Units (SI).
Corrections to the 2007, 2008, and 2009 Handbook volumes can
be found on the ASHRAE Web site at and in
the Additions and Corrections section of this volume. Corrections
for this volume will be listed in subsequent volumes and on the
ASHRAE Web site.
Reader comments are enthusiastically invited. To suggest
improvements for a chapter, please comment using the form on
the ASHRAE Web site or, using the cutout pages at the end of this
volume’s index, write to Handbook Editor, ASHRAE, 1791 Tullie
Circle, Atlanta, GA 30329, or fax 678-539-2187, or e-mail
Mark S. Owen
Editor
--``,`,,``,,,`,,,````,``````,,``-`-`,,`,,`,`,,`---
• Chapter 2, Ammonia Refrigeration Systems, has added guidance
on avoiding hydraulic shock, on purging water and noncondensables, as well as on hot-gas defrost and defrost control.
• Chapter 6, Refrigerant System Chemistry, has added information
on polyvinyl ether (PVE) lubricants and corrosion, plus updates
for recent ASHRAE research on copper plating and material compatibility.
• Chapter 8, Equipment and System Dehydrating, Charging, and
Testing, has new table data on dehydration and moisture-measuring
methods and a revised section on performance testing.
• Chapter 9, Refrigerant Containment, Recovery, Recycling, and
Reclamation, has added a new table comparing sensitivities of
various leak-detection methods and a procedure for receiver level
monitoring.
• Chapter 11, Refrigerant-Control Devices, has updated information on electric expansion valves and discharge bypass valves,
•
plus revised figures on thermostatic expansion valves (TXVs) and
several revised examples.
Chapter 12, Lubricants in Refrigerant Systems, has new content
on pressure/viscosity coefficients, compressibility factors, and
lubricants’ effects on system performance.
Chapter 17, Household Refrigerators and Freezers, has been reorganized and updated for revised standards and new component
technologies, including variable-speed and linear compressors,
and has information on new configurations and functions, such as
wine cooling units, rapid-chill/freeze/thaw, and odor elimination.
The section on performance evaluation has been revised and integrated with the section on standards.
Chapter 25, Cargo Containers, Rail Cars, Trailers, and Trucks, has
been updated with information on multitemperature compartments and air curtains.
Chapter 38, Fruit Juice Concentrates and Chilled Juice Products,
has added description of storage tank sterilization.
Chapter 44, Ice Rinks, has extensive changes to the section on
heat recovery and updated loads information based on ASHRAE
research project RP-1289.
Copyright ASHRAE
Provided by IHS under license with ASHRAE
No reproduction or networking permitted without license from IHS
Licensee=AECOM User Geography and Business Line/5906698001, User=Irlandez, Jendl
Not for Resale, 10/17/2011 15:40:15 MDT
CHAPTER 1
HALOCARBON REFRIGERATION SYSTEMS
Refrigerant Flow ........................................................................ 1.1
Refrigerant Line Sizing .............................................................. 1.1
Discharge (Hot-Gas) Lines ...................................................... 1.19
Defrost Gas Supply Lines......................................................... 1.21
Receivers .................................................................................. 1.21
Air-Cooled Condensers............................................................ 1.23
Piping at Multiple Compressors ..............................................
Piping at Various System Components.....................................
Refrigeration Accessories ........................................................
Head Pressure Control for Refrigerant Condensers ................
Keeping Liquid from Crankcase During Off Cycles ................
Hot-Gas Bypass Arrangements ................................................
R
EFRIGERATION is the process of moving heat from one
location to another by use of refrigerant in a closed cycle. Oil
management; gas and liquid separation; subcooling, superheating,
and piping of refrigerant liquid and gas; and two-phase flow are all
part of refrigeration. Applications include air conditioning, commercial refrigeration, and industrial refrigeration.
Desired characteristics of a refrigeration system may include
Table 1
Recommended Gas Line Velocities
Suction line
Discharge line
900 to 4000 fpm
2000 to 3500 fpm
low initial cost of the system may be more significant than low operating cost. Industrial or commercial refrigeration applications,
where equipment runs almost continuously, should be designed
with low refrigerant velocities for most efficient compressor performance and low equipment operating costs. An owning and operating cost analysis will reveal the best choice of line sizes. (See
Chapter 36 of the 2007 ASHRAE Handbook—HVAC Applications
for information on owning and operating costs.) Liquid lines from
condensers to receivers should be sized for 100 fpm or less to ensure
positive gravity flow without incurring backup of liquid flow. Liquid lines from receiver to evaporator should be sized to maintain
velocities below 300 fpm, thus minimizing or preventing liquid
hammer when solenoids or other electrically operated valves are
used.
• Year-round operation, regardless of outdoor ambient conditions
• Possible wide load variations (0 to 100% capacity) during short
periods without serious disruption of the required temperature
levels
• Frost control for continuous-performance applications
• Oil management for different refrigerants under varying load and
temperature conditions
• A wide choice of heat exchange methods (e.g., dry expansion,
liquid overfeed, or flooded feed of the refrigerants) and use of secondary coolants such as salt brine, alcohol, and glycol
• System efficiency, maintainability, and operating simplicity
• Operating pressures and pressure ratios that might require multistaging, cascading, and so forth
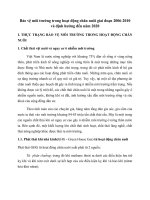
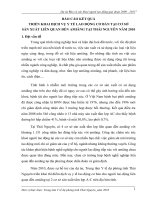
Refrigerant Flow Rates
Refrigerant flow rates for R-22 and R-134a are indicated in Figures 1 and 2. To obtain total system flow rate, select the proper rate
value and multiply by system capacity. Enter curves using saturated refrigerant temperature at the evaporator outlet and actual
liquid temperature entering the liquid feed device (including subcooling in condensers and liquid-suction interchanger, if used).
Because Figures 1 and 2 are based on a saturated evaporator
temperature, they may indicate slightly higher refrigerant flow rates
than are actually in effect when suction vapor is superheated above
the conditions mentioned. Refrigerant flow rates may be reduced
approximately 3% for each 10°F increase in superheat in the evaporator.
Suction-line superheating downstream of the evaporator from
line heat gain from external sources should not be used to reduce
evaluated mass flow, because it increases volumetric flow rate and
line velocity per unit of evaporator capacity, but not mass flow rate.
It should be considered when evaluating suction-line size for satisfactory oil return up risers.
Suction gas superheating from use of a liquid-suction heat
exchanger has an effect on oil return similar to that of suction-line
superheating. The liquid cooling that results from the heat exchange
reduces mass flow rate per ton of refrigeration. This can be seen in
Figures 1 and 2 because the reduced temperature of the liquid supplied to the evaporator feed valve has been taken into account.
Superheat caused by heat in a space not intended to be cooled is
always detrimental because the volumetric flow rate increases with
no compensating gain in refrigerating effect.
A successful refrigeration system depends on good piping design
and an understanding of the required accessories. This chapter covers the fundamentals of piping and accessories in halocarbon refrigerant systems. Hydrocarbon refrigerant pipe friction data can be
found in petroleum industry handbooks. Use the refrigerant properties and information in Chapters 3, 29, and 30 of the 2009 ASHRAE
Handbook—Fundamentals to calculate friction losses.
For information on refrigeration load, see Chapter 22. For R-502
information, refer to the 1998 ASHRAE Handbook—Refrigeration.
Piping Basic Principles
The design and operation of refrigerant piping systems should
(1) ensure proper refrigerant feed to evaporators; (2) provide practical refrigerant line sizes without excessive pressure drop; (3) prevent excessive amounts of lubricating oil from being trapped in any
part of the system; (4) protect the compressor at all times from loss
of lubricating oil; (5) prevent liquid refrigerant or oil slugs from entering the compressor during operating and idle time; and (6) maintain a clean and dry system.
REFRIGERANT FLOW
Refrigerant Line Velocities
--``,`,,``,,,`,,,````,``````,,``-`-`,,`,,`
Economics, pressure drop, noise, and oil entrainment establish
feasible design velocities in refrigerant lines (Table 1).
Higher gas velocities are sometimes found in relatively short
suction lines on comfort air-conditioning or other applications
where the operating time is only 2000 to 4000 h per year and where
REFRIGERANT LINE SIZING
In sizing refrigerant lines, cost considerations favor minimizing
line sizes. However, suction and discharge line pressure drops cause
The preparation of this chapter is assigned to TC 10.3, Refrigerant Piping.
Copyright ASHRAE
Provided by IHS under license with ASHRAE
No reproduction or networking permitted without license from IHS
1.24
1.25
1.28
1.32
1.33
1.34
1.1
Licensee=AECOM User Geography and Business Line/5906698001, User=Irlandez, Jendl
Not for Resale, 10/17/2011 15:40:15 MDT
1.2
2010 ASHRAE Handbook—Refrigeration
Table 2
Fig. 1 Flow Rate per Ton of Refrigeration for Refrigerant 22
Approximate Effect of Gas Line Pressure Drops on
R-22 Compressor Capacity and Powera
Capacity, %
Energy, %b
Suction Line
0
2
4
100
96.4
92.9
100
104.8
108.1
Discharge Line
0
2
4
100
99.1
98.2
100
103.0
106.3
Line Loss, °F
aFor
system operating at 40°F saturated evaporator temperature and 100°F saturated
condensing temperature.
bEnergy percentage rated at hp/ton.
Fig. 1 Flow Rate per Ton of Refrigeration for Refrigerant 22
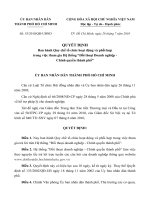
Fig. 2
134a
Flow Rate per Ton of Refrigeration for Refrigerant
corresponding to about a 1 to 2°F change in saturation temperature.
See Tables 3 to 9 for liquid-line sizing information.
Liquid subcooling is the only method of overcoming liquid line
pressure loss to guarantee liquid at the expansion device in the evaporator. If subcooling is insufficient, flashing occurs in the liquid line
and degrades system efficiency.
Friction pressure drops in the liquid line are caused by accessories such as solenoid valves, filter-driers, and hand valves, as well as
by the actual pipe and fittings between the receiver outlet and the
refrigerant feed device at the evaporator.
Liquid-line risers are a source of pressure loss and add to the total
loss of the liquid line. Loss caused by risers is approximately 0.5 psi
per foot of liquid lift. Total loss is the sum of all friction losses plus
pressure loss from liquid risers.
Example 1 illustrates the process of determining liquid-line size
and checking for total subcooling required.
Example 1. An R-22 refrigeration system using copper pipe operates at
40°F evaporator and 105°F condensing. Capacity is 5 tons, and the liquid line is 100 ft equivalent length with a riser of 20 ft. Determine the
liquid-line size and total required subcooling.
Solution: From Table 3, the size of the liquid line at 1°F drop is 5/8 in.
OD. Use the equation in Note 3 of Table 3 to compute actual temperature drop. At 5 tons,
Fig. 2
Flow Rate per Ton of Refrigeration for
Refrigerant 134a
loss of compressor capacity and increased power usage. Excessive
liquid line pressure drops can cause liquid refrigerant to flash,
resulting in faulty expansion valve operation. Refrigeration systems
are designed so that friction pressure losses do not exceed a pressure
differential equivalent to a corresponding change in the saturation
boiling temperature. The primary measure for determining pressure
drops is a given change in saturation temperature.
Pressure Drop Considerations
Pressure drop in refrigerant lines reduces system efficiency. Correct sizing must be based on minimizing cost and maximizing efficiency. Table 2 shows the approximate effect of refrigerant pressure
drop on an R-22 system operating at a 40°F saturated evaporator
temperature with a 100°F saturated condensing temperature.
Pressure drop calculations are determined as normal pressure loss
associated with a change in saturation temperature of the refrigerant.
Typically, the refrigeration system is sized for pressure losses of 2°F
or less for each segment of the discharge, suction, and liquid lines.
Liquid Lines. Pressure drop should not be so large as to cause
gas formation in the liquid line, insufficient liquid pressure at the
liquid feed device, or both. Systems are normally designed so that
pressure drop in the liquid line from friction is not greater than that
Actual temperature drop
= 1.0(5.0/6.7)1.8
Estimated friction loss
= 0.59 3.05
Loss for the riser
= 20 0.5
Total pressure losses
= 10.0 + 1.8
R-22 saturation pressure at 105°F condensing
(see R-22 properties in Chapter 30, 2009
ASHRAE Handbook—Fundamentals)
Initial pressure at beginning of liquid line
Total liquid line losses
Net pressure at expansion device
The saturation temperature at 199 psig is 101.1°F.
Required subcooling to overcome the liquid losses
=
=
=
=
–
=
0.59°F
1.8 psi
10 psi
11.8 psi
210.8 psig
210.8 psig
11.8 psi
199 psig
= (105.0 – 101.1)
or 3.9°F
Refrigeration systems that have no liquid risers and have the
evaporator below the condenser/receiver benefit from a gain in pressure caused by liquid weight and can tolerate larger friction losses
without flashing. Regardless of the liquid-line routing when flashing occurs, overall efficiency is reduced, and the system may malfunction.
The velocity of liquid leaving a partially filled vessel (e.g., a
receiver or shell-and-tube condenser) is limited by the height of the
liquid above the point at which the liquid line leaves the vessel,
whether or not the liquid at the surface is subcooled. Because liquid
in the vessel has a very low (or zero) velocity, the velocity V in the
liquid line (usually at the vena contracta) is V 2 = 2gh, where h is
the liquid height in the vessel. Gas pressure does not add to the
--``,`,,``,,,`,,,````,``````,,``-`-`,,`,,`,`,,`---
Copyright ASHRAE
Provided by IHS under license with ASHRAE
No reproduction or networking permitted without license from IHS
Licensee=AECOM User Geography and Business Line/5906698001, User=Irlandez, Jendl
Not for Resale, 10/17/2011 15:40:15 MDT
Halocarbon Refrigeration Systems
Table 3
1.3
Suction, Discharge, and Liquid Line Capacities in Tons for Refrigerant 22 (Single- or High-Stage Applications)
Suction Lines ( t = 2°F)
Line Size
Type L
Copper,
OD
1/2
5/8
7/8
1 1/8
1 3/8
1 5/8
2 1/8
2 5/8
3 1/8
3 5/8
4 1/8
Steel
IPS SCH
1/2
40
3/4
40
1
40
1 1/4 40
1 1/2 40
2
40
2 1/2 40
3
40
4
40
–40
0.79
—
—
0.52
1.1
1.9
3.0
6.2
10.9
17.5
26.0
36.8
Saturated Suction Temperature, °F
–20
0
20
Corresponding p, psi/100 ft
1.15
1.6
2.22
—
—
0.40
0.32
0.51
0.76
0.86
1.3
2.0
1.7
2.7
4.0
3.1
4.7
7.0
4.8
7.5
11.1
10.0
15.6
23.1
17.8
27.5
40.8
28.4
44.0
65.0
42.3
65.4
96.6
59.6
92.2
136.3
—
0.50
0.95
2.0
3.0
5.7
9.2
16.2
33.1
0.38
0.8
1.5
3.2
4.7
9.1
14.6
25.7
52.5
0.58
1.2
2.3
4.8
7.2
13.9
22.1
39.0
79.5
0.85
1.8
3.4
7.0
10.5
20.2
32.2
56.8
115.9
40
2.91
0.6
1.1
2.9
5.8
10.1
16.0
33.1
58.3
92.9
137.8
194.3
1.2
2.5
4.8
9.9
14.8
28.5
45.4
80.1
163.2
Notes:
1. Table capacities are in tons of refrigeration.
p = pressure drop from line friction, psi per 100 ft of equivalent line length
t = corresponding change in saturation temperature, °F per 100 ft
2. Line capacity for other saturation temperatures t and equivalent lengths Le
Table L e Actual t 0.55
Line capacity = Table capacity ----------------------- -----------------------
Actual L e Table t
3. Saturation temperature t for other capacities and equivalent lengths Le
Actual L Actual capacity 1.8
t = Table t -----------------------e -------------------------------------
Table L e Table capacity
1.7
3.7
6.9
14.3
21.5
41.4
65.9
116.4
237.3
Type L
Copper,
OD
1/2
5/8
7/8
1 1/8
1 3/8
1 5/8
2 1/8
2 5/8
3 1/8
3 5/8
4 1/8
Steel
IPS SCH
1/2
80
3/4
80
1
80
1 1/4 80
1 1/2 80
2
40
2 1/2 40
3
40
4
40
See notes a and b
Vel. =
100 fpm
2.3
3.7
7.8
13.2
20.2
28.5
49.6
76.5
109.2
147.8
192.1
3.8
6.9
11.5
20.6
28.3
53.8
76.7
118.5
204.2
t = 1°F
p = 3.05
3.6
6.7
18.2
37.0
64.7
102.5
213.0
376.9
601.5
895.7
1263.2
5.7
12.8
25.2
54.1
82.6
192.0
305.8
540.3
1101.2
Condensing
Temperature, °F
Suction Line
Discharge Line
80
1.11
0.79
90
1.07
0.88
100
1.03
0.95
110
0.97
1.04
120
0.90
1.10
130
0.86
1.18
140
0.80
1.26
b Line pressure drop p is conservative; if subcooling is substantial or line is short, a
smaller size line may be used. Applications with very little subcooling or very long
lines may require a larger line.
shown is recommended where any gas generated in receiver must return up
condensate line to condenser without restricting condensate flow. Water-cooled
condensers, where receiver ambient temperature may be higher than refrigerant
condensing temperature, fall into this category.
Suction, Discharge, and Liquid Line Capacities in Tons for Refrigerant 22 (Intermediate- or Low-Stage Duty)
Line Size
Type L
Copper, OD
5/8
7/8
1 1/8
1 3/8
1 5/8
2 1/8
2 5/8
3 1/8
3 5/8
4 1/8
5 1/8
6 1/8
1.5
3.3
6.1
12.6
19.0
36.6
58.1
102.8
209.5
Liquid Lines
Line Size
4. Values based on 105°F condensing temperature. Multiply table capacities by the following factors for other condensing temperatures.
a Sizing
Table 4
Discharge Lines
( t = 1°F, p = 3.05 psi)
Saturated Suction
Temperature, °F
–40
40
0.75
0.85
1.4
1.6
3.7
4.2
7.5
8.5
13.1
14.8
20.7
23.4
42.8
48.5
75.4
85.4
120.2
136.2
178.4
202.1
251.1
284.4
–90
–80
0.18
0.36
0.6
1.0
2.1
3.8
6.1
9.1
12.9
23.2
37.5
0.25
0.51
0.9
1.4
3.0
5.3
8.5
12.7
18.0
32.3
52.1
Suction Lines (t = 2°F)*
Saturated Suction Temperature, °F
–70
–60
–50
0.34
0.70
1.2
1.9
4.1
7.2
11.6
17.3
24.5
43.9
71.0
0.46
0.94
1.6
2.6
5.5
9.7
15.5
23.1
32.7
58.7
94.6
0.61
1.2
2.2
3.4
7.2
12.7
20.4
30.4
43.0
77.1
124.2
Notes:
1. Table capacities are in tons of refrigeration.
p = pressure drop from line friction, psi per 100 ft of equivalent line length
t = corresponding change in saturation temperature, °F per 100 ft
2. Line capacity for other saturation temperatures t and equivalent lengths Le
0.55
Table L
Actual t
Line capacity = Table capacity ----------------------e- -----------------------
Actual
L
Table
t
e
3. Saturation temperature t for other capacities and equivalent lengths Le
1.8
Actual L Actual capacity
t = Table t -----------------------e -------------------------------------
Table L e Table capacity
–40
–30
0.79
1.6
2.8
4.5
9.3
16.5
26.4
39.4
55.6
99.8
160.5
1.0
2.1
3.6
5.7
11.9
21.1
33.8
50.2
70.9
126.9
204.2
Discharge
Lines
(t = 2°F)*
0.7
1.9
3.8
6.6
10.5
21.7
38.4
61.4
91.2
128.6
229.5
369.4
See Table 3
5. Values based on 0°F condensing temperature. Multiply table capacities by the
following factors for other condensing temperatures. Flow rates for discharge
lines are based on –50°F evaporating temperature.
Condensing
Temperature, °F
Suction Line
Discharge Line
4. Refer to refrigerant thermodynamic property tables (Chapter 30 of the 2009 ASHRAE
Handbook—Fundamentals) for pressure drop corresponding to t.
*See section on Pressure Drop Considerations.
–30
–20
–10
0
10
20
30
1.09
1.06
1.03
1.00
0.97
0.94
0.90
--``,`,,``,,,`,,,````,``````,,``-`-`,,`,,`,`,,`---
Copyright ASHRAE
Provided by IHS under license with ASHRAE
No reproduction or networking permitted without license from IHS
Liquid Lines
Licensee=AECOM User Geography and Business Line/5906698001, User=Irlandez, Jendl
Not for Resale, 10/17/2011 15:40:15 MDT
0.58
0.71
0.85
1.00
1.20
1.45
1.80
1.4
2010 ASHRAE Handbook—Refrigeration
velocity unless gas is flowing in the same direction. As a result, both
gas and liquid flow through the line, limiting the rate of liquid flow.
If this factor is not considered, excess operating charges in receivers
and flooding of shell-and-tube condensers may result.
No specific data are available to precisely size a line leaving a
vessel. If the height of liquid above the vena contracta produces the
desired velocity, liquid leaves the vessel at the expected rate. Thus,
if the level in the vessel falls to one pipe diameter above the bottom
of the vessel from which the liquid line leaves, the capacity of copper lines for R-22 at 3 lb/min per ton of refrigeration is approximately as follows:
OD, in.
Tons
1 1/8
1 3/8
1 5/8
2 1/8
2 5/8
3 1/8
4 1/8
14
25
40
80
130
195
410
The whole liquid line need not be as large as the leaving connection. After the vena contracta, the velocity is about 40% less. If the
line continues down from the receiver, the value of h increases. For
a 200 ton capacity with R-22, the line from the bottom of the
receiver should be about 3 1/8 in. After a drop of 1 ft, a reduction to
2 5/8 in. is satisfactory.
Suction Lines. Suction lines are more critical than liquid and
discharge lines from a design and construction standpoint. Refrigerant lines should be sized to (1) provide a minimum pressure drop
at full load, (2) return oil from the evaporator to the compressor
under minimum load conditions, and (3) prevent oil from draining
from an active evaporator into an idle one. A pressure drop in the
suction line reduces a system’s capacity because it forces the compressor to operate at a lower suction pressure to maintain a desired
evaporating temperature in the coil. The suction line is normally
sized to have a pressure drop from friction no greater than the
equivalent of about a 2°F change in saturation temperature. See
Tables 3 to 15 for suction line sizing information.
At suction temperatures lower than 40°F, the pressure drop
equivalent to a given temperature change decreases. For example,
at –40°F suction with R-22, the pressure drop equivalent to a 2°F
change in saturation temperature is about 0.8 psi. Therefore,
low-temperature lines must be sized for a very low pressure drop,
Table 5 Suction, Discharge, and Liquid Line Capacities in Tons for Refrigerant 134a (Single- or High-Stage Applications)
Line Size
Type L
Copper,
OD
1/2
5/8
7/8
1 1/8
1 3/8
1 5/8
2 1/8
2 5/8
3 1/8
3 5/8
4 1/8
5 1/8
6 1/8
Steel
IPS SCH
1/2
3/4
1
1 1/4
1 1/2
2
2 1/2
3
4
80
80
80
40
40
40
40
40
40
0
1.00
Suction Lines (t = 2°F)
Saturated Suction Temperature, °F
10
20
30
Corresponding p, psi/100 ft
1.19
1.41
1.66
40
1.93
Discharge Lines
(t = 1°F, p = 2.2 psi/100 ft)
Line Size
Saturated Suction
Temperature, °F
0
20
40
Type L
Copper,
OD
Velocity =
100 fpm
t = 1°F
p = 2.2
0.14
0.27
0.71
1.45
2.53
4.02
8.34
14.80
23.70
35.10
49.60
88.90
143.00
0.18
0.34
0.91
1.84
3.22
5.10
10.60
18.80
30.00
44.60
62.90
113.00
181.00
0.23
0.43
1.14
2.32
4.04
6.39
13.30
23.50
37.50
55.80
78.70
141.00
226.00
0.29
0.54
1.42
2.88
5.02
7.94
16.50
29.10
46.40
69.10
97.40
174.00
280.00
0.35
0.66
1.75
3.54
6.17
9.77
20.20
35.80
57.10
84.80
119.43
213.00
342.00
0.54
1.01
2.67
5.40
9.42
14.90
30.80
54.40
86.70
129.00
181.00
323.00
518.00
0.57
1.07
2.81
5.68
9.91
15.70
32.40
57.20
91.20
135.00
191.00
340.00
545.00
0.59
1.12
2.94
5.95
10.40
16.40
34.00
59.90
95.50
142.00
200.00
356.00
571.00
1/2
5/8
7/8
1 1/8
1 3/8
1 5/8
2 1/8
2 5/8
3 1/8
3 5/8
4 1/8
—
—
Steel
IPS SCH
2.13
3.42
7.09
12.10
18.40
26.10
45.30
69.90
100.00
135.00
175.00
—
—
2.79
5.27
14.00
28.40
50.00
78.60
163.00
290.00
462.00
688.00
971.00
—
—
0.22
0.51
1.00
2.62
3.94
7.60
12.10
21.40
43.80
0.28
0.64
1.25
3.30
4.95
9.56
15.20
26.90
54.90
0.35
0.79
1.56
4.09
6.14
11.90
18.90
33.40
68.00
0.43
0.98
1.92
5.03
7.54
14.60
23.10
41.00
83.50
0.53
1.19
2.33
6.12
9.18
17.70
28.20
49.80
101.60
0.79
1.79
3.51
9.20
13.80
26.60
42.40
75.00
153.00
0.84
1.88
3.69
9.68
14.50
28.00
44.60
78.80
160.00
0.88
1.97
3.86
10.10
15.20
29.30
46.70
82.50
168.00
1/2
3/4
1
1 1/4
1 1/2
2
2 1/2
3
4
3.43
6.34
10.50
18.80
25.90
49.20
70.10
108.00
187.00
4.38
9.91
19.50
41.80
63.70
148.00
236.00
419.00
853.00
Notes:
1. Table capacities are in tons of refrigeration.
p = pressure drop from line friction, psi per 100 ft of equivalent line length
t = corresponding change in saturation temperature, °F per 100 ft
--``,`,,``,,,`,,,````,``````,,``-`-`,,`,,`,`,,`---
shown is recommended where any gas generated in receiver must return up
condensate line to the condenser without restricting condensate flow. Water-cooled
condensers, where receiver ambient temperature may be higher than refrigerant condensing temperature, fall into this category.
Copyright ASHRAE
Provided by IHS under license with ASHRAE
No reproduction or networking permitted without license from IHS
80
80
80
80
80
40
40
40
40
4. Values based on 105°F condensing temperature. Multiply table capacities by the following factors for other condensing temperatures.
Condensing
Temperature, °F
Suction Line
Discharge Line
2. Line capacity for other saturation temperatures t and equivalent lengths Le
0.55
Table L
Actual t
Line capacity = Table capacity ----------------------e- -----------------------
Actual
L
Table
t
e
3. Saturation temperature t for other capacities and equivalent lengths Le
1.8
Actual L Actual capacity
t = Table t -----------------------e -------------------------------------
Table L e Table capacity
a Sizing
Liquid Lines
See notes a and b
80
90
100
110
120
130
1.158
1.095
1.032
0.968
0.902
0.834
0.804
0.882
0.961
1.026
1.078
1.156
pressure drop p is conservative; if subcooling is substantial or line is short, a
smaller size line may be used. Applications with very little subcooling or very long
lines may require a larger line.
b Line
Licensee=AECOM User Geography and Business Line/5906698001, User=Irlandez, Jendl
Not for Resale, 10/17/2011 15:40:15 MDT
Halocarbon Refrigeration Systems
1.5
or higher equivalent temperature losses, with resultant loss in
equipment capacity, must be accepted. For very low pressure
drops, any suction or hot-gas risers must be sized properly to
ensure oil entrainment up the riser so that oil is always returned
to the compressor.
Where pipe size must be reduced to provide sufficient gas velocity to entrain oil up vertical risers at partial loads, greater pressure
drops are imposed at full load. These can usually be compensated
for by oversizing the horizontal and down run lines and components.
Discharge Lines. Pressure loss in hot-gas lines increases the
required compressor power per unit of refrigeration and decreases
compressor capacity. Table 2 illustrates power losses for an R-22
system at 40°F evaporator and 100°F condensing temperature. Pressure drop is minimized by generously sizing lines for low friction
losses, but still maintaining refrigerant line velocities to entrain and
carry oil along at all loading conditions. Pressure drop is normally
designed not to exceed the equivalent of a 2°F change in saturation
temperature. Recommended sizing tables are based on a 1°F change
in saturation temperature per 100 ft.
Location and Arrangement of Piping
--``,`,,``,,,`,,,````,``````,,``-`-`,,`,,`,`,,`---
Refrigerant lines should be as short and direct as possible to
minimize tubing and refrigerant requirements and pressure drops.
Plan piping for a minimum number of joints using as few elbows
and other fittings as possible, but provide sufficient flexibility to
absorb compressor vibration and stresses caused by thermal expansion and contraction.
Arrange refrigerant piping so that normal inspection and servicing of the compressor and other equipment is not hindered. Do not
obstruct the view of the oil-level sight glass or run piping so that it
interferes with removing compressor cylinder heads, end bells,
access plates, or any internal parts. Suction-line piping to the compressor should be arranged so that it will not interfere with removal
of the compressor for servicing.
Provide adequate clearance between pipe and adjacent walls and
hangers or between pipes for insulation installation. Use sleeves that
are sized to permit installation of both pipe and insulation through
floors, walls, or ceilings. Set these sleeves prior to pouring of concrete or erection of brickwork.
Run piping so that it does not interfere with passages or obstruct
headroom, windows, and doors. Refer to ASHRAE Standard 15 and
other governing local codes for restrictions that may apply.
Protection Against Damage to Piping
Protection against damage is necessary, particularly for small
lines, which have a false appearance of strength. Where traffic is
heavy, provide protection against impact from carelessly handled
hand trucks, overhanging loads, ladders, and fork trucks.
Piping Insulation
All piping joints and fittings should be thoroughly leak-tested
before insulation is sealed. Suction lines should be insulated to prevent sweating and heat gain. Insulation covering lines on which
moisture can condense or lines subjected to outside conditions must
be vapor-sealed to prevent any moisture travel through the insulation or condensation in the insulation. Many commercially available
types are provided with an integral waterproof jacket for this purpose. Although the liquid line ordinarily does not require insulation,
suction and liquid lines can be insulated as a unit on installations
where the two lines are clamped together. When it passes through a
warmer area, the liquid line should be insulated to minimize heat
gain. Hot-gas discharge lines usually are not insulated; however,
they should be insulated if the heat dissipated is objectionable or to
prevent injury from high-temperature surfaces. In the latter case, it
is not essential to provide insulation with a tight vapor seal because
moisture condensation is not a problem unless the line is located
Copyright ASHRAE
Provided by IHS under license with ASHRAE
No reproduction or networking permitted without license from IHS
outside. Hot-gas defrost lines are customarily insulated to minimize
heat loss and condensation of gas inside the piping.
All joints and fittings should be covered, but it is not advisable to
do so until the system has been thoroughly leak-tested. See Chapter
10 for additional information.
Vibration and Noise in Piping
Vibration transmitted through or generated in refrigerant piping
and the resulting objectionable noise can be eliminated or minimized by proper piping design and support.
Two undesirable effects of vibration of refrigerant piping are
(1) physical damage to the piping, which can break brazed joints
and, consequently, lose charge; and (2) transmission of noise
through the piping itself and through building construction that
may come into direct contact with the piping.
In refrigeration applications, piping vibration can be caused by
rigid connection of the refrigerant piping to a reciprocating compressor. Vibration effects are evident in all lines directly connected to the
compressor or condensing unit. It is thus impossible to eliminate
vibration in piping; it is only possible to mitigate its effects.
Flexible metal hose is sometimes used to absorb vibration transmission along smaller pipe sizes. For maximum effectiveness, it
should be installed parallel to the crankshaft. In some cases, two
isolators may be required, one in the horizontal line and the other
in the vertical line at the compressor. A rigid brace on the end of the
flexible hose away from the compressor is required to prevent
vibration of the hot-gas line beyond the hose.
Flexible metal hose is not as efficient in absorbing vibration on
larger pipes because it is not actually flexible unless the ratio of
length to diameter is relatively great. In practice, the length is often
limited, so flexibility is reduced in larger sizes. This problem is best
solved by using flexible piping and isolation hangers where the piping is secured to the structure.
When piping passes through walls, through floors, or inside furring, it must not touch any part of the building and must be supported only by the hangers (provided to avoid transmitting vibration
to the building); this eliminates the possibility of walls or ceilings
acting as sounding boards or diaphragms. When piping is erected
where access is difficult after installation, it should be supported by
isolation hangers.
Vibration and noise from a piping system can also be caused by
gas pulsations from the compressor operation or from turbulence in
the gas, which increases at high velocities. It is usually more apparent in the discharge line than in other parts of the system.
When gas pulsations caused by the compressor create vibration and noise, they have a characteristic frequency that is a function of the number of gas discharges by the compressor on each
revolution. This frequency is not necessarily equal to the number
of cylinders, because on some compressors two pistons operate
together. It is also varied by the angular displacement of the cylinders, such as in V-type compressors. Noise resulting from gas
pulsations is usually objectionable only when the piping system
amplifies the pulsation by resonance. On single-compressor systems, resonance can be reduced by changing the size or length of
the resonating line or by installing a properly sized hot-gas muffler in the discharge line immediately after the compressor discharge valve. On a paralleled compressor system, a harmonic
frequency from the different speeds of multiple compressors may
be apparent. This noise can sometimes be reduced by installing
mufflers.
When noise is caused by turbulence and isolating the line is not
effective enough, installing a larger-diameter pipe to reduce gas
velocity is sometimes helpful. Also, changing to a line of heavier
wall or from copper to steel to change the pipe natural frequency
may help.
Licensee=AECOM User Geography and Business Line/5906698001, User=Irlandez, Jendl
Not for Resale, 10/17/2011 15:40:15 MDT
--``,`,,``,,,`,,,````,``````,,``-`-`,,`,,`,`,,`---
Copyright ASHRAE
Provided by IHS under license with ASHRAE
No reproduction or networking permitted without license from IHS
0.18
0.35
0.79
1.55
3.33
5.08
11.78
18.74
33.11
67.50
121.87
197.09
402.66
728.40
1163.62
1506.59
2171.13
0.27
0.53
1.18
2.32
4.97
7.57
17.57
27.94
49.37
100.66
181.32
293.24
599.91
1083.73
1733.87
2244.98
3230.27
0.04
0.08
0.18
0.35
0.75
1.14
2.65
4.23
7.48
15.30
27.58
44.58
91.40
165.52
264.36
342.81
493.87
0.11
0.22
0.51
0.99
2.13
3.26
7.55
12.04
21.26
43.34
78.24
126.52
258.81
468.14
748.94
968.21
1395.24
0.07
0.14
0.31
0.60
1.30
1.98
4.61
7.34
12.98
26.47
47.78
77.26
158.09
286.19
457.37
592.13
852.84
0.64
0.05
0.09
0.15
0.24
0.49
0.86
1.36
2.83
5.03
8.05
11.98
16.93
30.35
48.89
101.60
–60
Saturated Suction Temperature, °F
–40
–20
0
20
Corresponding p, psi/100 ft
0.97
1.41
1.96
2.62
0.09
0.15
0.24
0.36
0.16
0.28
0.44
0.68
0.28
0.47
0.76
1.15
0.43
0.73
1.17
1.78
0.88
1.49
2.37
3.61
1.54
2.59
4.13
6.28
2.44
4.10
6.53
9.92
5.07
8.52
13.53
20.51
8.97
15.07
23.88
36.16
14.34
24.02
38.05
57.56
21.31
35.73
56.53
85.39
30.09
50.32
79.66
120.39
53.85
89.97
142.32
214.82
86.74
144.47
228.50
344.70
179.88
299.39
472.46
710.75
Suction Lines ( t = 2°F)
0.39
0.76
1.71
3.36
7.20
10.96
25.45
40.49
71.55
145.57
262.52
424.04
867.50
1569.40
2507.30
3246.34
4678.48
3.44
0.53
1.00
1.70
2.63
5.31
9.23
14.57
30.06
52.96
84.33
125.18
176.20
313.91
502.77
1037.34
40
0.40
0.79
1.78
3.48
7.45
11.35
26.36
41.93
74.10
150.75
272.21
439.72
898.42
1625.34
2600.54
3362.07
4845.26
3.55
0.56
1.04
1.77
2.73
5.52
9.60
15.14
31.29
55.04
87.66
129.88
182.83
325.75
521.74
1076.62
–60
0.44
0.86
1.93
3.79
8.12
12.37
28.71
45.67
80.71
164.20
296.49
478.94
978.56
1770.31
2832.50
3661.96
5277.44
0.51
0.99
2.24
4.38
9.39
14.31
33.22
52.84
93.38
189.98
343.04
554.13
1132.18
2048.23
3277.16
4236.83
6105.92
0.54
1.06
2.38
4.66
9.99
15.21
35.33
56.19
99.31
202.03
364.80
589.28
1203.99
2178.15
3485.04
4505.59
6493.24
0.57
1.12
2.51
4.92
10.54
16.06
37.29
59.31
104.82
213.24
385.05
621.99
1270.82
2299.05
3678.47
4755.67
6853.65
3.55
0.79
1.48
2.51
3.87
7.81
13.58
21.41
44.26
77.85
124.00
183.71
258.61
460.78
738.00
1522.89
40
1.3
2.1
3.9
6.5
11.6
16.0
30.4
43.3
66.9
115.3
181.1
261.7
453.2
714.4
1024.6
1249.2
1654.7
Velocity =
100 fpm
1.3
2.1
3.1
4.4
7.5
11.4
16.1
28.0
43.2
61.7
83.5
108.5
169.1
243.1
424.6
1.9
3.8
8.6
16.9
36.3
55.3
128.4
204.7
361.6
735.6
1328.2
2148.0
4394.4
7938.5
12,681.8
16,419.6
23,662.2
t = 1°F
Drop
p = 3.6
2.6
4.9
8.1
12.8
25.9
45.2
71.4
147.9
261.2
416.2
618.4
871.6
1554.2
2497.7
5159.7
See note a
Liquid Lines
Discharge
Line
0.870
0.922
0.974
1.009
1.026
1.043
4.3
8.5
19.2
37.5
80.3
122.3
283.5
450.9
796.8
1623.0
2927.2
4728.3
9674.1
17,477.4
27,963.7
36,152.5
52,101.2
t = 5°F
Drop
p = 17.4
6.09
11.39
18.87
29.81
60.17
104.41
164.68
339.46
597.42
950.09
1407.96
1982.40
3525.99
5648.67
11660.71
4. Tons based on standard refrigerant cycle of 105°F liquid and saturated Cond. Sucevaporator outlet temperature. Liquid tons based on 20°F evaporator Temp., tion
temperature.
°F
Line
5. Thermophysical properties and viscosity data based on calculations
80 1.246
from NIST REFPROP program Version 6.01.
90 1.150
6. For brazed Type L copper tubing larger than 1 1/8 in. OD for discharge
100 1.051
or liquid service, see Safety Requirements section.
110 0.948
7. Values based on 105°F condensing temperature. Multiply table capacities by the following factors for other condensing temperatures.
120 0.840
130 0.723
0.47
0.93
2.09
4.09
8.77
13.35
31.01
49.32
87.16
177.32
320.19
517.21
1056.75
1911.78
3058.84
3954.59
5699.16
Saturated Suction Temperature, °F
–40
–20
0
20
Corresponding p, psi/100 ft
3.55
3.55
3.55
3.55
0.61
0.65
0.70
0.75
1.14
1.23
1.31
1.40
1.93
2.09
2.23
2.38
2.98
3.22
3.44
3.66
6.01
6.49
6.96
7.40
10.46
11.29
12.10
12.87
16.49
17.80
19.07
20.28
34.08
36.80
39.43
41.93
59.95
64.74
69.36
73.76
95.48
103.11
110.47
117.48
141.46
152.76
163.67
174.05
199.13
215.05
230.40
245.01
354.81
383.16
410.51
436.55
568.28
613.69
657.49
699.20
1172.66
1266.36
1356.75
1442.81
Discharge Lines ( t = 1°F, p = 3.55 psi)
Suction, Discharge, and Liquid Line Capacities in Tons for Refrigerant 404A (Single- or High-Stage Applications)
shown is recommended where any gas Notes: 1. Table capacities are in tons of refrigeration.
p = pressure drop from line friction, psi per 100 ft of equivalent line length
generated in receiver must return up condent = corresponding change in saturation temperature, °F per 100 ft
sate line to condenser without restricting condensate flow. Water-cooled condensers, where
2. Line capacity for other saturation temperatures t and equivalent lengths Le
receiver ambient temperature may be higher
0.55
Table L
Actual -t
Line capacity = Table capacity ----------------------e- ---------------------than refrigerant condensing temperature, fall
Actual
L
Table
t
e
into this category.
b Pipe inside diameter is same as nominal pipe
3. Saturation temperature t for other capacities and equivalent lengths Le
1.8
size.
L e Actual capacity
t = Table t Actual
----------------------- -------------------------------------
Table L e Table capacity
a Sizing
Type L
Copper,
OD
1/2
5/8
3/4
7/8
1 1/8
1 3/8
1 5/8
2 1/8
2 5/8
3 1/8
3 5/8
4 1/8
5 1/8
6 1/8
8 1/8
Steel
IPS SCH
3/8 80
1/2 80
3/4 80
1
80
1 1/4 80
1 1/2 80
2
40
2 1/2 40
3
40
4
40
5
40
6
40
8
40
10 40
12 IDb
14 30
16 30
Line Size
Table 6
1.6
2010 ASHRAE Handbook—Refrigeration
Licensee=AECOM User Geography and Business Line/5906698001, User=Irlandez, Jendl
Not for Resale, 10/17/2011 15:40:15 MDT
Copyright ASHRAE
Provided by IHS under license with ASHRAE
No reproduction or networking permitted without license from IHS
0.04
0.08
0.18
0.35
0.76
1.16
2.70
4.31
7.63
15.57
28.10
45.48
93.13
168.64
269.75
349.22
503.20
0.67
0.05
0.09
0.16
0.25
0.50
0.88
1.39
2.91
5.15
8.24
12.27
17.34
31.09
49.99
103.91
–60
Suction Lines ( t = 2°F)
0.07
0.14
0.31
0.61
1.32
2.01
4.68
7.45
13.19
26.88
48.52
78.45
160.66
290.60
464.87
601.87
866.37
0.12
0.23
0.51
1.01
2.16
3.29
7.65
12.18
21.54
43.92
79.19
128.06
261.94
473.82
758.01
979.92
1414.32
0.18
0.35
0.80
1.57
3.36
5.12
11.89
18.93
33.45
68.12
122.99
198.91
406.93
735.12
1174.36
1520.49
2191.17
0.27
0.53
1.20
2.34
5.02
7.65
17.76
28.24
49.90
101.75
183.27
296.40
606.38
1095.44
1752.56
2269.19
3265.09
Saturated Suction Temperature, °F
–40
–20
0
20
Corresponding p, psi/100 ft
1.01
1.46
2.02
2.71
0.09
0.15
0.24
0.37
0.17
0.28
0.45
0.69
0.28
0.48
0.77
1.17
0.44
0.74
1.18
1.81
0.90
1.51
2.40
3.66
1.57
2.63
4.18
6.35
2.48
4.17
6.61
10.04
5.17
8.65
13.70
20.76
9.14
15.27
24.19
36.62
14.61
24.40
38.55
58.29
21.75
36.22
57.15
86.47
30.66
51.13
80.55
121.93
54.88
91.25
143.93
217.14
88.20
146.87
230.77
348.36
182.97
303.62
477.80
720.09
0.39
0.77
1.74
3.41
7.32
11.15
25.88
41.17
72.75
148.00
266.91
431.69
882.01
1595.65
2553.03
3300.65
4756.74
3.6
0.55
1.02
1.74
2.68
5.41
9.41
14.84
30.66
54.04
85.90
127.52
179.33
319.89
512.29
1057.14
40
0.40
0.78
1.76
3.45
7.39
11.26
26.15
41.59
73.50
149.53
270.00
436.14
891.10
1612.10
2579.36
3334.69
4805.79
3.65
0.55
1.04
1.76
2.72
5.48
9.54
15.04
31.03
54.69
86.95
129.07
181.70
323.48
518.62
1070.49
–60
0.43
0.86
1.93
3.77
8.08
12.30
28.56
45.43
80.29
163.33
294.93
476.41
973.39
1760.97
2817.55
3642.64
5249.60
0.51
0.99
2.24
4.38
9.39
14.30
33.20
52.80
93.32
189.84
342.79
553.73
1131.36
2046.75
3274.79
4233.77
6101.51
0.54
1.06
2.39
4.67
10.00
15.23
35.36
56.24
99.39
202.20
365.11
589.78
1205.02
2180.00
3488.00
4509.42
6498.76
0.57
1.12
2.52
4.94
10.57
16.10
37.38
59.45
105.06
213.74
385.94
623.44
1273.79
2304.41
3687.06
4766.76
6869.63
3.65
0.79
1.48
2.52
3.89
7.84
13.63
21.50
44.36
78.18
124.29
184.50
259.74
462.40
741.34
1530.21
40
1.2
2.1
3.8
6.3
11.2
15.5
29.4
41.9
64.6
111.4
174.9
252.8
437.7
690.0
989.6
1206.5
1598.2
Velocity =
100 fpm
1.3
2.0
3.0
4.2
7.2
11.0
15.6
27.1
41.8
59.6
80.6
104.8
163.3
234.8
410.1
1.9
3.7
8.4
16.4
35.2
53.8
124.8
198.9
351.5
714.9
1290.8
2087.5
4270.8
7715.1
12,324.9
15,957.5
22,996.2
t = 1°F
Drop
p = 3.65
2.5
4.7
7.9
12.5
25.2
44.0
69.5
144.0
254.3
405.2
601.0
847.0
1513.6
2427.4
5019.4
See note a
Liquid Lines
Discharge
Line
0.873
0.924
0.975
1.005
1.014
1.024
4.2
8.3
18.7
36.6
78.4
119.4
276.7
440.6
777.9
1586.3
2857.5
4622.0
9443.9
17,086.7
27,298.3
35,292.2
50,861.5
t = 5°F
Drop
p = 17.8
5.96
11.13
18.45
29.14
58.74
102.09
161.04
331.97
584.28
929.27
1377.19
1935.27
3449.44
5526.55
11,383.18
4. Tons based on standard refrigerant cycle of 105°F liquid and saturated Cond. Sucevaporator outlet temperature. Liquid tons based on 20°F evaporator Temp., tion
temperature.
°F
Line
5. Thermophysical properties and viscosity data based on calculations
80 1.267
from NIST REFPROP program Version 6.01.
90 1.163
6. For brazed Type L copper tubing larger than 1 1/8 in. OD for discharge
100 1.055
or liquid service, see Safety Requirements section.
110 0.944
7. Values based on 105°F condensing temperature. Multiply table capacities by the following factors for other condensing temperatures.
120 0.826
130 0.701
0.47
0.93
2.09
4.08
8.74
13.32
30.93
49.19
86.93
176.85
319.34
515.85
1053.96
1906.72
3050.75
3944.13
5684.09
Saturated Suction Temperature, °F
–40
–20
0
20
Corresponding p, psi/100 ft
3.65
3.65
3.65
3.65
0.60
0.65
0.70
0.75
1.13
1.22
1.31
1.40
1.92
2.08
2.24
2.38
2.97
3.22
3.45
3.68
5.99
6.49
6.96
7.41
10.42
11.28
12.11
12.90
16.43
17.79
19.09
20.34
33.90
36.70
39.40
41.96
59.74
64.68
69.43
73.96
94.98
102.84
110.39
117.58
140.99
152.66
163.87
174.54
198.48
214.91
230.69
245.71
353.35
382.60
410.70
437.44
566.52
613.40
658.45
701.32
1169.35
1266.13
1359.11
1447.60
Discharge Lines ( t = 1°F, p = 3.65 psi)
shown is recommended where any gas Notes: 1. Table capacities are in tons of refrigeration.
p = pressure drop from line friction, psi per 100 ft of equivalent line length
generated in receiver must return up condent = corresponding change in saturation temperature, °F per 100 ft
sate line to condenser without restricting condensate flow. Water-cooled condensers,
2. Line capacity for other saturation temperatures t and equivalent lengths Le
where receiver ambient temperature may be
0.55
Table L
Actual t
Line capacity = Table capacity ----------------------e- -----------------------
higher than refrigerant condensing temperaActual
L
Table
t
e
ture, fall into this category.
b Pipe inside diameter is same as nominal pipe
3. Saturation temperature t for other capacities and equivalent lengths Le
1.8
size.
L e Actual capacity
t = Table t Actual
----------------------- -------------------------------------
Table
capacity
Table
L
e
a Sizing
Type L
Copper,
OD
1/2
5/8
3/4
7/8
1 1/8
1 3/8
1 5/8
2 1/8
2 5/8
3 1/8
3 5/8
4 1/8
5 1/8
6 1/8
8 1/8
Steel
IPS SCH
3/8 80
1/2 80
3/4 80
1
80
1 1/4 80
1 1/2 80
2
40
2 1/2 40
3
40
4
40
5
40
6
40
8
40
10 40
12 IDb
14 30
16 30
Line Size
Suction, Discharge, and Liquid Line Capacities in Tons for Refrigerant 507A (Single- or High-Stage Applications)
--``,`,,``,,,`,,,````,``````,,``-`-`,,`,,`,`,,`---
Table 7
Halocarbon Refrigeration Systems
1.7
Licensee=AECOM User Geography and Business Line/5906698001, User=Irlandez, Jendl
Not for Resale, 10/17/2011 15:40:15 MDT
Copyright ASHRAE
Provided by IHS under license with ASHRAE
No reproduction or networking permitted without license from IHS
0.32
0.62
1.41
2.75
5.90
9.01
20.91
33.29
58.81
119.77
216.23
349.71
715.45
1292.44
2064.68
2673.23
3852.37
0.46
0.91
2.04
4.00
8.58
13.06
30.32
48.23
85.22
173.76
312.97
506.16
1035.51
1870.67
2992.85
3875.08
5575.79
0.08
0.16
0.35
0.69
1.49
2.28
5.30
8.46
14.98
30.58
55.19
89.34
182.90
331.22
529.89
685.86
988.28
0.21
0.41
0.93
1.83
3.92
5.98
13.89
22.13
39.10
79.68
143.84
232.61
475.80
860.67
1376.89
1779.99
2569.05
0.13
0.26
0.59
1.15
2.48
3.79
8.80
14.02
24.81
50.56
91.27
147.57
301.82
546.64
873.19
1130.48
1628.96
0.84
0.10
0.18
0.31
0.48
0.98
1.72
2.73
5.69
10.09
16.15
24.06
33.98
60.95
98.05
203.77
–60
Suction Lines (t = 2°F)
Saturated Suction Temperature, °F
–40
–20
0
20
Corresponding p, psi/100 ft
1.27
1.85
2.57
3.46
0.17
0.27
0.42
0.62
0.31
0.51
0.79
1.17
0.53
0.87
1.35
2.00
0.83
1.35
2.08
3.08
1.69
2.74
4.22
6.23
2.95
4.78
7.34
10.85
4.67
7.56
11.61
17.14
9.71
15.71
24.05
35.45
17.17
27.74
42.45
62.53
27.44
44.24
67.77
99.53
40.84
65.81
100.50
147.66
57.58
92.66
141.61
208.22
103.03
165.73
253.05
370.82
166.00
266.14
405.75
594.85
344.31
551.73
840.04
1229.69
0.65
1.27
2.86
5.59
12.00
18.27
42.43
67.48
119.26
242.63
437.56
707.69
1445.92
2615.83
4185.32
5410.92
7797.98
4.5
0.89
1.67
2.84
4.39
8.86
15.41
24.28
50.19
88.43
140.83
208.65
293.70
523.21
839.82
1733.02
40
0.81
1.59
3.59
7.02
15.03
22.89
53.16
84.56
149.44
304.02
548.97
886.76
1811.80
3277.74
5244.38
6780.14
9771.20
4.75
1.13
2.11
3.59
5.53
11.16
19.39
30.63
63.20
111.20
177.12
262.44
369.45
658.32
1054.47
2176.50
–60
0.84
1.66
3.74
7.32
15.67
23.86
55.41
88.14
155.76
316.88
572.20
924.29
1888.48
3416.46
5466.33
7067.08
10,184.73
0.91
1.78
4.02
7.86
16.83
25.64
59.54
94.70
167.36
340.47
614.79
993.09
2029.05
3670.77
5873.23
7593.13
10,942.85
0.93
1.84
4.14
8.10
17.34
26.41
61.32
97.53
172.37
350.66
633.19
1022.80
2089.76
3780.59
6048.94
7820.29
11,270.23
0.95
1.88
4.23
8.28
17.74
27.01
62.73
99.77
176.32
358.70
647.71
1046.26
2137.68
3867.29
6187.65
7999.63
11,528.68
4.75
1.33
2.49
4.23
6.52
13.17
22.88
36.14
74.57
131.20
208.98
309.64
435.90
776.72
1244.13
2567.98
40
1.9
3.2
6.0
10.0
17.7
24.4
46.4
66.2
102.2
176.1
276.5
399.6
692.0
1090.7
1564.3
1907.2
2526.4
Velocity =
100 fpm
2.0
3.2
4.7
6.7
11.4
17.4
24.6
42.8
66.0
94.2
127.4
165.7
258.2
371.1
648.3
3.4
6.7
15.1
29.5
63.3
96.6
224.2
356.5
630.0
1284.6
2313.7
3741.9
7655.3
13,829.2
22,125.4
28,647.5
41,220.5
t = 1°F
Drop
p = 4.75
4.6
8.6
14.3
22.6
45.8
79.7
125.9
260.7
459.7
733.0
1087.5
1530.2
2729.8
4383.7
9049.5
See note a
Liquid Lines
Discharge
Line
0.815
0.889
0.963
1.032
1.096
1.160
7.6
15.0
33.6
65.8
140.9
214.7
498.0
793.0
1398.4
2851.7
5137.0
8308.9
16,977.6
30,716.4
49,074.9
63,445.8
91,435.1
t = 5°F
Drop
p = 23.3
10.81
20.24
33.53
52.92
106.59
185.04
291.48
601.13
1056.39
1680.52
2491.00
3500.91
6228.40
9980.43
20,561.73
4. Tons based on standard refrigerant cycle of 105°F liquid and saturated Cond. Sucevaporator outlet temperature. Liquid tons based on 20°F evaporator Temp., tion
temperature.
°F
Line
5. Thermophysical properties and viscosity data based on calculations
80 1.170
from NIST REFPROP program Version 6.01.
90 1.104
6. For brazed Type L copper tubing larger than 5/8 in. OD for discharge
100 1.035
or liquid service, see Safety Requirements section.
7. Values based on 105°F condensing temperature. Multiply table capac110 0.964
ities by the following factors for other condensing temperatures.
120 0.889
130 0.808
0.88
1.73
3.88
7.60
16.28
24.79
57.57
91.57
161.82
329.21
594.46
960.25
1961.96
3549.40
5679.03
7342.06
10,581.02
Saturated Suction Temperature, °F
–40
–20
0
20
Corresponding p, psi/100 ft
4.75
4.75
4.75
4.75
1.17
1.22
1.26
1.30
2.20
2.29
2.36
2.43
3.74
3.88
4.02
4.14
5.76
5.99
6.19
6.38
11.64
12.09
12.50
12.88
20.21
21.00
21.72
22.37
31.92
33.16
34.30
35.33
65.88
68.44
70.78
72.90
115.90
120.41
124.53
128.25
184.62
191.80
198.36
204.29
273.54
284.19
293.90
302.70
385.08
400.07
413.75
426.13
686.18
712.88
737.26
759.31
1099.10
1141.87
1180.91
1216.24
2268.62
2356.89
2437.49
2510.41
Discharge Lines (t = 1°F, p = 4.75 psi)
shown is recommended where any gas Notes: 1. Table capacities are in tons of refrigeration.
p = pressure drop from line friction, psi per 100 ft of equivalent line length
generated in receiver must return up condent = corresponding change in saturation temperature, °F per 100 ft
sate line to condenser without restricting condensate flow. Water-cooled condensers,
2. Line capacity for other saturation temperatures t and equivalent lengths Le
where receiver ambient temperature may be
0.55
Table L
Actual t
Line capacity = Table capacity ----------------------e- -----------------------
higher than refrigerant condensing temperaActual
L
Table
t
e
ture, fall into this category.
b Pipe inside diameter is same as nominal pipe
3. Saturation temperature t for other capacities and equivalent lengths Le
1.8
size.
L e Actual capacity
t = Table t Actual
----------------------- -------------------------------------
Table
capacity
Table
L
e
a Sizing
Type L
Copper,
OD
1/2
5/8
3/4
7/8
1 1/8
1 3/8
1 5/8
2 1/8
2 5/8
3 1/8
3 5/8
4 1/8
5 1/8
6 1/8
8 1/8
Steel
IPS SCH
3/8 80
1/2 80
3/4 80
1
80
1 1/4 80
1 1/2 80
2
40
2 1/2 40
3
40
4
40
5
40
6
40
8
40
10 40
12 IDb
14 30
16 30
Line Size
Suction, Discharge, and Liquid Line Capacities in Tons for Refrigerant 410A (Single- or High-Stage Applications)
--``,`,,``,,,`,,,````,``````,,``-`-`,,`,,`,`,,`---
Table 8
1.8
2010 ASHRAE Handbook—Refrigeration
Licensee=AECOM User Geography and Business Line/5906698001, User=Irlandez, Jendl
Not for Resale, 10/17/2011 15:40:15 MDT
Copyright ASHRAE
Provided by IHS under license with ASHRAE
No reproduction or networking permitted without license from IHS
0.04
0.07
0.16
0.32
0.69
1.06
2.49
3.97
7.04
14.38
26.00
42.13
86.32
156.54
250.23
324.38
468.29
0.435
0.04
0.08
0.14
0.21
0.44
0.77
1.23
2.56
4.55
7.30
10.90
15.42
27.70
44.70
92.98
–60
0.07
0.13
0.30
0.58
1.25
1.91
4.46
7.11
12.59
25.70
46.36
75.15
153.84
278.57
445.65
576.93
831.27
0.11
0.22
0.50
0.98
2.10
3.21
7.47
11.90
21.05
42.97
77.55
125.49
256.66
464.86
742.54
961.33
1385.24
0.18
0.35
0.80
1.57
3.37
5.13
11.93
19.01
33.59
68.47
123.61
199.88
408.86
739.58
1183.19
1529.58
2204.17
0.27
0.54
1.22
2.38
5.12
7.79
18.13
28.83
50.94
103.84
187.25
302.82
619.47
1120.60
1790.17
2317.81
3340.17
Saturated Suction Temperature, °F
–40
–20
0
20
Corresponding p, psi/100 ft
0.7
1.06
1.55
2.16
0.08
0.14
0.23
0.36
0.15
0.26
0.43
0.68
0.26
0.45
0.74
1.16
0.40
0.70
1.15
1.79
0.82
1.42
2.33
3.63
1.43
2.48
4.07
6.33
2.27
3.93
6.44
10.00
4.74
8.18
13.37
20.72
8.42
14.49
23.64
36.62
13.47
23.15
37.76
58.34
20.08
34.44
56.15
86.64
28.37
48.62
79.21
122.10
50.85
86.97
141.60
218.05
81.91
140.04
227.86
350.42
170.14
290.93
471.55
725.11
Suction Lines (t = 2°F)
0.40
0.79
1.79
3.50
7.50
11.44
26.57
42.25
74.66
152.24
274.21
443.47
907.26
1638.95
2622.17
3395.13
4885.19
2.92
0.54
1.02
1.74
2.68
5.42
9.45
14.93
30.90
54.50
86.88
128.89
181.34
323.50
519.62
1072.54
40
0.52
1.02
2.29
4.50
9.63
14.66
34.04
54.25
95.76
195.04
351.31
568.16
1162.36
2102.83
3359.45
4349.77
6258.81
3.3
0.71
1.33
2.26
3.48
7.05
12.25
19.33
39.99
70.56
112.34
166.39
234.63
417.91
670.58
1383.29
–60
0.55
1.07
2.42
4.74
10.15
15.46
35.89
57.21
100.99
205.68
370.46
599.14
1225.74
2217.49
3542.64
4586.95
6600.09
0.57
1.13
2.54
4.99
10.68
16.26
37.75
60.16
106.21
216.31
389.62
630.12
1289.12
2332.15
3725.82
4824.14
6941.37
0.60
1.18
2.66
5.22
11.18
17.03
39.54
63.02
111.24
226.57
408.09
659.99
1350.24
2442.72
3902.46
5052.85
7270.46
0.63
1.23
2.78
5.44
11.65
17.74
41.20
65.66
115.90
236.06
425.19
687.65
1406.83
2545.10
4066.02
5264.62
7575.17
Saturated Suction Temperature, °F
–40
–20
0
20
Corresponding p, psi/100 ft
3.3
3.3
3.3
3.3
0.75
0.78
0.82
0.86
1.40
1.47
1.54
1.61
2.38
2.50
2.62
2.73
3.67
3.86
4.05
4.22
7.43
7.82
8.19
8.53
12.92
13.59
14.23
14.83
20.39
21.44
22.46
23.40
42.17
44.35
46.45
48.40
74.41
78.25
81.96
85.40
118.47
124.59
130.50
135.97
175.47
184.54
193.29
201.39
247.42
260.22
272.56
283.98
440.69
463.48
485.46
505.80
707.15
743.71
778.97
811.62
1458.72
1534.15
1606.88
1674.23
Discharge Lines (t = 1°F, p = 3.3 psi)
0.65
1.28
2.88
5.65
12.10
18.43
42.79
68.19
120.38
245.18
441.61
714.21
1461.15
2643.38
4223.03
5467.92
7867.69
3.3
0.89
1.67
2.84
4.38
8.86
15.40
24.30
50.27
88.70
141.22
209.17
294.95
525.33
842.96
1738.88
40
2.0
3.4
6.2
10.3
18.4
25.4
48.1
68.6
106.0
182.6
286.8
414.5
717.7
1131.3
1622.5
1978.2
2620.4
Velocity =
100 fpm
2.1
3.4
4.9
6.9
11.8
18.0
25.5
44.4
68.5
97.7
132.2
171.8
267.8
385.0
672.4
Suction, Discharge, and Liquid Line Capacities in Tons for Refrigerant 407C (Single- or High-Stage Applications)
2.9
5.7
12.8
25.1
53.7
82.0
190.3
303.2
535.7
1092.0
1969.0
3184.3
6514.5
11,784.6
18,826.0
24,374.8
35,126.4
t = 1°F
Drop
p = 3.5
3.8
7.1
11.8
18.7
37.9
66.2
104.7
217.1
383.7
611.3
907.9
1281.5
2288.8
3676.9
7599.4
See note a
Liquid Lines
Discharge
Line
0.787
0.872
0.957
1.036
1.109
1.182
6.4
12.6
28.4
55.6
118.9
181.1
420.6
669.0
1182.3
2405.3
4343.2
7015.7
14,334.3
25,932.3
41,491.5
53,641.7
77,305.8
t = 5°F
Drop
p = 16.9
8.90
16.68
27.66
43.73
88.21
153.45
241.93
499.23
879.85
1401.50
2076.59
2923.40
5209.13
8344.10
17,220.64
4. Tons based on standard refrigerant cycle of 105°F liquid and saturated Cond. Sucshown is recommended where any gas Notes: 1. Table capacities are in tons of refrigeration.
p = pressure drop from line friction, psi per 100 ft of equivalent line length
evaporator outlet temperature. Liquid tons based on 20°F evaporator Temp., tion
generated in receiver must return up condent = corresponding change in saturation temperature, °F per 100 ft
temperature.
sate line to condenser without restricting con°F
Line
5. Thermophysical properties and viscosity data based on calculations
densate flow. Water-cooled condensers,
2. Line capacity for other saturation temperatures t and equivalent lengths Le
80 1.163
from NIST REFPROP program Version 6.01.
where receiver ambient temperature may be
0.55
Table L
90 1.099
Actual t
Line capacity = Table capacity ----------------------e- -----------------------
6. For brazed Type L copper tubing larger than 2 1/8 in. OD for discharge
higher than refrigerant condensing temperaActual
L
Table
t
e
100 1.033
or liquid service, see Safety Requirements section.
ture, fall into this category.
b Pipe inside diameter is same as nominal pipe
3. Saturation temperature t for other capacities and equivalent lengths Le
110 0.966
7. Values based on 105°F condensing temperature. Multiply table capac1.8
size.
ities by the following factors for other condensing temperatures.
120 0.896
L e Actual capacity
t = Table t Actual
--``,`,,``,,,`,,,````,``````,,``-`-`,,`,,`,`,,`-- ----------------------- -------------------------------------
130 0.824
Table
capacity
Table
L
e
a Sizing
Type L
Copper,
OD
1/2
5/8
3/4
7/8
1 1/8
1 3/8
1 5/8
2 1/8
2 5/8
3 1/8
3 5/8
4 1/8
5 1/8
6 1/8
8 1/8
Steel
IPS SCH
3/8 80
1/2 80
3/4 80
1
80
1 1/4 80
1 1/2 80
2
40
2 1/2 40
3
40
4
40
5
40
6
40
8
40
10 40
12 IDb
14 30
16 30
Line Size
Table 9
Halocarbon Refrigeration Systems
1.9
Licensee=AECOM User Geography and Business Line/5906698001, User=Irlandez, Jendl
Not for Resale, 10/17/2011 15:40:15 MDT
1.10
2010 ASHRAE Handbook—Refrigeration
Refrigerant Line Capacity Tables
Tables 3 to 9 show line capacities in tons of refrigeration for
R-22, R-134A, R-404A, R-507A, R-410A, and R-407C. Capacities
in the tables are based on the refrigerant flow that develops a friction
loss, per 100 ft of equivalent pipe length, corresponding to a 2°F
change in the saturation temperature (t) in the suction line, and a
1°F change in the discharge line. The capacities shown for liquid
lines are for pressure losses corresponding to 1 and 5°F change in
saturation temperature and also for velocity corresponding to
100 fpm. Tables 10 to 15 show capacities for the same refrigerants
based on reduced suction line pressure loss corresponding to 1.0 and
0.5°F per 100 ft equivalent length of pipe. These tables may be used
when designing system piping to minimize suction line pressure
drop.
The refrigerant line sizing capacity tables are based on the DarcyWeisbach relation and friction factors as computed by the Colebrook function (Colebrook 1938, 1939). Tubing roughness height is
0.000005 ft for copper and 0.00015 ft for steel pipe. Viscosity extrapolations and adjustments for pressures other than 1 atm were based
on correlation techniques as presented by Keating and Matula (1969).
Discharge gas superheat was 80°F for R-134a and 105°F for R-22.
The refrigerant cycle for determining capacity is based on saturated gas leaving the evaporator. The calculations neglect the presence of oil and assume nonpulsating flow.
For additional charts and discussion of line sizing refer to
Atwood (1990), Timm (1991), and Wile (1977).
Equivalent Lengths of Valves and Fittings
Refrigerant line capacity tables are based on unit pressure drop
per 100 ft length of straight pipe, or per combination of straight
pipe, fittings, and valves with friction drop equivalent to a 100 ft
length of straight pipe.
Generally, pressure drop through valves and fittings is determined
by establishing the equivalent straight length of pipe of the same size
with the same friction drop. Line sizing tables can then be used
directly. Tables 16 to 18 give equivalent lengths of straight pipe for
various fittings and valves, based on nominal pipe sizes.
The following example illustrates the use of various tables and
charts to size refrigerant lines.
Example 2. Determine the line size and pressure drop equivalent (in
degrees) for the suction line of a 30 ton R-22 system, operating at 40°F
suction and 100°F condensing temperatures. Suction line is copper tubing, with 50 ft of straight pipe and six long-radius elbows.
Solution: Add 50% to the straight length of pipe to establish a trial
equivalent length. Trial equivalent length is 50 1.5 = 75 ft. From Table
3 (for 40°F suction, 105°F condensing), 33.1 tons capacity in 2 1/8 in.
OD results in a 2°F loss per 100 ft equivalent length. Referring to Note 4,
Table 3, capacity at 40°F evaporator and 100°F condensing temperature
is 1.03 33.1 = 34.1 ton. This trial size is used to evaluate actual equivalent length.
Straight pipe length
Six 2 in. long-radius elbows at 3 ft each (Table 16)
=
=
50.0 ft
19.8 ft
Total equivalent length
=
69.8 ft
t =
2(69.8/100)(30/34.1)1.8
= 1.1°F or 1.6 psi
Oil Management in Refrigerant Lines
Oil Circulation. All compressors lose some lubricating oil during normal operation. Because oil inevitably leaves the compressor
with the discharge gas, systems using halocarbon refrigerants must
return this oil at the same rate at which it leaves (Cooper 1971).
Oil that leaves the compressor or oil separator reaches the condenser and dissolves in the liquid refrigerant, enabling it to pass
readily through the liquid line to the evaporator. In the evaporator,
the refrigerant evaporates, and the liquid phase becomes enriched
in oil. The concentration of refrigerant in the oil depends on the
evaporator temperature and types of refrigerant and oil used. The
viscosity of the oil/refrigerant solution is determined by the system
parameters. Oil separated in the evaporator is returned to the
compressor by gravity or by drag forces of the returning gas. Oil’s
effect on pressure drop is large, increasing the pressure drop by as
much as a factor of 10 (Alofs et al. 1990).
One of the most difficult problems in low-temperature refrigeration systems using halocarbon refrigerants is returning lubrication
oil from the evaporator to the compressors. Except for most centrifugal compressors and rarely used nonlubricated compressors, refrigerant continuously carries oil into the discharge line from the
compressor. Most of this oil can be removed from the stream by an
oil separator and returned to the compressor. Coalescing oil separators are far better than separators using only mist pads or baffles;
however, they are not 100% effective. Oil that finds its way into the
system must be managed.
Oil mixes well with halocarbon refrigerants at higher temperatures. As temperature decreases, miscibility is reduced, and some
oil separates to form an oil-rich layer near the top of the liquid
level in a flooded evaporator. If the temperature is very low, the oil
becomes a gummy mass that prevents refrigerant controls from
functioning, blocks flow passages, and fouls heat transfer surfaces. Proper oil management is often key to a properly functioning system.
In general, direct-expansion and liquid overfeed system evaporators have fewer oil return problems than do flooded system evaporators because refrigerant flows continuously at velocities high
enough to sweep oil from the evaporator. Low-temperature systems
using hot-gas defrost can also be designed to sweep oil out of the
circuit each time the system defrosts. This reduces the possibility of
oil coating the evaporator surface and hindering heat transfer.
Flooded evaporators can promote oil contamination of the
evaporator charge because they may only return dry refrigerant
vapor back to the system. Skimming systems must sample the oilrich layer floating in the drum, a heat source must distill the refrigerant, and the oil must be returned to the compressor. Because
flooded halocarbon systems can be elaborate, some designers
avoid them.
System Capacity Reduction. Using automatic capacity control
on compressors requires careful analysis and design. The compressor can load and unload as it modulates with system load requirements through a considerable range of capacity. A single compressor
can unload down to 25% of full-load capacity, and multiple compressors connected in parallel can unload to a system capacity of 12.5%
or lower. System piping must be designed to return oil at the lowest
loading, yet not impose excessive pressure drops in the piping and
equipment at full load.
Oil Return up Suction Risers. Many refrigeration piping systems contain a suction riser because the evaporator is at a lower level
than the compressor. Oil circulating in the system can return up gas
risers only by being transported by returning gas or by auxiliary
means such as a trap and pump. The minimum conditions for oil
transport correlate with buoyancy forces (i.e., density difference
between liquid and vapor, and momentum flux of vapor) (Jacobs
et al. 1976).
The principal criteria determining the transport of oil are gas
velocity, gas density, and pipe inside diameter. Density of the oil/
refrigerant mixture plays a somewhat lesser role because it is almost
constant over a wide range. In addition, at temperatures somewhat
lower than –40°F, oil viscosity may be significant. Greater gas
velocities are required as temperature drops and the gas becomes
less dense. Higher velocities are also necessary if the pipe diameter
increases. Table 19 translates these criteria to minimum refrigeration capacity requirements for oil transport. Suction risers must be
sized for minimum system capacity. Oil must be returned to the
compressor at the operating condition corresponding to the minimum displacement and minimum suction temperature at which the
--``,`,,``,,,`,,,````,``````,,``-`-`,,`,,`,`,,`---
Copyright ASHRAE
Provided by IHS under license with ASHRAE
No reproduction or networking permitted without license from IHS
Licensee=AECOM User Geography and Business Line/5906698001, User=Irlandez, Jendl
Not for Resale, 10/17/2011 15:40:15 MDT
Halocarbon Refrigeration Systems
Table 10
Line Size
Type L
Copper,
OD
1/2
5/8
3/4
7/8
1 1/8
1 3/8
1 5/8
2 1/8
2 5/8
3 1/8
3 5/8
4 1/8
Steel
IPS
SCH
3/8
80
1/2
80
3/4
80
1
80
1 1/4
40
1 1/2
40
2
40
2 1/2
40
3
40
4
40
5
40
6
40
8
40
10
40
12
ID*
1.11
Suction Line Capacities in Tons for Refrigerant 22 (Single- or High-Stage Applications)
Saturated Suction Temperature, °F
–40
–20
0
20
40
t = 1°F t = 0.5°F t = 1°F t = 0.5°F t = 1°F t = 0.5°F t = 1°F t = 0.5°F t = 1°F t = 0.5°F
p = 0.393 p = 0.197 p = 0.577 p = 0.289 p = 0.813 p = 0.406 p = 1.104 p = 0.552 p = 1.455 p = 0.727
0.07
0.05
0.12
0.08
0.18
0.12
0.27
0.19
0.40
0.27
0.13
0.09
0.22
0.15
0.34
0.23
0.52
0.35
0.75
0.51
0.22
0.15
0.37
0.25
0.58
0.39
0.86
0.59
1.24
0.85
0.35
0.24
0.58
0.40
0.91
0.62
1.37
0.93
1.97
1.35
0.72
0.49
1.19
0.81
1.86
1.27
2.77
1.90
3.99
2.74
1.27
0.86
2.09
1.42
3.25
2.22
4.84
3.32
6.96
4.78
2.02
1.38
3.31
2.26
5.16
3.53
7.67
5.26
11.00
7.57
4.21
2.88
6.90
4.73
10.71
7.35
15.92
10.96
22.81
15.73
7.48
5.13
12.23
8.39
18.97
13.04
28.19
19.40
40.38
27.84
11.99
8.22
19.55
13.43
30.31
20.85
44.93
31.00
64.30
44.44
17.89
12.26
29.13
20.00
45.09
31.03
66.81
46.11
95.68
66.09
25.29
17.36
41.17
28.26
63.71
43.85
94.25
65.12
134.81
93.22
0.06
0.12
0.27
0.52
1.38
2.08
4.03
6.43
11.38
23.24
42.04
68.04
139.48
252.38
403.63
0.04
0.08
0.18
0.36
0.96
1.45
2.81
4.49
7.97
16.30
29.50
47.86
98.06
177.75
284.69
0.10
0.19
0.43
0.84
2.21
3.32
6.41
10.23
18.11
36.98
66.73
108.14
221.17
400.53
639.74
0.07
0.13
0.30
0.59
1.55
2.33
4.51
7.19
12.74
26.02
47.05
76.15
155.78
282.05
451.09
0.15
0.29
0.65
1.28
3.37
5.05
9.74
15.56
27.47
56.12
101.16
163.77
334.94
606.74
969.02
p = pressure drop from line friction, psi per 100 ft equivalent line length
t = change in saturation temperature corresponding to pressure drop, °F per 100 ft
Table 11
--``,`,,``,,,`,,,````,``````,,``-`-`,,`,,`,`,,`---
1/2
5/8
7/8
1 1/8
1 3/8
1 5/8
2 1/8
2 5/8
3 1/8
3 5/8
4 1/8
5 1/8
6 1/8
Steel
IPS
SCH
1/2
80
3/4
80
1
80
1 1/4
40
1 1/2
40
2
40
2 1/2
40
3
40
4
40
5
40
6
40
0.21
0.42
0.95
1.87
4.91
7.38
14.22
22.65
40.10
81.73
147.36
238.29
488.05
881.59
1410.30
0.15
0.30
0.67
1.31
3.45
5.19
10.01
15.95
28.23
57.53
103.82
168.07
344.19
622.51
995.80
0.30
0.60
1.35
2.64
6.93
10.42
20.07
31.99
56.52
115.24
207.59
335.71
686.71
1243.64
1987.29
0.21
0.42
0.95
1.86
4.88
7.33
14.14
22.53
39.79
81.21
146.38
236.70
484.74
876.79
1402.63
*Pipe inside diameter is same as nominal pipe size.
Suction Line Capacities in Tons for Refrigerant 134a (Single- or High-Stage Applications)
Line Size
Type L
Copper,
OD
0.10
0.20
0.46
0.89
2.36
3.55
6.85
10.93
19.34
39.49
71.27
115.21
236.21
427.75
683.22
0
10
t = 1°F
p = 0.60
Saturated Suction Temperature, °F
20
30
t = 0.5°F t = 1°F t = 0.5°F t = 1°F t = 0.5°F
p = 0.30 p = 0.71 p = 0.35 p = 0.83 p = 0.42
40
t = 1°F
p = 0.50
t = 0.5°F
p = 0.25
t = 1°F
p = 0.97
0.10
0.18
0.48
0.99
1.73
2.75
5.73
10.20
16.20
24.20
34.20
61.30
98.80
0.07
0.12
0.33
0.67
1.18
1.88
3.92
6.97
11.10
16.60
23.50
42.20
68.00
0.12
0.23
0.62
1.26
2.21
3.50
7.29
12.90
20.60
30.80
43.40
77.70
125.00
0.08
0.16
0.42
0.86
1.51
2.40
5.00
8.87
14.20
21.20
29.90
53.60
86.30
0.16
0.29
0.78
1.59
2.77
4.40
9.14
16.20
25.90
38.50
54.30
97.20
157.00
0.11
0.20
0.53
1.08
1.89
3.01
6.27
11.10
17.80
26.50
37.40
67.10
108.00
0.19
0.37
0.97
1.97
3.45
5.46
11.40
20.00
32.10
47.70
67.30
121.00
194.00
0.13
0.25
0.66
1.35
2.36
3.75
7.79
13.80
22.10
32.90
46.50
83.20
134.00
0.24
0.45
1.20
2.43
4.25
6.72
14.00
24.70
39.40
58.70
82.60
148.00
237.00
0.16
0.31
0.82
1.66
2.91
4.61
9.59
17.00
27.20
40.40
57.10
102.00
165.00
0.16
0.36
0.70
1.84
2.77
5.35
8.53
15.10
30.80
55.60
89.90
0.11
0.25
0.49
1.29
1.94
3.75
5.99
10.60
21.70
39.20
63.40
0.20
0.45
0.88
2.31
3.48
6.72
10.70
18.90
38.70
69.80
113.00
0.14
0.31
0.61
1.62
2.44
4.72
7.53
13.30
27.20
49.10
79.60
0.25
0.56
1.09
2.87
4.32
8.33
13.30
23.50
48.00
86.50
140.00
0.17
0.39
0.77
2.02
3.03
5.86
9.35
16.50
33.80
60.93
98.50
0.30
0.69
1.34
3.54
5.30
10.30
16.30
28.90
58.80
106.00
172.00
0.21
0.48
0.94
2.48
3.73
7.20
11.50
20.30
41.50
74.95
121.00
0.37
0.84
1.64
4.31
6.47
12.50
19.90
35.20
71.60
129.00
209.00
0.26
0.59
1.15
3.03
4.55
8.78
14.00
24.80
50.50
91.00
148.00
p = pressure drop from line friction, psi per 100 ft equivalent line length
t = change in saturation temperature corresponding to pressure drop, °F per 100 ft
Copyright ASHRAE
Provided by IHS under license with ASHRAE
No reproduction or networking permitted without license from IHS
Licensee=AECOM User Geography and Business Line/5906698001, User=Irlandez, Jendl
Not for Resale, 10/17/2011 15:40:15 MDT
t = 0.5°F
p = 0.48
Copyright ASHRAE
Provided by IHS under license with ASHRAE
No reproduction or networking permitted without license from IHS
80
80
80
80
40
40
40
40
40
40
40
40
40
40
ID*
30
30
0.02
0.04
0.08
0.17
0.36
0.55
1.30
2.07
3.68
7.53
13.61
22.07
45.29
82.09
131.47
170.14
245.48
0.02
0.04
0.07
0.11
0.23
0.40
0.63
1.33
2.36
3.78
5.64
7.99
14.35
23.17
48.33
0.03
0.06
0.10
0.16
0.33
0.59
0.93
1.94
3.45
5.53
8.24
11.66
20.91
33.70
70.16
0.03
0.05
0.12
0.24
0.52
0.80
1.86
2.96
5.25
10.75
19.42
31.37
64.28
116.63
186.39
241.28
348.15
t = 0.5°F
p = 0.16
t = 1°F
p = 0.32
0.05
0.09
0.21
0.42
0.91
1.39
3.24
5.16
9.13
18.64
33.64
54.45
111.50
201.92
322.98
418.14
602.49
0.06
0.11
0.19
0.29
0.60
1.05
1.67
3.48
6.17
9.87
14.70
20.74
37.20
59.82
124.35
t = 1°F
p = 0.485
–40
0.03
0.07
0.15
0.29
0.63
0.97
2.26
3.61
6.41
13.06
23.67
38.36
78.62
142.37
227.70
294.77
424.62
0.04
0.08
0.13
0.20
0.41
0.72
1.14
2.38
4.23
6.78
10.09
14.27
25.58
41.25
85.75
t = 0.5°F
p = 0.243
0.08
0.16
0.36
0.70
1.50
2.29
5.32
8.48
15.01
30.59
55.22
89.29
182.58
330.75
528.22
683.87
985.62
0.10
0.19
0.32
0.50
1.02
1.78
2.82
5.86
10.38
16.57
24.66
34.82
62.32
100.16
207.70
0.06
0.11
0.25
0.49
1.05
1.60
3.74
5.96
10.54
21.53
38.85
62.97
128.75
233.20
373.02
482.92
695.84
0.07
0.13
0.22
0.34
0.70
1.22
1.93
4.02
7.13
11.40
16.98
24.00
43.03
69.25
143.94
0.13
0.25
0.56
1.09
2.34
3.57
8.30
13.23
23.37
47.64
86.00
139.08
284.48
514.60
823.24
1064.28
1533.35
0.16
0.30
0.52
0.80
1.63
2.84
4.50
9.33
16.50
26.36
39.19
55.29
98.68
158.78
329.02
0.09
0.17
0.39
0.77
1.65
2.51
5.85
9.32
16.47
33.61
60.66
98.09
200.61
363.34
580.40
751.41
1082.76
0.11
0.21
0.35
0.55
1.12
1.95
3.09
6.42
11.37
18.17
27.05
38.19
68.35
109.86
228.24
Saturated Suction Temperature, °F
–20
0
t = 1°F
t = 0.5°F
t = 1°F
t = 0.5°F
p = 0.705
p = 0.353
p = 0.98
p = 0.49
20
0.13
0.26
0.59
1.15
2.46
3.76
8.73
13.92
24.59
50.12
90.47
146.31
299.27
541.35
866.05
1119.62
1613.40
0.17
0.32
0.54
0.84
1.70
2.98
4.71
9.78
17.30
27.63
41.08
57.95
103.62
166.38
344.71
t = 0.5°F
p = 0.655
Condensing
Temperature, °F
80
90
100
110
120
130
0.19
0.37
0.83
1.63
3.50
5.33
12.40
19.71
34.83
71.01
128.09
207.08
423.62
766.32
1224.19
1585.02
2284.15
0.25
0.46
0.79
1.22
2.48
4.33
6.84
14.19
25.04
39.90
59.27
83.67
149.15
239.61
496.00
t = 1°F
p = 1.31
Suction Line Capacities in Tons for Refrigerant 404A (Single- or High-Stage Applications)
Notes:
1. t = change in saturation temperature corresponding to pressure drop, °F per 100 ft.
2. Tons based on standard refrigerant cycle of 105°F liquid and saturated evaporator outlet temperature. Liquid tons based on 20°F evaporator temperature.
3. Thermophysical properties and viscosity data based on calculations from NIST REFPROP program Version 6.01.
4. Values based on 105°F condensing temperature. Multiply table capacities by the following factors for other condensing temperatures.
*Pipe inside diameter is same as nominal pipe size.
3/8
1/2
3/4
1
1 1/4
1 1/2
2
2 1/2
3
4
5
6
8
10
12
14
16
Type L
Copper,
OD
1/2
5/8
3/4
7/8
1 1/8
1 3/8
1 5/8
2 1/8
2 5/8
3 1/8
3 5/8
4 1/8
5 1/8
6 1/8
8 1/8
Steel
IPS SCH
–60
Table 12
--``,`,,``,,,`,,,````,``````,,``-`-`,,`,,`,`,,`---
Line Size
40
0.19
0.38
0.85
1.67
3.57
5.45
12.66
20.17
35.63
72.64
130.81
211.53
433.35
783.91
1252.32
1621.44
2336.63
0.25
0.47
0.80
1.24
2.52
4.40
6.95
14.42
25.48
40.65
60.38
85.08
151.93
244.04
504.94
t = 0.5°F
p = 0.86
Suction Line
1.246
1.150
1.051
0.948
0.840
0.723
0.27
0.54
1.21
2.37
5.07
7.74
17.96
28.57
50.48
102.93
185.40
299.84
613.41
1108.13
1772.90
2295.51
3302.98
0.37
0.69
1.17
1.81
3.66
6.38
10.08
20.86
36.79
58.65
86.99
122.65
218.80
350.99
725.34
t = 1°F
p = 1.72
1.12
2010 ASHRAE Handbook—Refrigeration
Licensee=AECOM User Geography and Business Line/5906698001, User=Irlandez, Jendl
Not for Resale, 10/17/2011 15:40:15 MDT
--``,`,,``,,,`,,,````,``````,,``-`-`,,`,,`,`,,`---
Copyright ASHRAE
Provided by IHS under license with ASHRAE
No reproduction or networking permitted without license from IHS
Licensee=AECOM User Geography and Business Line/5906698001, User=Irlandez, Jendl
Not for Resale, 10/17/2011 15:40:15 MDT
0.02
0.04
0.09
0.17
0.37
0.57
1.33
2.12
3.76
7.69
13.90
22.52
46.21
83.76
134.16
173.66
250.14
0.02
0.04
0.07
0.11
0.23
0.41
0.65
1.36
2.42
3.88
5.78
8.18
14.71
23.73
49.40
0.03
0.06
0.11
0.17
0.34
0.60
0.95
1.99
3.53
5.66
8.43
11.92
21.40
34.51
71.74
0.03
0.06
0.13
0.25
0.53
0.81
1.90
3.03
5.37
10.95
19.77
32.06
65.72
119.01
190.34
246.21
354.73
t = 0.5°F
p = 0.168
t = 1°F
p = 0.335
60
0.05
0.10
0.22
0.43
0.93
1.41
3.29
5.25
9.29
18.93
34.20
55.36
113.19
205.02
327.88
424.56
611.65
0.06
0.11
0.19
0.30
0.61
1.07
1.70
3.55
6.29
10.06
14.98
21.16
37.90
60.98
126.80
40
0.03
0.07
0.15
0.30
0.65
0.99
2.31
3.68
6.52
13.32
23.98
38.95
79.83
144.56
231.16
299.30
431.90
0.04
0.08
0.13
0.20
0.42
0.73
1.16
2.43
4.31
6.90
10.29
14.53
26.11
42.03
87.41
t = 0.5°F
p = 0.253
0.08
0.16
0.36
0.71
1.52
2.32
5.39
8.58
15.19
30.96
55.89
90.37
185.07
334.75
535.50
693.31
997.35
0.10
0.19
0.33
0.51
1.03
1.81
2.87
5.95
10.54
16.82
25.04
35.37
63.19
101.79
210.91
0.06
0.11
0.25
0.50
1.07
1.63
3.79
6.04
10.69
21.79
39.37
63.73
130.51
236.03
377.46
488.76
704.12
0.07
0.13
0.22
0.35
0.71
1.24
1.96
4.09
7.24
11.57
17.24
24.37
43.71
70.33
145.98
0.13
0.25
0.56
1.10
2.37
3.61
8.38
13.35
23.58
48.07
86.80
140.36
287.10
519.34
830.83
1074.09
1550.19
0.16
0.31
0.52
0.81
1.65
2.88
4.56
9.44
16.70
26.69
39.62
55.91
99.99
160.57
332.73
0.09
0.17
0.39
0.77
1.66
2.54
5.90
9.40
16.64
33.92
61.22
98.99
202.42
366.70
585.64
758.20
1092.75
0.11
0.21
0.36
0.56
1.13
1.97
3.13
6.51
11.51
18.40
27.38
38.62
69.10
111.29
230.83
Saturated Suction Temperature, °F
20
0
t = 1°F
t = 0.5°F
t = 1°F
t = 0.5°F
p =0.73
p = 0.365
p = 1.01
p = 0.505
20
0.13
0.26
0.59
1.16
2.49
3.80
8.83
14.07
24.85
50.66
91.45
147.89
302.50
547.19
875.38
1131.69
1630.79
0.17
0.32
0.55
0.85
1.73
3.02
4.78
9.92
17.54
27.98
41.61
58.69
104.94
168.52
349.13
t = 0.5°F
p = 0.678
Condensing
Temperature, °F
80
90
100
110
120
130
0.19
0.37
0.84
1.65
3.54
5.39
12.53
19.93
35.22
71.78
129.59
209.38
428.18
774.58
1237.39
1602.11
2308.78
0.25
0.47
0.80
1.24
2.52
4.39
6.94
14.37
25.40
40.48
60.13
84.73
151.06
242.71
502.46
t = 1°F
p = 1.355
Suction Line Capacities in Tons for Refrigerant 507A (Single- or High-Stage Applications)
t = 1°F
p = 0.505
Table 13
Notes:
1. t = change in saturation temperature corresponding to pressure drop, °F per 100 ft.
2. Tons based on standard refrigerant cycle of 105°F liquid and saturated evaporator outlet temperature. Liquid tons based on 20°F evaporator
temperature.
3. Thermophysical properties and viscosity data based on calculations from NIST REFPROP program Version 6.01.
4. Values based on 105°F condensing temperature. Multiply table capacities by the following factors for other condensing temperatures.
*Pipe inside diameter is same as nominal pipe size.
Type L
Copper,
OD
1/2
5/8
3/4
7/8
1 1/8
1 3/8
1 5/8
2 1/8
2 5/8
3 1/8
3 5/8
4 1/8
5 1/8
6 1/8
8 1/8
Steel
IPS SCH
3/8
80
1/2
80
3/4
80
1
80
1 1/4 40
1 1/2 40
2
40
2 1/2 40
3
40
4
40
5
40
6
40
8
40
10
40
12
ID*
14
30
16
30
Line Size
40
0.19
0.38
0.87
1.70
3.63
5.54
12.86
20.51
36.23
73.86
133.18
215.38
440.60
797.04
1273.31
1648.57
2375.74
0.26
0.48
0.82
1.27
2.57
4.49
7.09
14.70
25.99
41.41
61.51
86.66
154.78
248.63
514.43
t = 0.5°F
p = 0.9
Suction Line
1.267
1.163
1.055
0.944
0.826
0.701
0.28
0.55
1.23
2.41
5.16
7.87
18.26
29.05
51.33
104.65
188.50
304.85
623.68
1126.66
1802.55
2333.91
3358.23
0.37
0.70
1.20
1.85
3.74
6.51
10.28
21.28
37.53
59.74
88.62
124.94
222.92
357.63
739.16
t = 1°F
p = 1.8
Halocarbon Refrigeration Systems
1.13
Copyright ASHRAE
Provided by IHS under license with ASHRAE
No reproduction or networking permitted without license from IHS
t = 0.5°F
p = 0.21
0.04
0.08
0.14
0.22
0.46
0.80
1.27
2.66
4.74
7.59
11.32
16.04
28.80
46.54
96.90
0.04
0.07
0.17
0.34
0.73
1.11
2.60
4.16
7.37
15.08
27.30
44.23
90.62
164.52
263.04
340.47
491.23
t = 1°F
p = 0.42
0.06
0.12
0.21
0.33
0.67
1.18
1.87
3.90
6.92
11.10
16.54
23.37
41.90
67.56
140.71
0.05
0.11
0.25
0.48
1.04
1.60
3.73
5.94
10.52
21.48
38.84
62.85
128.81
233.22
372.99
483.55
696.69
–60
0.09
0.18
0.41
0.81
1.74
2.66
6.19
9.85
17.43
35.60
64.25
104.14
212.93
385.68
616.79
798.65
1150.59
0.11
0.21
0.36
0.57
1.15
2.02
3.20
6.66
11.81
18.88
28.12
39.75
71.16
114.71
238.00
–40
0.06
0.13
0.29
0.57
1.22
1.86
4.34
6.93
12.25
25.06
45.21
73.26
150.18
271.93
434.92
563.02
812.45
0.08
0.14
0.25
0.38
0.79
1.38
2.19
4.57
8.11
12.98
19.33
27.34
49.04
79.08
164.42
t = 0.5°F
p = 0.318
0.15
0.29
0.65
1.28
2.76
4.21
9.79
15.59
27.60
56.24
101.52
164.15
336.18
608.06
972.73
1259.39
1811.67
0.18
0.35
0.60
0.92
1.88
3.28
5.20
10.80
19.15
30.56
45.48
64.13
114.79
184.50
382.64
0.10
0.20
0.46
0.90
1.94
2.96
6.88
10.98
19.43
39.58
71.51
115.77
236.70
428.73
685.64
887.82
1279.02
0.13
0.24
0.41
0.63
1.28
2.25
3.56
7.42
13.16
21.03
31.32
44.26
79.27
127.75
265.15
0.22
0.44
0.99
1.94
4.16
6.35
14.72
23.46
41.47
84.52
152.52
246.64
504.51
912.58
1459.96
1887.38
2724.04
0.29
0.54
0.92
1.43
2.90
5.06
8.00
16.60
29.37
46.84
69.66
98.29
175.44
282.30
583.63
Licensee=AECOM User Geography and Business Line/5906698001, User=Irlandez, Jendl
Not for Resale, 10/17/2011 15:40:15 MDT
--``,`,,``,,,`,,,````,``````,,``-`-`,,`,,`,`,,`---
0.16
0.31
0.69
1.36
2.92
4.46
10.38
16.53
29.26
59.63
107.63
174.04
355.89
644.70
1029.64
1333.03
1921.21
0.20
0.37
0.63
0.98
1.99
3.47
5.50
11.43
20.24
32.36
48.14
67.89
121.50
195.66
405.01
Saturated Suction Temperature, °F
–20
0
t = 1°F
t = 0.5°F
t = 1°F
t = 0.5°F
p = 0.925
p = 0.463
p = 1.285
p = 0.643
20
0.23
0.45
1.01
1.98
4.25
6.48
15.08
24.02
42.44
86.51
156.17
252.55
516.58
934.44
1494.90
1932.59
2784.92
0.29
0.55
0.94
1.45
2.95
5.15
8.16
16.94
29.96
47.78
71.03
100.22
179.21
287.76
596.10
t = 0.5°F
p = 0.865
Condensing
Temperature, °F
80
90
100
110
120
130
0.32
0.64
1.44
2.81
6.04
9.20
21.40
34.03
60.13
122.57
221.30
357.45
731.21
1322.74
2113.09
2735.91
3942.69
0.43
0.80
1.37
2.12
4.29
7.49
11.84
24.53
43.30
69.12
102.68
144.70
257.95
414.50
858.05
t = 1°F
p = 1.73
Suction Line Capacities in Tons for Refrigerant 410A (Single- or High-Stage Applications)
t = 1°F
p = 0.635
Table 14
Notes:
1. t = change in saturation temperature corresponding to pressure drop, °F per 100 ft.
2. Tons based on standard refrigerant cycle of 105°F liquid and saturated evaporator outlet temperature. Liquid tons based on 20°F evaporator
temperature.
3. Thermophysical properties and viscosity data based on calculations from NIST REFPROP program Version 6.01.
4. Values based on 105°F condensing temperature. Multiply table capacities by the following factors for other condensing temperatures.
*Pipe inside diameter is same as nominal pipe size.
Type L
Copper,
OD
1/2
5/8
3/4
7/8
1 1/8
1 3/8
1 5/8
2 1/8
2 5/8
3 1/8
3 5/8
4 1/8
5 1/8
6 1/8
8 1/8
Steel
IPS SCH
3/8
80
1/2
80
3/4
80
1
80
1 1/4 40
1 1/2 40
2
40
2 1/2 40
3
40
4
40
5
40
6
40
8
40
10
40
12
ID*
14
30
16
30
Line Size
40
0.32
0.63
1.42
2.78
5.96
9.09
21.09
33.61
59.39
121.08
218.33
353.09
722.30
1306.62
2087.38
2702.56
3894.62
0.42
0.79
1.34
2.08
4.22
7.34
11.62
24.06
42.54
67.88
100.82
142.08
253.76
407.59
843.44
t = 0.5°F
p = 1.125
Suction Line
1.170
1.104
1.035
0.964
0.889
0.808
0.45
0.89
2.01
3.94
8.45
12.90
29.94
47.62
84.14
171.56
309.01
499.76
1022.43
1847.00
2955.02
3826.11
5505.32
0.61
1.15
1.96
3.02
6.12
10.65
16.82
34.82
61.42
97.93
145.29
204.80
365.02
586.12
1208.61
t = 1°F
p = 2.25
1.14
2010 ASHRAE Handbook—Refrigeration
Copyright ASHRAE
Provided by IHS under license with ASHRAE
No reproduction or networking permitted without license from IHS
Licensee=AECOM User Geography and Business Line/5906698001, User=Irlandez, Jendl
Not for Resale, 10/17/2011 15:40:15 MDT
0.02
0.03
0.08
0.15
0.33
0.51
1.20
1.92
3.42
7.04
12.74
20.67
42.53
77.14
123.83
160.22
231.48
0.02
0.04
0.06
0.10
0.20
0.36
0.57
1.19
2.12
3.41
5.09
7.22
13.00
21.04
43.94
0.03
0.05
0.09
0.15
0.30
0.52
0.83
1.75
3.11
5.00
7.45
10.57
19.00
30.67
63.98
0.02
0.05
0.11
0.22
0.48
0.74
1.73
2.77
4.92
10.07
18.24
29.56
60.72
110.03
176.17
228.34
329.42
t = 0.5°F
p = 0.109
t = 1°F
p = 0.218
0.05
0.09
0.21
0.40
0.87
1.34
3.12
4.98
8.82
18.05
32.63
52.87
108.35
196.18
314.18
406.04
585.97
0.05
0.10
0.17
0.27
0.56
0.98
1.56
3.24
5.77
9.24
13.77
19.47
35.00
56.41
117.40
–40
0.03
0.06
0.14
0.28
0.61
0.93
2.18
3.49
6.16
12.62
22.88
37.10
76.09
137.91
220.86
286.29
413.05
0.04
0.07
0.12
0.18
0.38
0.66
1.06
2.22
3.94
6.32
9.44
13.36
24.01
38.77
80.79
t = 0.5°F
p = 0.175
0.08
0.15
0.35
0.68
1.48
2.25
5.25
8.36
14.81
30.24
54.64
88.32
181.10
327.97
523.74
678.86
978.61
0.09
0.18
0.31
0.48
0.97
1.70
2.69
5.61
9.94
15.91
23.72
33.52
60.09
96.82
201.22
0.05
0.11
0.24
0.48
1.03
1.57
3.68
5.85
10.39
21.26
38.40
62.14
127.34
230.56
369.31
477.98
689.83
0.06
0.12
0.21
0.32
0.66
1.16
1.84
3.84
6.82
10.92
16.29
23.03
41.35
66.66
138.52
0.13
0.25
0.56
1.10
2.36
3.61
8.39
13.39
23.66
48.33
87.11
141.05
288.49
522.51
834.64
1080.58
1557.07
0.16
0.30
0.51
0.78
1.60
2.79
4.43
9.20
16.30
26.05
38.75
54.73
97.90
157.64
326.82
0.09
0.17
0.39
0.77
1.66
2.53
5.90
9.41
16.66
34.01
61.38
99.22
203.43
368.41
588.33
762.91
1099.28
0.11
0.20
0.34
0.53
1.09
1.91
3.03
6.32
11.20
17.90
26.70
37.71
67.62
108.96
226.06
Saturated Suction Temperature, °F
–20
0
t = 1°F
t = 0.5°F
t = 1°F
t = 0.5°F
p = 0.53
p = 0.265
p = 0.775
p = 0.388
20
0.13
0.27
0.60
1.18
2.53
3.86
8.98
14.30
25.31
51.63
93.20
150.90
308.63
558.98
892.90
1155.99
1665.74
0.17
0.32
0.54
0.84
1.71
2.98
4.72
9.84
17.42
27.82
41.40
58.46
104.74
168.35
349.69
t = 0.5°F
p = 0.54
Condensing
Temperature, °F
80
90
100
110
120
130
0.19
0.38
0.86
1.68
3.60
5.49
12.77
20.35
35.96
73.25
132.31
213.85
437.43
791.25
1265.85
1636.44
2358.16
0.25
0.46
0.79
1.23
2.49
4.35
6.89
14.31
25.30
40.34
59.97
84.60
151.22
243.24
503.94
t = 1°F
p = 1.08
Suction Line Capacities in Tons for Refrigerant 407C (Single- or High-Stage Applications)
t = 1°F
p = 0.35
Table 15
Notes:
1. t = change in saturation temperature corresponding to pressure drop, °F per 100 ft.
2. Tons based on standard refrigerant cycle of 105°F liquid and saturated evaporator outlet temperature. Liquid tons based on 20°F evaporator temperature.
3. Thermophysical properties and viscosity data based on calculations from NIST REFPROP program Version 6.01.
4. Values based on 105°F condensing temperature. Multiply table capacities by the following factors for other condensing temperatures.
*Pipe inside diameter is same as nominal pipe size.
Type L
Copper,
OD
1/2
5/8
3/4
7/8
1 1/8
1 3/8
1 5/8
2 1/8
2 5/8
3 1/8
3 5/8
4 1/8
5 1/8
6 1/8
8 1/8
Steel
IPS SCH
3/8
80
1/2
80
3/4
80
1
80
1 1/4 40
1 1/2 40
2
40
2 1/2 40
3
40
4
40
5
40
6
40
8
40
10
40
12
ID*
14
30
16
30
–60
--``,`,,``,,,`,,,````,``````,,``-`-`,,`,,`,`,,`---
Line Size
40
0.20
0.39
0.88
1.73
3.72
5.67
13.18
21.00
37.18
75.79
136.64
221.26
452.60
817.38
1307.58
1693.24
2440.00
0.25
0.48
0.81
1.26
2.56
4.48
7.09
14.73
26.08
41.58
61.81
87.32
156.10
251.08
520.10
t = 0.5°F
p = 0.73
Suction Line
1.163
1.099
1.033
0.966
0.896
0.824
0.28
0.56
1.26
2.47
5.28
8.06
18.71
29.82
52.68
107.39
193.65
313.17
640.64
1158.92
1851.38
2397.05
3454.36
0.37
0.70
1.19
1.84
3.74
6.52
10.30
21.36
37.75
60.23
89.47
126.06
225.14
361.69
748.45
t = 1°F
p = 1.46
Halocarbon Refrigeration Systems
1.15
1.16
2010 ASHRAE Handbook—Refrigeration
Table 16
Fitting Losses in Equivalent Feet of Pipe
(Screwed, Welded, Flanged, Flared, and Brazed Connections)
Smooth Bend Elbows
90°
Stda
90° LongRadiusb
90°
Streeta
45°
Stda
Smooth Bend Tees
45°
Streeta
180°
Stda
Flow
Through
Branch
Nominal
Pipe or
Tube Size,
in.
3/8
1/2
3/4
1
1 1/4
1 1/2
2
2 1/2
3
3 1/2
4
5
6
8
10
12
14
16
18
20
24
a R/D
1.4
1.6
2.0
2.6
3.3
4.0
5.0
6.0
7.5
9.0
10.0
13.0
16.0
20.0
25.0
30.0
34.0
38.0
42.0
50.0
60.0
0.9
1.0
1.4
1.7
2.3
2.6
3.3
4.1
5.0
5.9
6.7
8.2
10.0
13.0
16.0
19.0
23.0
26.0
29.0
33.0
40.0
2.3
2.5
3.2
4.1
5.6
6.3
8.2
10.0
12.0
15.0
17.0
21.0
25.0
—
—
—
—
—
—
—
—
b R/D
approximately equal to 1.
0.7
0.8
0.9
1.3
1.7
2.1
2.6
3.2
4.0
4.7
5.2
6.5
7.9
10.0
13.0
16.0
18.0
20.0
23.0
26.0
30.0
1.1
1.3
1.6
2.1
3.0
3.4
4.5
5.2
6.4
7.3
8.5
11.0
13.0
—
—
—
—
—
—
—
—
2.3
2.5
3.2
4.1
5.6
6.3
8.2
10.0
12.0
15.0
17.0
21.0
25.0
33.0
42.0
50.0
55.0
62.0
70.0
81.0
94.0
2.7
3.0
4.0
5.0
7.0
8.0
10.0
12.0
15.0
18.0
21.0
25.0
30.0
40.0
50.0
60.0
68.0
78.0
85.0
100.0
115.0
Straight-Through Flow
No
Reduction
Reduced
1/4
Reduced
1/2
0.9
1.0
1.4
1.7
2.3
2.6
3.3
4.1
5.0
5.9
6.7
8.2
10.0
13.0
16.0
19.0
23.0
26.0
29.0
33.0
40.0
1.2
1.4
1.9
2.2
3.1
3.7
4.7
5.6
7.0
8.0
9.0
12.0
14.0
18.0
23.0
26.0
30.0
35.0
40.0
44.0
50.0
1.4
1.6
2.0
2.6
3.3
4.0
5.0
6.0
7.5
9.0
10.0
13.0
16.0
20.0
25.0
30.0
34.0
38.0
42.0
50.0
60.0
approximately equal to 1.5.
Table 17 Special Fitting Losses in Equivalent Feet of Pipe
Sudden Enlargement, d/D
Sudden Contraction, d/D
Sharp Edge
Pipe Projection
1/4
1/2
3/4
1/4
1/2
3/4
Entrance
Exit
Entrance
Exit
1.4
1.8
2.5
3.2
4.7
5.8
8.0
10.0
13.0
15.0
17.0
24.0
29.0
—
—
—
—
—
—
—
—
0.8
1.1
1.5
2.0
3.0
3.6
4.8
6.1
8.0
9.2
11.0
15.0
22.0
25.0
32.0
41.0
—
—
—
—
—
0.3
0.4
0.5
0.7
1.0
1.2
1.6
2.0
2.6
3.0
3.8
5.0
6.0
8.5
11.0
13.0
16.0
18.0
20.0
—
—
0.7
0.9
1.2
1.6
2.3
2.9
4.0
5.0
6.5
7.7
9.0
12.0
15.0
—
—
—
—
—
—
—
—
0.5
0.7
1.0
1.2
1.8
2.2
3.0
3.8
4.9
6.0
6.8
9.0
11.0
15.0
20.0
25.0
—
—
—
—
—
0.3
0.4
0.5
0.7
1.0
1.2
1.6
2.0
2.6
3.0
3.8
5.0
6.0
8.5
11.0
13.0
16.0
18.0
20.0
—
—
1.5
1.8
2.8
3.7
5.3
6.6
9.0
12.0
14.0
17.0
20.0
27.0
33.0
47.0
60.0
73.0
86.0
96.0
115.0
142.0
163.0
0.8
1.0
1.4
1.8
2.6
3.3
4.4
5.6
7.2
8.5
10.0
14.0
19.0
24.0
29.0
37.0
45.0
50.0
58.0
70.0
83.0
1.5
1.8
2.8
3.7
5.3
6.6
9.0
12.0
14.0
17.0
20.0
27.0
33.0
47.0
60.0
73.0
86.0
96.0
115.0
142.0
163.0
1.1
1.5
2.2
2.7
4.2
5.0
6.8
8.7
11.0
13.0
16.0
20.0
25.0
35.0
46.0
57.0
66.0
77.0
90.0
108.0
130.0
Nominal
Pipe or
Tube Size,
in.
--``,`,,``,,,`,,,````,``````,,``-`-`,,`,,`,`,,`---
3/8
1/2
3/4
1
1 1/4
1 1/2
2
2 1/2
3
3 1/2
4
5
6
8
10
12
14
16
18
20
24
Note: Enter table for losses at smallest diameter d.
Copyright ASHRAE
Provided by IHS under license with ASHRAE
No reproduction or networking permitted without license from IHS
Licensee=AECOM User Geography and Business Line/5906698001, User=Irlandez, Jendl
Not for Resale, 10/17/2011 15:40:15 MDT
Halocarbon Refrigeration Systems
Valve Losses in Equivalent Feet of Pipe
Nominal
Pipe
or Tube
60°
Size, in. Globea Wye
3/8
1/2
3/4
1
1 1/4
1 1/2
2
2 1/2
3
3 1/2
4
5
6
8
10
12
14
16
18
20
24
17
18
22
29
38
43
55
69
84
100
120
140
170
220
280
320
360
410
460
520
610
8
9
11
15
20
24
30
35
43
50
58
71
88
115
145
165
185
210
240
275
320
45°
Wye
6
7
9
12
15
18
24
29
35
41
47
58
70
85
105
130
155
180
200
235
265
Swing
Anglea Gateb Checkc
6
7
9
12
15
18
24
29
35
41
47
58
70
85
105
130
155
180
200
235
265
0.6
0.7
0.9
1.0
1.5
1.8
2.3
2.8
3.2
4.0
4.5
6.0
7.0
9.0
12.0
13.0
15.0
17.0
19.0
22.0
25.0
5
6
8
10
14
16
20
25
30
35
40
50
60
80
100
120
135
150
165
200
240
Fig. 3
Lift
Check
Globe
and
vertical
lift
same as
globe
valved
Fig. 3 Double-Suction Riser Construction
Angle
lift
same as
angle
valve
Note: Losses are for valves in fully open position and with screwed, welded, flanged, or
flared connections.
a These losses do not apply to valves with needlepoint seats.
b Regular and short pattern plug cock valves, when fully open, have same loss as gate
valve. For valve losses of short pattern plug cocks above 6 in., check with manufacturer.
c Losses also apply to inline, ball check valve.
d For Y pattern globe lift check valve with seat approximately equal to nominal pipe
diameter, use values of 60° wye valve for loss.
compressor will operate. When suction or evaporator pressure
regulators are used, suction risers must be sized for actual gas conditions in the riser.
For a single compressor with capacity control, the minimum
capacity is the lowest capacity at which the unit can operate. For
multiple compressors with capacity control, the minimum capacity
is the lowest at which the last operating compressor can run.
Riser Sizing. The following example demonstrates the use of
Table 19 in establishing maximum riser sizes for satisfactory oil
transport down to minimum partial loading.
Example 3. Determine the maximum size suction riser that will transport
oil at minimum loading, using R-22 with a 40 ton compressor with
capacity in steps of 25, 50, 75, and 100%. Assume the minimum system loading is 10 tons at 40°F suction and 105°F condensing temperatures with 15°F superheat.
Solution: From Table 19, a 2 1/8 in. OD pipe at 40°F suction and 90°F
liquid temperature has a minimum capacity of 7.5 tons. When corrected
to 105°F liquid temperature using the chart at the bottom of Table 19,
minimum capacity becomes 7.2 tons. Therefore, 2 1/8 in. OD pipe is
suitable.
Based on Table 19, the next smaller line size should be used for
marginal suction risers. When vertical riser sizes are reduced to provide satisfactory minimum gas velocities, pressure drop at full load
increases considerably; horizontal lines should be sized to keep total
pressure drop within practical limits. As long as horizontal lines are
level or pitched in the direction of the compressor, oil can be transported with normal design velocities.
Because most compressors have multiple capacity-reduction
features, gas velocities required to return oil up through vertical suction risers under all load conditions are difficult to maintain. When
the suction riser is sized to allow oil return at the minimum operating capacity of the system, pressure drop in this portion of the line
Copyright ASHRAE
Provided by IHS under license with ASHRAE
No reproduction or networking permitted without license from IHS
Double-Suction Riser Construction
may be too great when operating at full load. If a correctly sized
suction riser imposes too great a pressure drop at full load, a double
suction riser should be used.
Oil Return up Suction Risers: Multistage Systems. Oil movement in the suction lines of multistage systems requires the same
design approach as that for single-stage systems. For oil to flow up
along a pipe wall, a certain minimum drag of gas flow is required.
Drag can be represented by the friction gradient. The following sizing data may be used for ensuring oil return up vertical suction lines
for refrigerants other than those listed in Tables 19 and 20. The line
size selected should provide a pressure drop equal to or greater than
that shown in the chart.
Saturation
Temperature, °F
0
–50
Line Size
2 in. or less
Above 2 in.
0.35 psi/100 ft
0.45 psi/100 ft
0.20 psi/100 ft
0.25 psi/100 ft
Double Suction Risers. Figure 3 shows two methods of double
suction riser construction. Oil return in this arrangement is accomplished at minimum loads, but it does not cause excessive pressure
drops at full load. Sizing and operation of a double suction riser are
as follows:
--``,`,,``,,,`,,,````,``````,,``-`-`,,`,,`,`,,`---
Table 18
1.17
1. Riser A is sized to return oil at minimum load possible.
2. Riser B is sized for satisfactory pressure drop through both risers
at full load. The usual method is to size riser B so that the
combined cross-sectional area of A and B is equal to or slightly
greater than the cross-sectional area of a single pipe sized for
acceptable pressure drop at full load without regard for oil return
at minimum load. The combined cross-sectional area, however,
should not be greater than the cross-sectional area of a single pipe
that would return oil in an upflow riser under maximum load.
3. A trap is introduced between the two risers, as shown in both
methods. During part-load operation, gas velocity is not sufficient to return oil through both risers, and the trap gradually fills
up with oil until riser B is sealed off. The gas then travels up riser
A only with enough velocity to carry oil along with it back into
the horizontal suction main.
The trap’s oil-holding capacity is limited to a minimum by closecoupling the fittings at the bottom of the risers. If this is not done,
the trap can accumulate enough oil during part-load operation to
lower the compressor crankcase oil level. Note in Figure 3 that riser
lines A and B form an inverted loop and enter the horizontal suction
line from the top. This prevents oil drainage into the risers, which
may be idle during part-load operation. The same purpose can be
served by running risers horizontally into the main, provided that
the main is larger in diameter than either riser.
Often, double suction risers are essential on low-temperature
systems that can tolerate very little pressure drop. Any system using
Licensee=AECOM User Geography and Business Line/5906698001, User=Irlandez, Jendl
Not for Resale, 10/17/2011 15:40:15 MDT