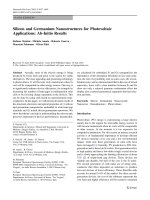
Electrochemical deposition of CIS films for photovoltaic applications
Bạn đang xem bản rút gọn của tài liệu. Xem và tải ngay bản đầy đủ của tài liệu tại đây (8.22 MB, 103 trang )
ELECTROCHEMICAL DEPOSITION OF CIS FILMS
FOR PHOTOVOLTAIC APPLICATIONS
ZHANG SHIYUN
(B.Eng (Hons.), NTU)
A THESIS SUBMITTED FOR THE DEGREE OF
MASTERS OF ENGINEERING
DEPARTMENT OF MATERIALS SCIENCE AND
ENGINNERING
NATIONAL UNIVERSITY OF SINGAPORE
2013
DECLARATION
I hereby declare that the thesis is my original
work and it has been written by me in its
entirety. I have duly acknowledged all the
sources of information which have been used
in the thesis.
This thesis has also not been submitted for any
degree in any university previously.
Zhang Shiyun
26th Apr 2013
Page I
ACKNOWLEDGEMENT
I would to express my gratitude to the following people whom have in a
way or another has contributed and/or helped me to make this entire
Masters of Engineering study possible.
1. Associate Professor, Dr. Blackwood D.J., Faculty staff of
department of Materials Science & Engineering, for all your
valuable guidance, patience and support.
2. Director of MMI Holdings Ltd, Mr. SH Lee, for all past support
and giving me the privilege on flexible working hours to make
travelling down to school for evening class possible, as well as
the grace to allow me study and run projects during working
hours.
3. Deputy Director, Mr. Jeffery Leong, Head of Department of
Materials, Devices & Reliability Analysis (MDRA) and all fellow
colleagues in MDRA department
Microelectronics
(IME)
for
your
in A*STAR-Institute of
kind
support
and
encouragement, as well as the privilege to access lab
capabilities after working hours.
4. Scientist,
Dr.
Chentir
Mohamed
Tahar,
Institute
of
Microelectronics (IME) for the valuable guidance in getting XRD
plots in place and valuable advices cum technical support.
5. Laboratory Technologists, Mr. Chen Qun, for your continual
support XRD test and arrangement.
6. Laboratory Technologists, LEE Koi Kong Roger, for your kind
and helpful support in getting annealing furnace done without
Page II
much hassle, and making the extra effort to collect samples
outside NUS after working hours.
7. Research staff and students under Prof. Blackwood (Hamed,
Guiyang, Dong Qing, Rachel and Eugene) for your endless
support and help in laboratory work and schedule.
8. Senior
Engineer,
Mr.
Stephan
Tan,
Delphi
Automotive
Singapore Pte Ltd, for believing in me that part time studies is
still possible with all the encouragement as well as the valuable
technical advice.
9. All Precision Magnetic Singapore Pte Ltd ex-colleagues for
rendering all the help and support in balancing work and school
loadings, getting Mo-strips samples done in workshop.
10. My beloved family members and friends for all your countless
support, prayers and encouragement. Thank you for believing in
me.
Page III
TABLE OF CONTENT
ACKNOWLEDGEMENT................................................................................ II
TABLE OF CONTENT ................................................................................. IV
SUMMARY ................................................................................................... VI
LIST OF TABLES ....................................................................................... VII
LIST OF FIGURES ....................................................................................... IX
1. INTRODUCTION ....................................................................................... 1
1.1
THIN FILMS SOLAR CELLS – COPPER INDIUM DISELENIDE ..... 5
1.2
PHOTOVOLTAIC DEVICES........................................................... 9
1.3
DOPING AND DEGENERACRY OF SEMICONDUCTOR .............10
1.4
ELECTRODEPOSTION OF CUINSE2 ............................................17
1.5
DENDRITE GROWTH...................................................................25
1.6
ANNEALING OF COMPOUNDING PRECUROSOR .....................28
1.7
BACK CONTACT – MO .................................................................33
2. EXPERIMENTAL DETAILS .....................................................................35
2.1
SUBSTRATE PREPARATION ......................................................35
2.2
DEPOSITION OF CIS THIN FILMS ...............................................35
2.3
POST TREATMENT .....................................................................37
2.4
ELEMENTAL ANALYSIS BY ENERGY DISPERSIVE X-RAY (EDX)
SPECTROCOPY ..........................................................................38
2.5
SURFACE MORPHOLOGY EVALUATION BY SCANNING
ELECTRON MICROSCOPY (SEM) ...............................................38
2.6
PHASE ANALYSIS BY X-RAY DIFFRACTOMETER (XRD)...........39
2.7
ELECTRICAL CONDUCTIVITY BY PHOTOELECTRO-CHEMICAL
(PEC) ............................................................................................39
Page IV
3. RESULTS & DISCUSSION ......................................................................43
3.1
ELEMENTAL ANALYSIS BY ENERGY DISPERSIVE X-RAY (EDX)
SPECTROCOPY ..........................................................................43
3.2
SURFACE MORPHOLOGY EVALUATION BY SCANNING
ELECTRON MICROSCOPY (SEM) ...............................................49
3.2.1
CROSS-SECTION VIEW ................................................................49
3.2.2
SURFACE PROFILE MORPHOLOGY................................................52
3.3
PHASE ANALYSIS BY X-RAY DIFFRACTOMETER (XRD)...........66
3.3.1
MO-STRIP BY DC PLATING AT ROOM TEMPERATURE ......................66
3.3.2
MO-WAFER BY DC PLATING AT ROOM TEMPERATURE ....................70
3.3.3
MO-WAFER BY PULSE PLATING AT ROOM TEMPERATURE................74
3.3.4
MO-WAFER BY PULSE PLATING AT 40°C .......................................77
3.4
ELECTRICAL CONDUCTIVITY BY PHOTOELECTRO-CHEMICAL
(PEC) ............................................................................................80
4. CONCULSION .........................................................................................84
4.1
FUTURE WORK ...........................................................................84
REFERENCES .............................................................................................86
Page V
SUMMARY
Copper indium diselenide polycrystalline films of p-, i- and n-type
electrical conductivity were deposited on Molybdenum (metal strip and
sputtered on Si-wafer) from a single bath using direct-current and
pulse-plating deposition, at cathodic potential ranging -0.3V to -1.3V,
with a thickness between 100-200nm. Electrochemical deposition
mechanism results were correlated using Energy-Dispersive-X-ray
Spectroscopy and X-Ray-Diffraction. Scanning-Electron-Microscopy
was
employed
for
surface
morphology
studies
and
Photoelectrochemical cell for p/i/n-type films conductivity. Photovoltage
results indicate that p- and n-type CIS layers can be obtained by
varying deposition potential under DC-plating at room temperature,
pulse-plating at room temperature and 40°C on Mo-wafer. Generally, ptype can be obtained at relatively high potential of -0.3V and -0.7V,
where n-type at more negative deposition potentials. To form a
complete p-i-n junction from a single bath, pulse-plating at 40ᵒC is
recommended with negative plating limiting to pulse cycled from -0.3V
(p-type) to -0.7V (intrinsic) and finally to -1.1V (n-type).
Page VI
LIST OF TABLES
TABLE 1: SUMMARY OF EDX ELEMENTAL RESULTS ON THE CIS FILMS
DEPOSITED ON MO-STRIP AT ROOM TEMPERATURE BY DC PLATING. ... 43
TABLE 2: SUMMARY OF EDX ELEMENTAL RESULTS ON THE CIS FILMS
DEPOSITED ON MO WAFER AT ROOM TEMPERATURE BY DC PLATING.
. 43
TABLE 3: SUMMARY OF EDX ELEMENTAL RESULTS ON THE CIS FILMS
DEPOSITED ON MO WAFER AT ROOM TEMPERATURE WITH PULSE
PLATING. ....................................................................................... 44
TABLE 4: SUMMARY OF EDX ELEMENTAL RESULTS ON THE CIS FILMS
DEPOSITED ON MO WAFER 40°CWITH PULSE PLATING. ...................... 44
TABLE 5: CRYSTAL SIZE OF CIS ON MO-STRIP BEFORE AND AFTER
ANNEALING AT 450°C, BASE ON CIS(211) PEAK WIDTHS. .................. 68
TABLE 6: CALCULATED CRYSTALLITE SIZES FOR CIS DC PLATED ON MOWAFER AT ROOM TEMPERATURE (AS PLATED). .................................. 71
TABLE 7: CRYSTALLITE SIZES OF CIS DC PLATED ON MO-WAFER BEFORE AND
AFTER POST TREATMENTS (ANNEALING + KCN ETCH) AT ROOM
TEMPERATURE. .............................................................................. 72
TABLE 8: TABULATION OF CRYSTAL SIZE OF CIS ON MO-WAFER (AS PLATED)
BEFORE AND AFTER TREATMENTS (ANNEALING + KCN ETCH) AT ROOM
TEMPERATURE BY PULSE PLATING.
.................................................. 76
TABLE 9: TABULATION OF CRYSTAL SIZE OF CIS ON MO-WAFER (AS PLATED)
BY PULSE PLATING AT 40°C.
........................................................... 77
Page VII
TABLE 10: TABULATION OF CRYSTAL SIZE OF CIS ON MO-WAFER BEFORE AND
AFTER TREATMENTS (ANNEALING + KCN ETCH) BY PULSE PLATING AT
40°C. ........................................................................................... 79
TABLE 11: PEC PHOTOVOLTAGE OF FILMS DEPOSITED ON MO-WAFER WITH
PULSE PLATING AT ROOM TEMPERATURE, PULSE PLATING AT 40°C AND
DC PLATING AT ROOM TEMPERATURE. ............................................. 80
Page VIII
LIST OF FIGURES
FIGURE 1: THE UNIT CELL OF CHALCOPYRITE LATTICE STRUCTURE ............... 5
FIGURE 2: TERNARY
PHASE DIAGRAM OF
CU-IN-SE
SYSTEM.
THIN
FILM
COMPOSITION NEAR PSEUDO-BINARY CU2SE-IN2SE3 TIE LINE ... 6
FIGURE 3: PSEUDO-BINARY PHASE DIAGRAM OF CU-IN-SE SYSTEM ............. 7
FIGURE 4: SCHEMATIC
ENERGY BAND DIAGRAM OF A PN-HETEROJUNCTION
SOLAR CELL AT VARIOUS CONDITION....................................... 10
FIGURE 5: SCHEMATIC
OF SOLAR CELL WHERE ELECTRONS ARE PUMPED BY
PHOTONS FROM THE VALENCE BAND
(CB),
(VB)
TO CONDUCTION BAND
AND EXTRACTED BY A CONTACT SELECTIVE TO THE
CONDUCTION BAND (AN N-DOPED SEMICONDUCTOR) AT A HIGHER
(FREE)
ENERGY AND DELIVERED TO AN EXTERNAL LOAD, AND
RETURNED TO THE VALENCE BAND AT A LOWER (FREE) ENERGY BY
A CONTACT SELECTIVE TO THE VALANCE BAND
(A
P-TYPE
SEMICONDUCTOR). ............................................................... 11
FIGURE 6: ENERGY
BAND DIAGRAM OF ELECTRONS AND HOLES AT
CB
AND
VB RESPECTIVELY................................................................ 13
FIGURE 7: ENERGY BAND DIAGRAM OF INTRINSIC, N-TYPE AND P-TYPE. ...... 15
FIGURE 8: DEGENERATE N-TYPE(LEFT) AND P-TYPE(RIGHT) SEMICONDUCTOR.
........................................................................................... 17
FIGURE 9 : TEMPERATURE
OF THE LIQUID IS ABOVE THE FREEZING
TEMPERATURE, PROTUBERANCE ON THE SOLID-LIQUID INTERFACE
WILL NOT GROW LEADING TO A MAINTENANCE OF A PLANAR
INTERFACE.
LATENT
HEAT IS REMOVED FROM THE INTERFACE
THROUGH THE SOLID............................................................. 26
Page IX
FIGURE 10 : LIQUID
IS UNDERCOOLED, A PROTUBERANCE ON THE SOLILD-
LIQUID INTERFACE CAN GROW RAPIDLY AS A DENDRITE.
LATENT
HEAT OF FUSION IS REMOVED BY RAISING THE TEMPERATURE OF
THE LIQUID BACK TO THE FREEZING TEMPERATURE. ................. 27
FIGURE 11: MODEL
GROWTH
SIMULATION OF ISOTROPIC, SINGLE-PHASE GRAIN
IN
A
POLYCRYSTALLINE
MATERIAL.
COLOR
CORRESPONDS TO THE SITE INDICES. OVER TIME, AVERAGE GRAIN
SIZE INCREASES AS LARGE GRAINS GROW AT THE EXPENSE OF
SMALL GRAINS. ..................................................................... 29
FIGURE 12 : ILLUSTRATION
OF
FICK'S
SECOND LAW ON THE DIFFUSION OF
ATOM INTO THE SURFACE OF A MATERIAL. ............................... 32
FIGURE 13: ELECTRODEPOSITION SETUP ................................................ 36
FIGURE 14: VOLTAGE-TIME PROFILE OF PULSE DEPOSITION OF CIS THIN FILM.
VC RANGING FOR -0.3V TO -1.3V, WHEREAS TR = 2 SECOND AND
TC = 1 SECOND. .................................................................... 37
FIGURE 15:
N-TYPE SEMICONDUCTOR AND METAL
(A)
IN ISOLATION
(B)
SEMICONDUCTOR –METAL JUNCTION IN EQUILIBRIUM. .............. 41
FIGURE 16: BAND
PROFILES FOR THE P-TYPE SEMICONDUCTOR-METAL
JUNCTION UNDER ILLUMINATION. ............................................ 42
FIGURE 17: COMPOSITION OF DC ELECTRODEPOSITION OF CIS THIN ON MOSTRIP AT ROOM TEMPERATURE AS A FUNCTION OF DEPOSITION
POTENTIAL AS DETERMINED BY EDX. ..................................... 45
FIGURE 18: COMPOSITION OF DC ELECTRODEPOSITION OF CIS THIN ON MOWAFER AT ROOM TEMPERATURE AS A FUNCTION OF DEPOSITION
POTENTIAL AS DETERMINED BY EDX. ..................................... 46
Page X
FIGURE 19: COMPOSITION
MO-WAFER
OF
AT
PULSE
ROOM
ELECTRODEPOSITION OF
TEMPERATURE
AS
A
CIS
THIN ON
FUNCTION
OF
DEPOSITION POTENTIAL AS DETERMINED BY EDX. ................... 46
FIGURE 20: COMPOSITION
MO-WAFER
AT
OF
PULSE
40°C
ELECTRODEPOSITION OF
CIS
THIN ON
AS A FUNCTION OF DEPOSITION POTENTIAL
AS DETERMINED BY EDX. ...................................................... 47
FIGURE 21: MICROGRAPHS OF PULSE PLATING AT -0.9V AND DC PLATING AT
-0.9V. ................................................................................. 50
FIGURE 22: MICROGRAPHS OF DC PLATING AND THICKNESS OF MO AND CIS
FILMS .................................................................................. 51
FIGURE 23: DC
PLATING
ON
MO
WAFER
AT
ROOM
TEMPERATURE
MICROGRAPHS ..................................................................... 54
FIGURE 24: DC
PLATING
ON
MO
WAFER
AT
ROOM
TEMPERATURE
MICROGRAPHS ..................................................................... 56
FIGURE 25: PULSE
PLATING
ON
MO-WAFER
SUBSTRATE
AT
ROOM
TEMPERATURE ..................................................................... 59
FIGURE 26: PULSE PLATING ON MO-WAFER AT 40°C MICROGRAPHS. ........ 61
FIGURE 27: PULSE PLATING SURFACE MORPHOLOGY AT ROOM TEMPERATURE
AT -0.3V AND -0.7V AT HIGHER MAGNIFICATION. ..................... 63
FIGURE 28: XRD
PLOT OF
DC
DEPOSITION OF
WITH POTENTIAL AT
CIS
THIN FILM ON
-0.3V, -0.7V, -0.9V, -1.1V
PERFORMED AT ROOM TEMPERATURE.
MO
AND
STRIP
-1.3V
................................... 66
FIGURE 29: XRD PLOT OF CIS THIN FILM ON MO STRIP AFTER ANNEALING AT
450°C FOR 30MIN WITH POTENTIAL AT -0.3V, -0.7V, -0.9V, -1.1V
AND -1.3V PERFORMED AT ROOM TEMPERATURE. ................... 67
Page XI
FIGURE 30: XRD PLOT OF CIS THIN FILM ON MO STRIP AFTER KCN ETCHING
WITH POTENTIAL AT -0.3V, -0.7V, -0.9V, -1.1V AND -1.3V ...... 69
FIGURE 31: XRD PLOT OF DC DEPOSITION OF CIS THIN FILM ON MO WAFER
WITH POTENTIAL AT
-0.3V, -0.7V, -0.9V, -1.1V
AND
-1.3V
AT
ROOM TEMPERATURE............................................................ 70
FIGURE 32: XRD
PLOT
CIS
THIN FILM AFTER POST TREATMENT ON
MO
WAFER WITH POTENTIAL AT -0.3V, -0.7V, -0.9V, -1.1V AND -1.3V
AT ROOM TEMPERATURE. ...................................................... 71
FIGURE 33: XRD
OF
(AS
PLATED)
CIS
THIN FILM DEPOSITED BY
PULSE
PLATING ON MO WAFER WITH POTENTIAL AT -0.3V, -0.7V, -0.9V, -
1.1V AND -1.3V AT ROOM TEMPERATURE. .............................. 74
FIGURE 34: XRD
PLOT OF AFTER POST TREATMENT
DEPOSITED BY
CIS
THIN FILM
PULSE PLATING ON MO WAFER WITH POTENTIAL AT
-0.3V, -0.7V, -0.9V, -1.1V
AND
-1.3V
AT ROOM TEMPERATURE.
........................................................................................... 75
FIGURE 35: XRD PLOT OF (AS PLATED) CIS THIN FILM DEPOSITED BY PULSE
PLATING ON MO WAFER WITH POTENTIAL AT -0.3V, -0.7V, -0.9V, -
1.1V AND -1.3V HEATED BATH AT 40°C. ................................ 77
FIGURE 36: XRD
PLOT OF AFTER POST TREATMENT
DEPOSITED BY
CIS
THIN FILM
PULSE PLATING ON MO WAFER WITH POTENTIAL AT
-0.3V, -0.7V, -0.9V, -1.1V AND -1.3V AT HEATED BATH AT 40°C.
........................................................................................... 78
FIGURE 37: PEC
PHOTOVOLTAGE
TEMPERATURE,
PULSE
ACROSS
DC
PLATING
AT
ROOM
PLATING AT ROOM TEMPERATURE AND
Page XII
PULSE
PLATING AT
TO -1.3 V.
40°C
ON
MO-WAFER,
RANGING FROM
-0.3V
........................................................................... 81
Page XIII
1. INTRODUCTION
Present global energy production is largely accomplished by burning of
fossil fuels, which inevitably relates inherent issues associated with the
limited resources as well as environmental problems. Solar energy
from photovoltaic has received increasing favor as an alternative
source for future electricity by converting direct sunlight to electricity.
However, the costs of producing photovoltaics (cost per watt) are
higher than the conventional methods. As a result, it may not be the
preferred choice between the two. Nevertheless, cost effectiveness can
be lowered through improving efficiency or reducing production cost.
Copper Indium Diselenide (CIS) is one of the fastest developing
materials for thin-film photovoltaic solar cells due to its excellent optical
and photovoltaic properties through direct energy band gap and high
absorption coefficient. Having the advantage of direct bandgap of ≈
1.05eV by [8], Copper Indium Diselenide is consider a high absorption
coefficient materials as well as having large minority carrier diffusion
length, thus forming a suitable film for photovoltaic applications.
Contreras et al [9] have achieved a high conversion efficiency of almost
19% with these materials.
CIS films can be prepared by gaseous and liquid phases, such as
physical vapour deposition, sputtering, molecular beam epitaxy, metalorganic chemical vapour deposition etc. Electrodeposition has its
advantage for mass production in terms of large surface area and high
volume productions. It is more economical since the steps are simple
[6] and does not required sophisticated high vacuum machines and
stringent environments it also uses relative lower temperature than
other processes.
Page 1
Generally, electrodeposition of CuInSe films can be simplified in the
following written reaction:
Cu(II) + 2Se(IV) + In(III) +13e- → CuInSe2
Inevitably, the film would contain binary phases in addition to the
chalcopyrite CIS phases [18] in acidic medium, namely CuxSe and
In2Se3. The reactions can be summarized as follows:
I.
xCu(II) + Se(IV) + (2x+4)e- → CuxSe
II.
3Se(-II) + 2In(III) → In2Se3
III.
Cu2Se + In2Se3 → CuInSe2
Where x is the ratio of fluxes at the electrode surface of Cu(II) ions and
Se(IV) ions, which were proportional to the concentration of the ions in
the electrolyte assuming reaction is limited by diffusion.
Formation of Copper Selenide Cu2Se and Indium Selenide In2Se3
occurs first before the formation of CIS growth. Deposition of Cu2Se
occurs initially which depends on the diffusion coefficient of the Se(IV)
and Cu(II). With sufficient In(III) in the solution, Selenium deposited can
further reduced to Se(-II) while reacting with In(III) producing In2Se3,
which were controlled by the deposition potential [15].
Further findings were made by Chassing E. et al (2008) [5] on the
electrodeposition mechanism on a rotating disc electrode. At deposition
potentials between -0.3V to -0.4V, Cu3Se2 were produced according to
the following reactions:
3Cu(II) + 2 H2SeO3 + 8H+ + 14e- → Cu3Se2 + 6H2O
Page 2
As deposition potential decrease further, Cu3Se2 will be reduced to
CuSe, and dissolution of Se(IV) would reduced to Se and deposit on
CuSe, as follows:
Cu3Se2 + H2SeO3 + 4H+ + 4e- → 3CuSe + 3H2O
H2SeO3 + 4H+ + 4e- → Se + H2O
As the deposition potentials decreases to around -0.6V, Indium will be
incorporated into the deposit. However, it was suggested that an
amorphous passive layer would be form with stoichiometry close to
CuSe2, that acts like a blocking absorbate, suspected to be In-Se
compound. This layer has low conductivity easily absorbed onto the
surface. After the formation In-Se compound, CuInSe2 will be formed
according to the general reaction as stated above:
Cu(II) + 2H2SeO3 + In(III) + 8H+ + 13e- → CuInSe2 + 6H2O
2Cu(II) + H2SeO3 + 4H+ + 8e- → Cu2Se + 3H2O
In addition to the formation of CuinSe2, Se was also produced together
with CuSe binary phase concurrently. As the deposition potential
further reduced, the “passivation” effect would be lifted off as the
deposition current were limited by diffusion of Se(IV) and Cu(II) ions. In
another words, composition is mainly governed by the ratio of the Cu
and Se in solution and the kinetics of indium reaction.
Moreover, Chaure et al [8] have extensively studied the growing both
p+ and n+ layers by electrodeposition, which is useful for forming good
ohmic contacts to both p-, and n- type CIS layers. The conductivity type
of the deposited layers was obtained in terms of structural and
electrical properties through PEC measurements, verified with XRD
and XRF. Furthermore, by varying the deposition potential, it is
possible to deposit p-, i- and n-type materials directly from a single
Page 3
deposition bath. The electrical parameters could be manipulated to
control the film’s properties, structure and composition.
Studies have been made in growth of copper indium diselenide
compound by electrodeposition on Mo-coated glass (FTO), Roussel et
al indicates that the growth of CuSe phase on the initial nucleation
before corporation of Indium can proceed, moreover, the publication
shown that In/Cu ratio relations increase with deposition time [18].
In addition, Phok et al [15] had successfully grown CuInSe2 nanowires
on porous alumina templates by pulse plating, which gave a CuInSe2
composition close to stoichiometry. The purpose of this thesis is to
further study the electrodeposition processes for the preparation of thin
film CuInSe2 on Mo substrates, produced by Mo sputtered on wafer
and directly Mo metal strip, to obtain p-, i- and n-type conductivity from
a single chemical bath by both direct current and pulse plating profile.
Page 4
1.1 THIN
FILMS
SOLAR
CELLS
–
COPPER
INDIUM
DISELENIDE
History of CuInSe2 solar cells works were initiated at Bell laboratories
in the early 1970s [22] where they grew a wide selection of these
materials and characterized their structural, electronic and optical
properties. However, optimized efficiency is only 12% back then.
CuInSe2 was considered promising for solar cell because of it favorable
electronic and optical properties, including direct bandgap with
absorption coefficient and inherent p-type conductivity which will be
further discussed in the following section.
CuInSe2 have chalcopyrite lattice structure, is a diamond-like structure,
similar to sphalerite structure, with an order substitute of Group I (Cu)
and Group III (In) elements on the Group II (Zn) sites of sphalerite. The
diagram below shows a tetragonal unit cell of chalcopyrite lattice
structure.
Figure 1: the unit cell of chalcopyrite lattice structure
Page 5
The deviation from c/a =2 is called the tetragonal distortion and stem
from different strengths of the Cu-Se and the In-Se bonds. Possible
phases in Cu-In-Se system are indicated in the ternary diagram below:
Figure 2: Ternary phase diagram of Cu-In-Se system. Thin film composition near
pseudo-binary Cu2Se-In2Se3 tie line
Chalcopyrite CuInSe is located in this line. A detailed Cu 2Se-In2Se3 tieline near CuInSe2is described by the pseudo-binary phase diagram
reproduced in the figure below:
Page 6
Figure 3: Pseudo-binary phase diagram of Cu-In-Se system
The chalcopyrite CuInSe2 phase is denote as α, δ is a high
temperature phase with sphalerite, and β is an ordered defect
compounds (ODC) known to have chalcopyrite structure with
structurally ordered insertion of intrinsic defects. At lower temperature,
single phase field for CuInSe2 is relative narrow and does not contain
the composition of 25% Cu. However at higher temperature around
500°C, thin films are typically grown, and phase field widen towards the
In-rich side. Typically average composition of device-quality film has
22-24% Cu, which falls within a single phase region at growth
temperature.
Generally most of the solar cells are made of mono or polycrystalline
silicon. However, silicon is not an ideal absorber material for solar cells
due to the presence of indirect band gap which does not absorb light
Page 7
as efficient as those with direct band gaps. In order to achieve
sufficient light absorption, very thick and high quality silicon is used in
solar cells and to allow for minority carrier lifetimes and diffusion length
long enough such that recombination of the photo-generated charge
carriers is minimized, to contribute to the photocurrent. Kasap [12]
mentioned that Si-based solar cell efficiencies ranges from 18% for
polycrystalline, up to 24% in high efficiency single crystal devices that
have special structures to absorb as much photons as possible, known
as homojunctions. The best Si-homojunction solar cell efficiencies are
about 24% for single crystal passivated emitter rear locally diffused
cells.
Nevertheless, due to the limitations of crystalline silicon, other absorber
materials have been studied extensively, such as semiconductor with
direct band gap with high absorption coefficients were studied for thin
film application in solar cells.
Several advantages of thin film solar cells is preferred over crystalline
silicon, in consideration of the follow, namely; usage of less material
typically
few
micrometers,
therefore
impurities
and
crystalline
imperfections can be greatly reduced relative a crystalline silicon.
Secondly, there are a wide variety of processes to obtain thin films on
inexpensive substrates (e.g. glass) as well as flexible substrate (e.g.
flexible pcb), Lastly, composition of the thin film can be easily
manipulate by processes.
Low cost thin film solar cell materials are usually CdTe (cadmium
telluride), amorphous hydrogenated Silicon (a Si:H) and CuInSe2
(Copper Indium Diselenide) and its alloy either Ga and/or S.
Amorphous silicon has higher absorption coefficient and closer
bandgap of 1.5eV from the ideal, than that of polycrystalline silicon.
However, the major disadvantage of amorphous silicon made solar cell
is the light-induced degradation leading to a drop of conversion
efficiency from the initial value, knowning as "Staebler-Wronski effect".
Page 8
This results from
defects (such as dangling bonds) created by
illumination that acts as recombination centers, causing stabilization
efficiencies of amorphous silicon solar cell to be as low as 13% as
mentioned by Kermell [13].
Unlike amorphous silicon, polycrystalline compound semiconductor
materials such as CdTe (cadmium telluride) and CuInSe2 (Copper
Indium diselenide) and its alloy either Ga and/or S, do not face lightinduced degradation. In addition, CuInSe2-based solar cell shown
improvement after illumination under normal operating conditions.
Besides,
polycrystalline
compound
semiconductors
have
high
absorption coefficient due the direct bandgaps.
In this thesis studies, CuInSe2 were chosen as the absorber material
for studies. Although the bandgap is 1.04eV, the feasibility of vary the
bandgap by altering the material composition with alloy such as Ga or
S, may achieve high bandgap of 1.5eV of CuGaS 2. Studies shown that
by altering the composition, CuInSe2 can either be p-type or n-type,
Kermell [14].
1.2 PHOTOVOLTAIC DEVICES
As solar cells, or photovoltaic devices, convert energy from the sunlight
into electricity. Power generation part of a solid-state solar cells consist
of a semiconductor that forms a rectifying junction either with another
semiconductor or with another metal, producing an pn-diode or
Schottky diode. However, there are some junctions such as
semiconductors-insulators-semiconductors
or
a
metal-insulator-
semiconductors junction were form by a thin film placed in between two
semiconductors or a semiconductor and a metal. A pn-junction are
therefore classified into homojunction and heterojunction according to
whether the semiconductor materials on one side of the junction is the
Page 9
same as or different from that on the other side. Thin film solar cells are
typically pn- or pin-diodes.
When the junction is illuminated with applied/external source, the
semiconductor material absorbs the incoming photons when the
energy (hv) is higher than that of the band gap of the semiconductor,
forming an electron-hole pairs. These photogenerated electron hole
pairs are separated by the internal electric field of the junction, whereby
the electrons drifts to one side remaining the holes at the other side.
Figure 4: Schematic energy band diagram of a pn-heterojunction solar cell at various
condition
The figure above illustrates a schematic energy band diagram of a pnheterojunction
solar
cell
(a)
thermal
equilibrium
without
any
illumination, (b) under forward bias, (c) under reverse bias influences,
(d) when illuminated open circuit conditions.
1.3 DOPING AND DEGENERACRY OF SEMICONDUCTOR
As mentioned in previous section, being a semiconductor materials,
solar cells have weakly bonded electrons occupying a band of energy
Page 10
called the valence band. In a nutshell, when the energy exceed a
certain threshold of the material known, as the bandgap energy, is
applied to a valence electron, the bonds are broken and the electron is
"free" to move around in a new energy band called the conduction
band where it can "conduct" electricity through the material. Therefore
these free electrons in the conduction band are separated from the
valence band by the bandgap, measured in electron volt (eV). This
energy needed to free an electron can be supplied by photons.
Figure 5: Schematic of solar cell where electrons are pumped by photons from the
valence band (VB) to conduction band (CB), and extracted by a contact selective to the
conduction band (an n-doped semiconductor) at a higher (free) energy and delivered to
an external load, and returned to the valence band at a lower (free) energy by a contact
selective to the valance band (a p-type semiconductor).
When a solar cell is exposed to external illumination or an applied field
of sufficient energy, the incident solar photon is absorbed by the atoms,
breaking the bonds of the valence electrons and pumping them up to
higher energy in the conduction band (CB). Excitation of an electron
form the valence band (VB) requires a minimum energy of a bandgap
of the semiconductor, denotes as the Eg, to the CB. Correspondently,
a "hole" is create at the VB. An electron-hole pair is thus created.
Page 11