Electrochemical generation and processing of porous silicon
Bạn đang xem bản rút gọn của tài liệu. Xem và tải ngay bản đầy đủ của tài liệu tại đây (1.67 MB, 117 trang )
ELECTROCHEMICAL GENERATION
AND PROCESSING OF POROUS SILICON
LIU MINGHUI
(B. Sc., Fudan University)
A THESIS SUBMITTED
FOR THE DEGREE OF MASTER OF SCIENCE
DEPARTMENT OF MATERIALS SCIENCE
NATIONAL UNIVERSITY OF SINGAPORE
2004
Acknowledgement
To keep the project running, my own effort is not enough. Therefore, I would like to
express my most sincere gratitude to my supervisor, Dr. D.J. Blackwood for his never
yielding patience, guidance and his considerate personality. Under his mentorship, I have
not only learnt many lessons in science, but also about life in general, which include
humility, honesty and kindness.
I would also like to thank Ee Jin and Emmanuel from Physics Department for their
collaboration work. Furthermore, my gratitude to all the people who have helped me one
way or another during my research work, Dr. Tok for useful discussion, the technicians
in the department and other institutions for the use of equipments.
Meanwhile, I would like to thank my friends and colleagues that I got to know in
Singapore for their friendship and encouragement. A big thank you goes out to Xiaoping
and Jianqiao, for your forever friendship and wonderful words that is a constant reminder
of what’s truly important and what’s not. Last but not the least, I am eternally grateful to
my parents for their unconditional support and encouragement.
I
Table of Contents
Acknowledgement
Ⅰ
Table of Contents
Ⅱ
Summary
VI
List of Tables
VIII
List of Figures
IX
Chapter 1
INTRODUCTION AND LITERATURE REVIEW
1
1.1
What is Porous Silicon?
1
1.2
Motivations behind the Current Research
2
1.2.1
Optoelectronic applications
2
1.2.2
Porous silicon diodes
3
1.2.3
Sensor applications
4
1.2.4
Solar cells applications
5
1.2.5
Other applications of porous silicon
6
1.3
Porous Silicon Formation Models
7
1.4
Porous Silicon Luminescence Mechanism
9
1.4.1
Quantum confinement theory
10
1.4.2
Molecular complexes
11
1.4.3
Surface states model
12
II
1.5
Micromachining Applications of Porous Silicon
13
1.5.1
The requirements for a good sacrificial layer
13
1.5.2
Bulk micromachining
14
1.5.3
Surface micromachining
14
1.5.4
LIGA
15
1.6
Etching Processes
16
1.6.1
Wet chemical etching
16
1.6.1.1
Anisotropic etching
17
1.6.1.2
Isotropic etching
20
1.6.2
Dry etching
22
1.7
MEMS Applications
24
1.7.1
Biotechnology
24
1.7.2
Accelerometers
25
1.7.3
Communications
25
1.8
Thesis Layout
26
References
27
Chapter 2
EXPERIMENTAL
30
2.1
Fabrication of Porous Silicon
30
2.1.1
Silicon electrode preparation
30
2.1.2
Cell Set Up
32
2.2
Chemical Etching of Silicon
34
2.3
Post-Treatment of the Porous Silicon
34
III
2.3.1
Luminescence samples
34
2.3.2
Micromachinary samples
35
2.4
Micromachinary of the Silicon Wafer
35
2.5
Sample Characterization
36
2.5.1
Optical microscope
36
2.5.2
Scanning Electron Microscopy
37
2.5.3
Luminescence properties of PS
37
2.5.4
Profilometer
38
2.6
Types of Silicon Wafers
39
References
40
Chapter 3
STUDY OF POROUS SILICON
41
3.1
Influence of HF Concentration
41
3.2
Influence of Conductivity
42
3.3
The Effect of Stirring during Etching
43
3.4
PL under Different Current Densities
45
3.5
PL under Different pH
49
3.6
Incorporating H2O2 during Etching
52
References
58
Chapter 4
SILICON MICROMACHINARY
59
4.1
Preliminary Studies
61
4.1.1
Anisotropic etching
61
IV
4.1.2
Isotropic electrochemical etching
66
4.1.3
The effect of wafer type under proton and helium irradiation
67
respectively
4.2
Step-set Structures
69
4.3
Cantilever Structures by Single Energy Irradiation
74
4.4
High Aspect Ratio Belt Formation
76
4.5
Multilayered Structures by Double Energy Irradiation
79
4.6
Grating Structures
81
4.7
High Aspect Ratio Spikes
82
References
86
Chapter 5
CONCLUSION
87
Chapter 6
FUTURE WORK
90
Appendix
DIRECT BEAM WRITING
93
A.1
Nuclear Microbeam Facility
93
A.2
Method of Irradiation
100
A.3
Choices of Beam
101
References
104
V
Summary
Porous silicon has attracted great interests to the fields of optoelectronics,
microelectronics and biotechnologies due to its properties of photoluminescence and
electroluminescence. The work for this thesis consisted mainly of two parts.
In the first part a detailed study on the relationship between the morphology of porous
silicon and its photoluminescence properties with respect to the components and
conditions of the etching solution, the current density, etching time has been carried out.
In particular it was desired to obtain a blue shift the photoluminescence, which is
normally red in colour. It was found that higher pH and lower currently density improved
the quality of the photoluminescence obtained from the porous silicon formed. The green
photoluminescence (F-band) was stabilized by the higher pH. Lower current density
leaded to a decrease in the Full-Width Half-Maximum in photoluminescence spectra,
presumably due to a narrower distribution in the size pf the porous silicon
nanocrystallites produced. The addition of hydrogen peroxide was found to greatly
improve the stability of the green luminescence. However, as yet it is has not possible to
determine whether this is due to the structure of the porous silicon formed by H2O2–
assisted etching being more uniform than without H2O2 conditions or if the observed
green photoluminescence arises from the production of silicon dioxide.
The second part of the work in this thesis involved investigating the use of porous silicon
as a sacrificial layer for the microfabrication of structures. Many new technologies, for
example nanoelectromechanical systems and photonic crystal, require the fabrication of
VI
precise three-dimensional (3D) structures, preferably in silicon. Major limitations of
conventional lithography and silicon etching technologies are the multiple processing
steps involved in fabricating freestanding multilevel structures and undercutting of
masking layers and the etch stop techniques. The alternative technique reported in this
thesis utilizes direct-writing by fast-proton irradiation prior to electrochemical etching
for three-dimensional microfabrication in bulk p-type silicon; the technique is both
maskless and requires less processing steps than conventional lithography. The protoninduced damage increases the resistivity of the irradiated regions and acts as an etchretardant for porous silicon formation via electrochemical etching. A raised bulked
silicon structure of the scanned area is left behind after removal of the porous silicon
formed in the unirradiated regions with potassium hydroxide. By exposing the silicon to
different proton energies, the implanted depth and hence structure height could be
precisely varied. The work in this thesis demonstrates the versatility of this new threedimensional direct-writing patterning process to create multilevel freestanding bridges in
bulk silicon, as well as submicron pillars and high aspect-ratio nanotips. When the
etching went beyond the maximum penetration depths of the irradiating protons into the
bulk silicon depth, undercutting occurred. Taking advantage of this undercutting,
freestanding and cantilever structures were obtained. Finally by using different dose on
one pattern, multilayered structures were produced.
VII
List of Tables
Table 1 Conventional porous silicon classification.
Table 2 Difference between anisotropic and isotropic wet etching.
Table 3 Silicon wafers used during study.
Table A.1 Compared results of simulated ion penetration in silicon with SRIM 2000.
VIII
List of Figures
Figure 1.1 Typical LED structure with ITO contact layer.
Figure 1.2 A conceptual view of the solar-cell structure.
Figure 1.3 Proposed dissolution mechanism of silicon electrodes in HF associated with
porous silicon formation.
Figure 1.4 Typical J-V curve of p-type silicon in dilute aqueous HF solution.
Figure 1.5 Schematic representation of a one-dimensional quantum well.
Figure 1.6 The chemical dissolution of (100) silicon surfaces in alkaline solutions.
Figure 1.7 The chemical dissolution of (111) oriented surfaces in alkaline solutions.
Figure 1.8 Anisotropic etching profile of (100) and (110) silicon in heated KOH.
Figure 1.9 Isotropic etching profile.
Figure 2.1 Electrochemical etching setup for P-type silicon.
Figure 2.2 Operation mechanism of stylus profilometer.
Figure 3.1 Different morphologies of porous silicon under different etching conditions.
(a) 40 mA/cm2 for 5 min; HF: H2O: Ethanol= 1:4:5; (b) 60 mA/cm2 for 3 min; HF: H2O:
Ethanol=1:1: 2.
Figure 3.2 Luminescence area and SEM image of DB (100).
Figure 3.3 The effect of stirring the solution during etching. (a) 20 mA/cm2 etched for 3
min; (b) 20 mA/cm2 etched for 30 min.
Figure 3.4 PL under different current densities, etching time 10 min. (a) 10 mA/cm2; (b)
20 mA/cm2; (c) 30 mA/cm2; (d) 40 mA/cm2.
Figure 3.5 The effect of the relative ratio of oxides/nanocrystals on PL.
IX
Figure 3.6 Bulk area PL observed by adding NaOH to etching solution collected form
three different locations on a single sample.
Figure 3.7 “Edge” PL observed by adding NaOH to etching solution.
Figure 3.8 PL of porous silicon etched in H2O2 at different etching conditions by a handheld UV lamp (a) 10 mA/cm2; (b) 40 mA/cm2 for 10 min.
Figure 3.9 Morphologies of porous silicon etched at 20 mA/cm2 for 10 min in the
presence of H2O2 obtained at different areas of the sample (a) in the centre; (b) on the
edge; (c) deeply-etched area; (d) the “wall”.
Figure 3.10 Comparation of “honeycomb” size under different current densities etched
for 10 min. (a) 10 mA/cm2, plan view; (b) 10 mA/cm2, tilt 45 degree; (c) 40 mA/cm2, plan
view; (d) 40 mA/cm2, tilt 45 degree.
Figure 3.11 The inside structures of the pore of “honeycombs”.
Figure 3.12 PL from H2O2–assisted sample at a current density of 20 mA/cm2 for 10 min.
Figure 4.1 Schematic fabrication process for three-dimensional micromachining using a
focused MeV light-ion beam, showing (a) sample irradiation, (b) electrochemical etching
and (c) porous silicon removal in diluted KOH solution.
Figure 4.2 GF100 Etched in Heated KOH for 5 min. (a) general view; (b) part view.
Figure 4.3 GF110 etched in heated KOH for 5 min. (a) general view; (b) part view.
Figure 4.4 GF110 etched in heated KOH for another 5 min. (a) general view; (b) part
view.
Figure 4.5 Gratings by chemical etching and electrochemical etching. (a) chemical
etching; (b) electrochemical etching.
X
Figure 4.6 The squares formed by 2MeV helium irradiation. (a) DT100 (10~20 Ω·cm),
(b) GF100 (5~10 Ω·cm), (c) DB100 (0.02~0.03 Ω·cm).
Figure 4.7 Microneedle structures obtained by irradiation of 2MeV proton beam. (a)
DB100, (b) GF100.
Figure 4.8 (a) Etching depth as a function of time. (b) Height of a square irradiated with
6×10¹⁴/cm2, as a function of time. Etching current 40 mA/cm2.
Figure 4.9 Multilevel step-set structures: step1~1000 nC/mm2, step2~4000 nC/mm2,
step3~30000 nC/mm2.
Figure 4.10 Step-set irradiation patterns and the expected structures.
Figure 4.11 Three step structures: step1~1000 nC/mm2, step2~2000 nC/mm2,
step3~3000 nC/mm2.
Figure 4.12 Undercutting of a multiple irradiated structures: (a) 500 nC/mm2, (b) 2000
nC/mm2.
Figure 4.13 Preliminary structures for (a) freestanding bridge and (b) cantilevers.
Figure 4.14 Irradiation patterns for high aspect ratio structures. (a) loop irradiation;
(b) with a small opening; (c) with an opening side.
Figure 4.15 The structure of loop irradiation.
Figure 4.16 High aspect ratio “Great Wall” structures. (a) with a small opening; (b)
with an opening side.
Figure 4.17 The double-energy irradiation pattern.
Figure 4.18 The multiple layered structures formed by double-energy irradiation. (a) At
etch depth of 14 µm, the bridge starts to separate from the substrate. (b) The bridge is
completely freestanding at an etch depth of 25 µm.
XI
Figure 4.19 Grating structures obtained by 2MeV photon beam.
Figure 4.20 Preliminary structures of high aspect ratio spikes. (a) general view; (b) part
view.
Figure 4.21 Array of high aspect ratio pillars obtained by single spot irradiations. (a)
side view; (b) top view.
Figure 4.22 Sharp spikes obtained when the beam is channelled along the <100> crystal
axis. (a) side view; (b) top view.
Figure 4.23 Applications of an array of spikes as a scaffold for colloids arrangements.
(a) general view; (b) part view.
Figure 4.24 Structures obtained by beam tilting. (a) top view; (b) side view.
Figure A.1 General layout of the microprobe.
Figure A.2 Curvature of the beam and sorting of ions.
Figure A.3 RBS detection principle.
Figure A.4 Micromachining chambers: (a) 10-degree, (b) 30-degree.
Figure A.5 Irradiation of a sample. (a) without scanning; (b) with the scan amplifier;
(c) with Ionscan.
Figure A.6 Simulation of a 2MeV proton beam in silicon using SRIM2000. (a) top view
of ion penetration; (b) collision events.
Figure A.7 Simulation of a 2MeV helium beam in silicon using SRIM2000. (a) top view
of ion penetration; (b) collision events.
XII
Chapter 1
Introduction and Literature Review
CHAPTER 1 INTRODUCTION AND LITERATURE
REVIEW
1. 1 WHAT IS POROUS SILICON?
Generally speaking, porous silicon (PS) can be described as a network of nanometersized (sponge-like) silicon regions surrounded by void space. Basically, there are two
ways to prepare porous silicon, chemical etching and electrochemical etching. However,
electrochemical etching is the generally accepted method because of its easy set-up and
operation. Following an electrochemical reaction occurring at the silicon surface, the
porous structures with the crystallite sizes of several nanometers are formed. Such
structures can give out light in the visible range under stimulation by UV light. The usual
classification of porous silicon in terms of its pore size (Table 1) is not very useful when
concerned with its luminescence, as will be explained in chapter 1.4; the luminescence is
related to the size of the silicon crystallites, and not directly to the size of the pores.
Table 1 Conventional porous silicon classification. [1]
Classification
pore diameter(nm)
surface area (m2/cm3)
Macroporous
>50
10-100
Mesoporous
2-50
100-300
Microporous
<2
300-800
1
Chapter 1
Introduction and Literature Review
1.2 MOTIVATIONS BEHIND THE CURRENT RESEARCH
The electronic revolution, that has made a very profound impact on every aspect of life
today, has been made possible by microminiaturization, a high level of functional
integration with a simultaneous reduction of cost. The integration of optical components
onto a silicon-based chip allows for further functional integration and consequently the
realization of new concepts [2]. However, bulk silicon is an indirect-bandgap
semiconductor and has a low optical efficiency, so it has little application in lightemitting devices. Ever since the advent of visible room-temperature luminescence from
porous silicon in 1990 [3], researchers have made huge strides towards building
optoelectronic circuitries based on silicon. Porous silicon thin films are of great interest
for application in a number of areas: optoelectronics, sensors, microelectronics,
micromachining etc. Though the real application in industrial operation has a long way
to go, the results of the current research are encouraging.
1.2.1 OPTOELECTRONIC APPLICATIONS
There is an increasing demand for light-emitting devices for displays and
communication. There are three main components for the optoelectronic devices,
namely, light emitting devices (LEDs), photodetectors (PDs) and optical waveguides
(WGs). Among them, LEDs are intensively studied [4-6]. There are various methods
making contacts to porous silicon as the diode, such as sputtered gold, indium tin oxide
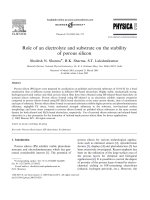
(ITO) and polymer thin film. Figure 1.1 illustrates the typical LED structure with ITO
contact layer. The ITO contact can be replaced by other kind of contacts.
2
Chapter 1
Introduction and Literature Review
Al/Au contact
ITO
PS
P-Si
P+-Si
Al contact
Figure 1.1 Typical LED structure with ITO contact layer.
For display purposes, the power efficiency of EL should be at least 1%, the operating
voltage below 10V, the EL time response below 1ms, and the stability longer than
10,000hr [7]. High porosity porous silicon with 3% quantum efficiency was prepared by
Vial et al via well-controlled electrochemical oxidation [8]. With regards to porous
silicon based EL emission, these requirements have not been fully reached [9-13] and
further work needs to be carried out.
1.2.2 POROUS SILICON DIODES
For porous silicon research, it is common to make the diode either with a liquid contact
or a solid-state contact to observe its behaviour and properties. The most common diode
structures to have been reported are contact1/PS/Si/contact2 and contact1/PS/contact2.
The contact1 and contact2 may be the same or different materials, usually a metal or
conducting oxide. Porous silicon diodes usually exhibit rectification in their current
density (J) versus voltage (V) characteristics. Porous silicon diodes have been analyzed
3
Chapter 1
Introduction and Literature Review
in terms of the two most familiar types of rectifying diode: the Schottky barrier and the
p-n junction. For an ideal Schottky barrier diode, the J-V characteristics can be described
by the Richardson-Schottky equation:
J=J0 exp[(qV/kT)-1]
(1.1)
where k is the Boltzmann constant, T is the absolute temperature and J0 is the reverse
saturation current density. After correcting for the non-ideality factor and series
resistance Rs, the equation. can be modified as:
J=J0 exp[(q(V-JARs)/nkT)-1]
(1.2)
where A is the area of the contact at the Schottky barrier, n is non-ideality factor. For an
ideal p-n junction diode, the J-V characteristics are described by the Shockley equation.
Though the form of Shockley equation is the same as Richardson-Schottky equation,
there are fundamental differences in the mechanism: the Shockley equation is formulated
on the assumption that current is controlled by the diffusion of minority carriers, where
J0 is related to parameters describing the diffusion. However, the current in RichardsonSchottky equation is determined by thermionic emission of majority carriers over a
potential barrier. The value of n also is different for the two different diode types.
1.2.3 SENSOR APPLICATIONS
The high surface area and easy integration of porous silicon into microelectronics make
it a suitable source for sensors. Sensing could be achieved by exploiting changes in
conductivity, capacitance or photoluminescence when molecules adsorb to its surface.
Recent investigations into the use of porous silicon sensor achieved some success in the
following areas: HF [14] and NO2 gas sensor [15-16]; biosensor [17] porous silicon4
Chapter 1
Introduction and Literature Review
based humidity sensor [22, 23]; downsizing of porous silicon sensor to achieve micro
toxic gas sensors [24].
1.2.4 SOLAR CELL APPLICATIONS
Figure 1.2 shows a conceptual view of a solar-cell structure based on the possibility of
realizing the ohmic contact directly onto a thin macroporous silicon upper layer.
Transparent contact layer
Porous Silicon layer
Bulk Silicon layer
Metal Contact layer
Figure1.2 A conceptual view of the solar-cell structure.
There are several advantages in using porous silicon in solar cells [21].
•
The highly texturised surface of the porous silicon can enhance light
trapping and reduce reflection losses of a solar cell.
•
The adjustability of the bandgap of porous silicon may be utilized to
optimize the sunlight absorption.
5
Chapter 1
•
Introduction and Literature Review
The relatively wide bandgap qualifies it as the window layer in a
heterojunction cell or as the active layer for the top cell in a tandem-cell
approach and may be used to form a front or rear surface field in a diffused
junction silicon solar cell.
•
Porous silicon can be used for solar light transformation from an ultraviolet
range to long wavelength range and is optimum for photovoltaic conversion
in silicon solar cell.
•
The porous silicon developed surface with its high chemical activity can
serve as an effective impurity gettering in crystalline silicon solar
substrates.
•
The simplicity of porous silicon technological formation is appealing for
solar cell cheap fabrication.
However, at present, acceptable results have only been obtained for the use of porous
silicon as an antireflecting coating on silicon solar cells. Most of these studies are still in
the pioneering phase and more work will be needed before we can fully integrate these
new concepts with the manufacturing processes of commercial solar cells [22-25].
1.2.5 OTHER APPLICATIONS OF POROUS SILICON
Porous silicon also acts as a sacrificial layer in the processes of micromachining, which
will be discussed in chapter 1.5. There are also some novel applications of porous silicon
in the fields of biomedical materials [26], capacitors [27], medicine [28], biotechnology
6
Chapter 1
Introduction and Literature Review
[29-33] and even astrophysics [34]. Because of restricted space, these will not be
discussed further in this thesis.
1.3 POROUS SILICON FORMATION MODELS
The formation mechanism of porous silicon has been studied for a long time [35] but it is
still in dispute. Even the pore initiation models offered today have some disagreement
among themselves [36]. In this chapter, only the most convincing theories related to the
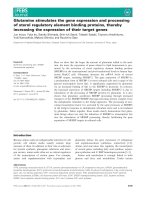
research work done for this thesis are reviewed. The silicon dissolution mechanism can
be well described by the Figure 1.3.
B
A
Si
Si
H
H
Si
Si
Si
+
+h
Si
Si
H
Si
Si
Si
.
H
+H
+
h +H2O
H
F
+
Siδ
H
Si
H
Si
+H
+
H
Si
+F
-
-OH -
H
E
D
Si
Si
H
Si
-
H
OH
Si
+
H
Si
H
Si δ
C
Si
H
Si
+2H2O
H
H
Si
Si
H
HO
+
Si
HO
F
+H 2O , +HF
(in solution)
X
X
+
Si
X
H2 (X= OH, F)
F
H
Figure 1.3 Proposed dissolution mechanism of silicon electrodes in HF associated with
porous silicon formation. Adapted from [37] P. Allongue, V. Kieling, H. Gerischer, Electrochim. Acta 40: 1353 (1995).
7
Chapter 1
Introduction and Literature Review
In step A, a hole (h+) reaches the surface and attacks the Si-H bond, the higher the
current density, the greater the flux of holes to the surface. It is known that porous silicon
only forms when the current density is below a critical value, Jep (Figure 1.4). This
critical value is determined by the concentration and viscosity of electrolyte, the
geometry of the silicon anode as well as the physical properties of the silicon-electrolyte
interface. The crucial part of the mechanism is the relative rates of steps A, B and C. If
the applied current density J is higher than Jep, i.e. step A and B is faster than step C, the
surface becomes completely covered by an oxide or hydroxide and electropolishing
occurs. The rates of steps A and B are proportional to the rate of holes to the surface, so
if the current density is lower than Jep, step C will be faster than step B, the hydroxide is
replaced by a fluoride which polarises and weakens the silicon-silicon back-bonds so that
the individual silicon atoms are removed and porous silicon forms. However, HF is a
weakly dissociating acid, when diluted in water it dissociates into H+, F- and various
hydrofluoric species such as HF2- and (HF)2 according to the reactions:
HF
HF + F-
2HF
H+ + F HF2-
(HF)2
with K1 = [H+][F-]/[HF]
with K2 = [HF2-]/[HF][F-]
with K3 = [(HF)2]/[HF]2
where K1, K2 and K3 are the equilibrium constants. If the concentration of HF2- is higher
than F-, the reactive species in step C is HF2- rather than F-.
8
Chapter 1
Introduction and Literature Review
J
Jep
0
V
Figure 1.4 Typical J-V curve of p-type silicon in dilute aqueous HF solution.
1.4 POROUS SILICON LUMINESCENCE MECHANISM
Luminescence from porous silicon was observed over a decade ago, but scientists have
struggled to develop a mechanism to describe its photophysical properties. Traditionally,
the photolumincesence of porous silicon can be divided into two regions: the red band
and the green-blue band. The red band peak intensity extends from about 1.3eV (950nm)
to 2.1eV (590nm). The decay times at room temperature of the red band are of the order
of several microseconds, and the red band is therefore also termed the slow-band (Sband) photolumincesence. The green-blue band peak intensity extends from about 2.1 eV
(590nm) to 2.4eV (510nm). In contrast to the red band, the green-blue band commonly
shows decay times in the nanosecond regime and is therefore termed the fast-band (F9
Chapter 1
Introduction and Literature Review
band). Several mechanisms have been proposed to play a role in the visible
photoluminescence from porous silicon layers. The basic mechanisms, which have
received the most attention, are quantum confinement theory, molecular complexes and a
surface states model.
1.4.1 QUANTUM CONFINEMENT THEORY
In 1991, Lehmann and Gõsele [38] suggested that porous silicon was made up of
nanometer-sized crystalline silicon regions that possess, as a result of quantum
confinement, a higher bandgap (Econfined) relative to the bulk crystalline silicon bandgap
(Ebulk).
Figure 1.5 shows a schematic diagram of a semiconductor quantum well. In the well
electrons in the CB and holes in the VB are confined spatially by potential barriers, such
as the surfaces of a nano-sized crystal.
Conduction band
Econfined gap
Ebulk gap
Valence Band
Figure1.5 Schematic representation of a one-dimensional quantum well.
10
Chapter 1
Introduction and Literature Review
As a consequence of the confinement of both electrons and holes, the lowest energy
optical transition from the valence to the conduction band increases in energy, effectively
increasing the bandgap.
Employing a simple effective-mass approximation, the confined gap is given by the
equation.
E confined = E bulk +
h 2π 2
2
⎡ 1
1
1 ⎤⎡ 1
1 ⎤
+
+
+
⎢ 2
⎥
⎢
2
2
*
*⎥
⎢⎣ω x ω y ω z ⎥⎦ ⎣ mc mv ⎦
((1.2)
where ωn = dimensions of confined region assumed to be a box with n = x, y, z, h =
Planck’s constant and m*c, m*v = effective mass of the e- in the conductive band and h+ in
the valence band, respectively. From this equation, it can be seen that as the dimensions
of the confined space decreases, Econfined increases. It approximates to a transition energy
of about 2eV for a particle size of roughly 3 nm. However, this approach for calculation
of bandgap is too simplistic; it does not take into account the non-parabolicity of the CB,
the detailed shape of the VB, nor the influence of neighbouring bands. A review of the
using more sophisticated models that have been used to calculate of Econfined by several
groups has been conducted by Collins et al [39]. Vial et al provided further confirmation
of the quantum dot model [8].
1.4.2 MOLECULAR COMPLEXES
Prokes et al [40] proposed that the light emission from porous silicon was due to the
presence of hydride complexes (SiHx), that form deep bonding states within the silicon
11
Chapter 1
Introduction and Literature Review
valence bands leading to enlarged bandgaps. Another model, proposed by Brandt et al
[41], suggested that siloxane (Si6O3H6) was the species responsible for luminescence
based on the similarity on the light emission characteristics of porous silicon and
chemically synthesized siloxane. However, evidence against these molecular species
theories exists, since samples with no detectable hydride bonds or oxygen have been
shown to still exhibit strong red luminescence.
1.4.3 SURFACE STATES MODEL
This is a hybrid model between the two extremes (quantum confinement and molecular
species) that has been favoured by several groups and involves the existence of surface
states, which acknowledges that a size-dependent blue-shift in the optical absorption is
due to the small size of the nanocrystals, but also assumes luminescence occurs via
transitions involving surface states [42,43]. This model can account for the luminescence
in the range of 1.4 to 3 eV. The blue luminescence (2.7 to 3.0 eV) originates from a
confinement length of 0.6 to 1.2 nm. Surface states can also explain the fixed
photoluminescence energy of thermally oxidised nanoparticle systems [44]. Oxidation
encloses the crystallite core in a thick SiO2 mantle and so the perturbed silicon states are
now found at the interfacial SiO2 layer. It is postulated that the oxidised surface states
become localised states with fixed photoluminescence energy.
Furthermore, there are some researchers who believe that more than one mechanism is
responsible for the emission. For example, Fauchet et al [45] believes that the red band is
due to quantum confinement with possible contributions from surface states; the blue
12