Effect of solid solution ratio on anion adsorption on hydrous metal oxides
Bạn đang xem bản rút gọn của tài liệu. Xem và tải ngay bản đầy đủ của tài liệu tại đây (2.28 MB, 149 trang )
EFFECT OF SOLID-SOLUTION RATIO ON ANION ADSORPTION
ON
HYDROUS METAL OXIDES
THET SU HLAING
NATIONAL UNIVERSITY OF SINGAPORE
2004
EFFECT OF SOLID-SOLUTION RATIO ON ANION ADSORPTION
ON
HYDROUS METAL OXIDES
THET SU HLAING
B.E (Chemical) Yangon Technology University, Myanmar.
A THESIS SUBMITTED
FOR THE DEGREE OF MASTER OF ENGINEERING
DEPARTMENT OF CHEMICAL & BIOMOLECULAR ENGINEERING
NATIONAL UNIVERSITY OF SINGAPORE
2004
Acknowledgement
ACKNOWLEDGEMENT
I wish to record with genuine appreciation my indebtedness to my supervisor, Associate
Professor Robert Stanforth for his valuable advice and excellent guidance in the course of
this investigation, preparation of these manuscripts and above all his understanding and
sincere support.
Special thanks to my parents for their moral support and encouragement.
Particularly, my deepest appreciation is expressed to my friends May Su Tun, Ne Lin, Ma
Khin Yin Win, Ma Khin Moh Moh Aung, Ma Mya Mya Khin and all my friends for their
kind assistance and inspiration throughout this research.
I would like to thank all the technical and clerical staff in the Chemical & Biomolecular
Engineering Department for their patient and kind assistance.
I am grateful to all my laboratory colleagues Zhang Zunshe, Tian Kun and Zhong Bin for
their help on different occasions, discussion, and friendship.
I would especially like to thank the National University of Singapore, for the award of a
research scholarship and the Department of Chemical and Biomolecular Engineering for
providing the necessary facilities for my M.Eng program.
i
Table of Contents
TABLE OF CONTENTS
ACKNOWLEDGEMENT
i
TABLE OF CONTENTS
ii
SUMMARY
vi
NOMENCLATURE
ix
LIST OF FIGURES
xi
LIST OF TABLES
xiv
CHAPTER 1 INTRODUCTION
1.1
General Introduction
1
1.2
Objectives and Scope
3
CHAPTER 2 LITERATURE REVIEW
2.1
2.2
Goethite and Its Morphology
4
2.1.1 Goethite
4
2.1.2 Surface Morphology
4
Overview of Adsorption
6
2.2.1 Proposed Surface Reactions
7
2.2.2 Surface Complexation Modeling
2.2.2.1 Variations of the Surface Complexation
10
11
Models
2.2.2.2 Surface Precipitation Reaction
19
2.2.2.3 Surface Precipitation Model (SPM)
20
ii
Table of Contents
2.3 Kinetics Studies and Reaction Mechanism
22
2.3.1 Elovich Equation
23
2.4 Effect of Solid Solution Ratio
25
CHAPTER 3 MATERIALS AND EXPERIMENTAL DETAILS
3.1
Goethite Preparations and Characterizations
28
3.2
Individual Anion Adsorption Isotherms for Phosphate
29
and Arsenate at Varying pH
3.3
Phosphate Adsorption Isotherm at Different Solids
30
Concentrations
3.4
3.5
Measurement of Surface Coverage
31
3.4.1 Loss From Solution Method
32
3.4.2 Direct Analysis
32
3.4.2.1 Desorption Method
33
3.4.2.2 Acid Digestion Method
33
Error Analysis
34
CHAPTER 4 RESULTS AND DISCUSSION
4.1
4.2
Goethite Preparations and Characterizations
36
4.1.1 Calculation of Гmax
38
Direct analysis of Surface Coverage
41
4.2.1
42
Desorption of Phosphate by Different Desorbing
Solutions
4.2.2
Acid Digestion Method
43
iii
Table of Contents
4.3
Effect of pH on Phosphate and Arsenate Adsorption
46
Isotherms
4.4
4.3.1 Phosphate
46
4.3.2 Arsenate
48
Effect of Solids Concentration on Phosphate and
50
Arsenate Adsorption
4.4.1 Initial Studies - pH 3, 7, 10
4.4.1.1 Phosphate
50
4.4.1.2 Arsenate
53
4.4.2 Adsorption at pH 4
4.5
CHAPTER 5
REFERENCES
50
56
4.4.2.1 Effect of Solids Concentration
56
4.4.2.2 Kinetics of Reactions
63
Discussion
71
CONCLUSIONS AND RECOMMENDATION
76
5.1
76
Conclusions
79
iv
Table of Contents
APPENDICES
APPENDIX A
Experimental Data for Direct Analysis of Phosphate
88
adsorption
APPENDIX B
Experimental Data For Phosphate and Arsenate Adsorption
96
at Different pH
APPENDIX C
Experimental Data For Phosphate Adsorption at Different
108
Solids Concentration
v
Summary
SUMMARY
The reactions of ions at the oxide surface are usually modeled by assuming surface
complex formation with the metal ion in the solid, but some experimental results are
inconsistent with this assumption. According to the surface complexation model, the
reaction at the oxide surface involves one type of reaction: surface complex formation
only. One of the experiment results that is inconsistent with the surface complexation
model is the influence of the solids concentration on adsorption isotherm. One possible
explanation for the solids concentration effect is that the sorption process involves
precipitation as well as surface complex formation. Adsorption involves monolayer
coverage, while multi-layer coverage occurs during precipitation as well.
Previous studies at NUS have shown that solids concentration tends to influence
phosphate adsorption on goethite. Phosphate surface coverage is much higher in low
solids concentration slurries than in slurries of high solids concentration at the same
solution concentration. In this study, the effect of solids concentration on anion
adsorption on hydrous metal oxides has been studied using two different approaches.
First, adsorption isotherms and kinetics for phosphate adsorption on goethite at various
solids concentration were investigated to provide a better understanding of the reaction
mechanism. Phosphate adsorption isotherms depend strongly on pH. The initial phase of
this work involved the study of phosphate and arsenate adsorption on goethite at three
different pH levels and two different goethite concentrations. The results give a better
vi
Summary
understanding of the effect of pH on anion adsorption on goethite and at the same time,
shows that doubling the solids concentration has little effect on the surface coverage.
Second, the change in solids concentration on phosphate adsorption has been studied at
varying equilibration time using a wider range of solids concentrations. A direct
measurement of adsorbed phosphate on the surface was used to determine the adsorbed
phosphate at very low solids concentration. This method gave more reliable results
compared to the usual loss-from-solution method for samples with high phosphate
concentrations or very low goethite concentrations. The results showed that solids
concentration significantly impacts the adsorption isotherms at lower solids
concentrations. However, the effect was only observed for surface coverage above a
certain value, 70 µmol/g.
Adsorption kinetics followed a two stage process: a very rapid reaction initially, followed
by a much slower stage. The transition from very rapid adsorption to a slower process
occurred at around the same surface coverage as the transition point where the effect of
solids concentration was observed. Both effects probably reflect the transition from
adsorption to precipitation. Both results show good agreement for the point of the
transition from monolayer to multilayer surface coverage. The maximum monolayer
surface coverage found during the first reaction in experimental result is in good
agreement with the calculated monolayer surface coverage value based on B.E.T surface
area. In contrast, at a high phosphate concentration and low solids concentration, surface
coverage is much higher than the calculated monolayer coverage.
vii
Summary
These results suggest that precipitation may be occurring in the samples, and is most
apparent at a very low solids concentration.
viii
Nomenclature
NOMENCLATURE
a, b, c
unit dimension of goethite
C
The molar electrolyte concentration (M)
CCM
Constant Capacitance Model
CD-MUSIC
Charge Distribution – Multi-site Complexation Model
DLM
Diffuse Double Layer
EDL
Electrical Double Layer
F
Faraday’s constant (96490 coulomb/mol)
ICP-OES
Inductively Coupled Plasma- Optical Emission Spectroscopy
ICP-MS
Inductively Coupled Plasma- Mass Spectrometry
iep
iso-electric point
Kads
equilibrium constant for reaction
Kintr
equilibrium constant for chemical reaction between metal and the
surface site
KSPM
equilibrium constant for precipitation reaction of metal ion
KSPFe
equilibrium constant for precipitation reaction of Fe3+ ion
P
Orthophosphate – PO43-
PZC
point of zero charge
R
the molar gas constant (8.314 Jmol-1 K-1)
s
specific surface area of solid
SCM
Surface Complexation Model
SEM
Scanning Electron Microscope
ix
Nomenclature
SPM
Surface Precipitation Model
T
the absolute temperature (K)
TEM
Transmission Electron Microscope
TLM
Triple Layer Model
XRD
X-Ray Diffraction
Z
Charge of the ion
κ-1
double layer thickness (m)
Гmax
Estimated Maximum Surface Coverage
ρ
Density of Goethite (α-FeOOH)
σp
the net total surface charge (Cm-2)
ψ
The electric surface potential
ε
the dielectric constant of water (dimensionless)
εo
the permittivity of free space (8.854*10-12 C V-1 m-1)
α, β
Elovich’s constants
x
List of Figures
LIST OF FIGURES
Figure 2.1
Surface groups and structure of goethite.
5
Figure 2.2
Surface complex formation of an ion.
8
Figure 2.3
The diffuse double layer.
12
Figure 2.4
Arsenate (a and c), phosphate (b), and molybdate (d) single-anion
and binary anion adsorption envelopes on goethite with CCM
calculation using the one-site assumption.
15
Figure 2.5
Schematic representation of TLM Model.
16
Figure 2.6
Elovich analysis of phosphate adsorption kinetics data.
pH 4.5 and 0.595 g/l goethite concentration.
24
Figure 2.7
Effect of solids concentration on phosphate adsorption on goethite
(Li, 1998).
25
Figure 2.8
Effect of solids concentration on phosphate adsorption on goethite
(Ler, 2001).
26
Figure 4.1
SEM image of prepared goethite.
37
Figure 4.2
High resolution electron micrograph of synthetic goethite crystal
cut perpendicular to the needle axis [010].
38
Figure 4.3
Desorption of phosphated goethite with different desorbing
solutions
43
xi
List of Figures
Figure 4.4a
Phosphate adsorption isotherms at different pH values.
Goethite concentration = 0.5 g/l, Ionic strength = 0.001 M NaNO3
pH = 3, 7 and 10. Equilibration time = 24 hours
47
Figure 4.4b
Phosphate adsorption isotherms at different pH values.
Goethite concentration = 1 g/l, Ionic strength = 0.001 M NaNO3
pH = 3, 7 and 10. Equilibration time = 24 hours
48
Figure 4.5a
Arsenate adsorption isotherms at different pH values
Goethite concentration = 1 g/l, Ionic strength = 0.001 M NaNO3
pH = 3, 7 and 10. Equilibration time = 24 hours
49
Figure 4.5b
Arsenate adsorption isotherms at different pH values
Goethite concentration = 1 g/l, Ionic strength = 0.001M NaNO3
pH = 3, 7 and 10. Equilibration time = 24 hours
50
Figure 4.6
Phosphate adsorption isotherms at different solids concentration
(a) at pH 3, (b) at pH 7, (c) at pH 10.
Operation Conditions: Goethite concentration = 0.5 g/l, 1 g/l,
Temperature = 22ºC, Ionic strength = 0.001 M NaNO3 ,
Equilibration time = 24 hours, Surface coverage method used = loss
from solution method.
52
Figure 4.7
Arsenate adsorption isotherms at different solids concentrations
(a) at pH 3, (b) at pH 7, (c) at pH 10.
Operation Conditions: Goethite concentration = 0.5 g/l, 1 g/l,
Temperature = 22 ºC, Ionic strength = 0.001 M NaNO3,
Equilibration time = 24 hours, Surface coverage method used = loss
from solution method.
54
Figure 4.8
Phosphate adsorption isotherms at low phosphate concentrations.
57
(a) at 1 hour, (b) at 24 hours, (c) at 72 hours, (d) 168 hours.
Operation Conditions: Goethite concentration = 10 g/l, 1 g/l, 0.1 g/l
and 0.01 g/l, Temperature = 22ºC, Ionic strength = 0.001 M
NaNO3, pH = 4, Surface coverage method used = loss from solution
method (10 g/l, 1 g/l), acid digestion method (0.1 g/l and 0.01 g/l).
xii
List of Figures
Figure 4.9a
Phosphate adsorption isotherms at high phosphate concentrations.
60
Operation Conditions: Goethite concentration = 10 g/l, 1 g/l, 0.1 g/l
and 0.01 g/l, Temperature = 22ºC, Ionic strength = 0.001 M
NaNO3, pH = 4, Surface coverage method used = loss from solution
method (10 g/l, 1 g/l), acid digestion method (0.1 g/l and 0.01 g/l).
Figure 4.9b
Phosphate adsorption isotherms at high phosphate concentrations at
24 hour reaction.
61
Figure 4.9c
Phosphate adsorption isotherms at high phosphate concentrations
at 72 hour reaction.
61
Figure 4.9d
Phosphate adsorption isotherms at high phosphate concentrations
at 168 hour reaction.
62
Figure 4.9e
Phosphate adsorption isotherms at high phosphate concentrations
at 720 hour reaction.
62
Figure 4.10
Phosphate adsorption kinetics. Goethite concentration =10 g/l,
pH = 4, NaNO3 = 0.001 M. Legend “50 µM” means initial
phosphate concentration before reaction, and so on.
63
Figure 4.11
Phosphate adsorption kinetics. Goethite concentration =1.0 g/l,
pH = 4, NaNO3 = 0.001 M. Legend “40 µM” means initial
phosphate concentration and so on.
64
Figure 4.12
Phosphate adsorption kinetics. Goethite concentration = 0.10 g/l,
pH = 4, NaNO3 = 0.001 M. Legend “2.16 µM” means
initial phosphate concentration and so on.
65
Figure 4.13
Phosphate adsorption kinetics. Goethite concentration = 0.01 g/l 66
pH= 4, NaNO3 = 0.001 M. Legend “1 µM” means
initial phosphate concentration before reaction, and so on.
Figure 4.14
The relationship between Elovich slope and mean adsorbed
phosphate.
70
xiii
List of Tables
LIST OF TABLES
Table 2.1
Surface Complex Formation Reaction Equilibria
9
Table 4.1
Comparison of Surface Coverage Measurement by Two
Methods
44
Table 4.2
Comparison of Surface Coverage Measurement by Two
Methods
45
Table 4.3
Surface Coverage at which Transition from Elovich to P Limited
Kinetics Occurs (P< 0.5 µmol/l) after 1 hour.
67
Table 4.4
Comparison of Elovich Slope at Different Solid Concentration
69
Table A.1
Experimental Data for Acid Digestion Method
Goethite Concentration = 1 g/l
88
Table A.2
Experimental Data for Acid Digestion Method
Goethite Concentration = 0.1 g/l
89
Table A.3
Experimental Data for PO4 Desorption in 6 M NaOH Solution
90
Table A.4
Experimental Data for PO4 Desorption in 1 M NaOH Solution
91
Table A.5
Experimental Data for PO4 Desorption in 0.01 M NaOH
Solution
92
Table A.6
Experimental Data for PO4 Desorption in 6 M HNO3 Solution
93
xiv
List of Tables
Table A.7
Experimental Data for PO4 Desorption in 1 M HNO3 Solution
94
Table A.8
Experimental Data for PO4 Desorption in 0.01 M HNO3 Solution
95
Table B.1
Experimental Data for Phosphate Adsorption Isotherm at pH 3, 1
g/l Goethite Concentration and 0.001 M NaNO3
96
Table B.2
Experimental Data for Phosphate Adsorption Isotherm at pH 7, 1
g/l Goethite Concentration and 0.001 M NaNO3
97
Table B.3
Experimental Data for Phosphate Adsorption Isotherm at pH 10,
1 g/l Goethite Concentration and 0.001 M NaNO3
98
Table B.4
Experimental Data for Phosphate Adsorption Isotherm at pH 3,
0.5 g/l Goethite Concentration and 0.001 M NaNO3
99
Table B.5
Experimental Data for Phosphate Adsorption Isotherm at pH 7,
0.5 g/l Goethite Concentration and 0.001 M NaNO3
100
Table B.6
Experimental Data for Phosphate Adsorption Isotherm at pH 10,
0.5 g/l Goethite Concentration and 0.001 M NaNO3
101
Table B.7
Experimental Data for Arsenate Adsorption Isotherm at pH 3, 1
g/l Goethite Concentration and 0.001 M NaNO3
102
Table B.8
Experimental Data for Arsenate Adsorption Isotherm at pH 7, 1
g/l Goethite Concentration and 0.001 M NaNO3
103
Table B.9
Experimental Data for Arsenate Adsorption Isotherm at pH 10, 1
g/l Goethite Concentration and 0.001 M NaNO3
104
Table B.10
Experimental Data for Arsenate Adsorption Isotherm at pH 3,
0.5 g/l Goethite Concentration and 0.001 M NaNO3
105
xv
List of Tables
Table B.11
Experimental Data for Arsenate Adsorption Isotherm at pH 7,
0.5 g/l Goethite Concentration and 0.001 M NaNO3
106
Table B.12
Experimental Data for Arsenate Adsorption Isotherm at pH 10,
0.5 g/l Goethite Concentration and 0.001 M NaNO3
107
Table C.1
Experimental Data for Phosphate Adsorption Isotherm at 10 g/l
Goethite Concentration. pH = 4, Reaction time = 1hour, Ionic
Strength = 0.001 M NaNO3.
109
Table C.2
Experimental Data for Phosphate Adsorption Isotherm at 10 g/l
Goethite Concentration. pH = 4, Reaction time = 24 hours, Ionic
Strength = 0.001 M NaNO3.
110
Table C.3
Experimental Data for Phosphate Adsorption Isotherm at 10 g/l
Goethite Concentration. PH = 4, Reaction time = 72hour, Ionic
Strength = 0.001 M NaNO3.
111
Table C.4
Experimental Data for Phosphate Adsorption Isotherm at 10 g/l
Goethite Concentration. pH = 4, Reaction time = 168 hours,
Ionic Strength = 0.001 M NaNO3.
112
Table C.5
Experimental Data for Phosphate Adsorption Isotherm at 1 g/l
Goethite Concentration, pH = 4, Reaction time = 1 hour, Ionic
Strength = 0.001 M NaNO3.
113
Table C.6
Experimental Data for Phosphate Adsorption Isotherm at 1 g/l
Goethite Concentration, pH = 4, Reaction time = 24 hours, Ionic
Strength = 0.001 M NaNO3
114
Table C.7
Experimental Data for Phosphate Adsorption Isotherm at 1 g/l
Goethite Concentration, pH = 4, Reaction time = 48 hours, Ionic
Strength = 0.001 M NaNO3.
115
xvi
List of Tables
Table C.8
Experimental Data for Phosphate Adsorption Isotherm at 1 g/l
Goethite Concentration, pH = 4, Reaction time = 72 hours, Ionic
Strength = 0.001 M NaNO3.
116
Table C.9
Experimental Data for Phosphate Adsorption Isotherm at 1 g/l
Goethite Concentration, pH = 4, Reaction time = 96 hours, Ionic
Strength = 0.001 M NaNO3.
117
Table C.10
Experimental Data for Phosphate Adsorption Isotherm at 1 g/l
Goethite Concentration, pH = 4, Reaction time = 168 hours,
Ionic Strength = 0.001 M NaNO3
118
Table C.11
Experimental Data for Phosphate Adsorption Isotherm at 1 g/l
Goethite Concentration, pH = 4, Reaction time = 720 hours,
Ionic Strength = 0.001 M NaNO3
118
Table C.12
Experimental Data for Phosphate Adsorption Isotherm at 0.1 g/l
Goethite Concentration, pH = 4, Reaction time = 1 hour, Ionic
Strength = 0.001 M NaNO3
119
Table C.13
Experimental Data for Phosphate Adsorption Isotherm at 0.1 g/l
Goethite Concentration, pH = 4, Reaction time = 24 hours, Ionic
Strength = 0.001 M NaNO3
120
Table C.14
Experimental Data for Phosphate Adsorption Isotherm at 0.1 g/l
Goethite Concentration, pH = 4, Reaction time = 72 hours, Ionic
Strength = 0.001 M NaNO3
121
Table C.15
Experimental Data for Phosphate Adsorption Isotherm at 0.1 g/l
Goethite Concentration, pH = 4, Reaction time = 96 hours, Ionic
Strength = 0.001 M NaNO3
122
Table C.16
Experimental Data for Phosphate Adsorption Isotherm at 0.1 g/l
Goethite Concentration, pH = 4, Reaction time = 168 hours,
Ionic Strength = 0.001 M NaNO3
123
xvii
List of Tables
Table C.17
Experimental Data for Phosphate Adsorption Isotherm at 0.1 g/l
Goethite Concentration, pH = 4, Reaction time = 720 hours,
Ionic Strength = 0.001 M NaNO3
124
Table C.18
Experimental Data for Phosphate Adsorption Isotherm at 0.01
g/l Goethite Concentration, pH = 4, Reaction time = 1 hour,
Ionic Strength = 0.001 M NaNO3
125
Table C.19
Experimental Data for Phosphate Adsorption Isotherm at 0.01
g/l Goethite Concentration, pH = 4, Reaction time = 24 hours,
Ionic Strength = 0.001 M NaNO3
126
Table C.20
Experimental Data for Phosphate Adsorption Isotherm at 0.01
g/l Goethite Concentration, pH = 4, Reaction time = 72 hours,
Ionic Strength = 0.001 M NaNO3
127
Table C.21
Experimental Data for Phosphate Adsorption Isotherm at 0.01
g/l Goethite Concentration, pH = 4, Reaction time = 168 hours,
Ionic Strength = 0.001 M NaNO3
128
Table C.22
Experimental Data for Phosphate Adsorption Isotherm at 0.01
g/l Goethite Concentration, pH = 4, Reaction time = 720 hours,
Ionic Strength = 0.001 M NaNO3
129
xviii
Chapter 1
Introduction
CHAPTER 1 INTRODUCTION
1.1 General Introduction
Goethite (α-FeOOH) is one of the most widespread iron oxides in natural systems and can
be readily synthesized in the laboratory. Many forms of iron oxide are found in natural
soil and sediment, such as hematite, ferrihydrite, lepidocrocite, alkaganeite, and goethite.
Among these metal oxides, goethite is one of the most common and is widely used in ion
sorption studies because of its high crystallinity and thermodynamic stability at ambient
temperature.
Phosphate and arsenate are both group V elements and thus have similar chemical
properties. Phosphorous is a common element and is an important plant nutrient, often
being the bio-limiting nutrient in fresh water and the ocean (Krom and Berner, 1981). On
the other hand, arsenic is very toxic and a health risk for humans when exposed to
contaminated drinking water (Lepkowski, 1998). Both phosphorus and arsenic are
released to aquatic environments through weathering of rocks or by various human
activities including mining, ore processing, and industrial and agricultural use (Pierce and
Moore, 1982).
Adsorption plays a major role in controlling the dissolved concentration and hence
mobility of phosphate and arsenate in the environment. To facilitate describing the
distribution of the anions between solution and metal oxide surfaces, adsorption models
have been developed. Experimental sorption data can generally be described by the
traditional Langmuir and Freundlich adsorption isotherms, however, these do not provide
1
Chapter 1
Introduction
information of the adsorption mechanism or the speciation of surface complex (Cornell
and Schwertmann, 2003). The surface complexation model (SCM) has been developed
over the past several decades to describe the reaction between the ions and the surface,
including the electrostatic interaction between the charged surface and ions (Dzombak and
Morel, 1990).
However, some results are inconsistent with the SCM. The SCM is based on mono-layer
surface coverage and equilibrium conditions. The SCM is limited in its ability to explain
some experimental results, including observed reaction kinetics, lack of adsorption
maxima, competitive adsorption and solid-solution ratio effects. The kinetics of
phosphate adsorption on hydrous metal oxide has two phases reaction; initially the
reaction is very rapid, followed by a continuous slow reaction occurring from days to
weeks with no equilibrium observed at the end of the experiment (Chen, 1973a; Stanforth,
1981; Hingston, 1981). Some studies have shown that phosphate adsorption never
reaches an adsorption maxima (Anderson et al., 1981). The adsorption increases with
decreasing solids concentration (Li, 1998; Ler, 2000; Jaio, 2003). Increasing the solution
concentration (phosphate) or decreasing the solids concentration (goethite) influences the
adsorption maxima (Li, 1998; Ler, 2000). The solid-solution ratio effect plays an
important role in ion sorption studies.
In the SCM, the solid to solution ratio should have no effect on the adsorption isotherm
since the reaction between the anion and goethite involves a surface complex formation
only. However, studies have shown that the solid solution ratio significantly influences
on sorption. One suggestion that to account for the effect is that a precipitation reaction
may occur at the oxide surface (Li, 1998; Ler, 2000; and Jaio, 2003). Although some
2
Chapter 1
Introduction
studies observed the solid solution ratio effect on adsorption isotherm, the explanation of
this effect on sorption isotherm is still unclear. In this study, an investigation of the solid
solution ratio effect on adsorption isotherm as well as solid solution ratio effect on
reaction kinetics will be investigated.
1.2 Objectives and Scope
The major objective of this study is to study the effect of solid to solution ratio on
adsorption isotherms and kinetics. This study will provide a better understanding of anion
adsorption mechanism as well as solid solution ratio effect on goethite. The scope of this
study involves:
1) The effect of pH on anion adsorption (phosphate and arsenate) on goethite. In this
portion of the study, two different solids concentration were used to obtain more
reliable and accurate results.
2) The effect of solid to solution ratio on adsorption isotherm, including:
(a) The effect on adsorption isotherm at two solid concentrations and various pH
values as an initial study, and
(b) The effect of changing solids concentrations by a factor of 1000 at pH 4.
3) The effect of solids concentrations on reaction kinetics.
3
Chapter 2
Literature Review
CHAPTER 2 LITERATURE REVIEW
2.1 Goethite and Its Morphology
2.1.1 Goethite
Iron oxides are widespread in natural environment systems. Sixteen forms of iron oxides
were observed in the natural environment (Cornell and Schwertmann, 2003), with goethite
(α-FeOOH) one of the most common forms. It is occurs in nature as a component of soil
and is thermodynamically stable at ambient temperature. Because of its high crystallinity,
ease of formation, and stability, it has been used as adsorbent in ion adsorption
experiment. Natural goethite occurs in rock and soils. Goethite is dark or brown colored
in massive crystal aggregates and yellow colored in powder form. Synthetic goethite can
be prepared in the laboratory with a needle-like (acicular) structure and surface areas
ranging from 8 - 200 m2/g (Cornell and Schwertmann, 2003).
2.1.2 Surface Morphology
The basic morphology of goethite crystal is acicular over the range of crystal sizes. The
length of the acicular goethite ranges from a few tens of nm to several microns. The
larger crystals usually consist of aggregates of smaller crystals. Synthetic acicular
goethite crystals are elongated in the 100 direction and terminate on the 210 face. This
4
Chapter 2
Literature Review
morphology has a double chain of the corner shared iron octahedral running parallel to the
[010] direction and dominating the crystal structure (Cornell and Schwertmann, 2003).
In general, the crystal form of goethite corresponds to a group of faces that intersect all
the crystal axes. The chemical reactivity of interface is determined by the type and
number of surface hydroxyl groups present. Metal oxides and hydroxides have different
types of surface oxygen according to the coordination number of the metal ions in the
solid. The chemical binding and reactive characteristic of the oxygens on the solid
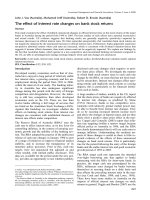
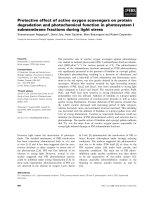
surface depend on the coordination number of the surface group. There are three types of
surface oxygens on goethite: singly coordinated A-type hydroxyl group, triply
coordinated B-type hydroxyl groups and doubly coordinated C-type hydroxyl groups as
shown in Figure 2.1 (Sun and Doner, 1996).
Figure 2.1 Surface groups and structure of goethite (Sun and Doner, 1996)
5