Fabrication and characterization of photonic crystals
Bạn đang xem bản rút gọn của tài liệu. Xem và tải ngay bản đầy đủ của tài liệu tại đây (3.13 MB, 92 trang )
FABRICATION AND CHARACTERIZATION OF PHOTONIC
CRYSTALS
WANG YANHUA
NATIONAL UNIVERSITY OF SINGAPORE
2005
FABRICATION AND CHARACTERIZATION OF PHOTONIC
CRYSTALS
WANG YANHUA
(B. Sc., JILIN UNIVERSITY)
A THESIS SUBMITTED
FOR THE DEGREE OF MASTER OF SCIENCE
DEPARTMENT OF PHYSICS
NATIONAL UNIVERSITY OF SINGAPORE
2005
Acknowledgements
First and foremost, I thank my supervisor, A/Prof. Liu Xiang Yang and co-supervisor,
A/Prof. Ji Wei, and Dr. Zhang Keqin for their invaluable guidance and advice throughout
my entire candidature in the Department of Physics, National University of Singapore.
I also thank all my group members and friends, Teo Hoon Hwee, Chung Chee Cheong
Eric,
Dr.
Janaky
Narayanan,
Dr.
Strom-Solomonidou,
Christina,
Dr.
Claire
Lesieur-Chungkham, Dr. Jiang Huaidong, Dr. Li Jingliang, Dr. Wang Rongyao, Dr. Du
Ning, Zhang Jing, Jia Yanwei, Xiong Junying, Zhou Kun, Li Huiping, Zhang Tianhui, Liu
Yu, Liu Junfeng, Lim Fung Chye Perry, Pan Hui, Zhang Jie, Liu Yan, Dr. Hendry Izaac
Elim, Qu Yingli, Dr. Yu Mingbin (IME) and Dr. Akhmad Herman Yuwono (Material
Science), for their cooperation, valuable discussion and help.
Particularly, I should thank my husband, Zheng Yuebing, for his everlasting support and
love.
Last but not least, I thank my parents for their support, tolerance, and love.
i
Table of Contents
Acknowledgements…………………………………………………………………....i
Table of Contents…………………………………………………………………….ii
Summary……………………………………………………………………………..iv
List of Tables………………………………………………………………………..vii
List of Figures………………………………………………………………………viii
1.
Introduction
1.1
Research Background …………………………………………………1
1.1.1
Introduction of Photonic Crystals
1.1.2
Optical Properties of Photonic Crystals
1.1.3
Optical Characterization
1.1.4
Fabrication of Photonic Crystals
1.2
Objectives…………………………………………………………….19
1.3
Organization of the Thesis…………………………………………...20
References
2.
Crystalline Arrays of Colloidal Spheres as Three-Dimensional Photonic
Crystals
2.1
Introduction…………………………………………………………...27
2.2
Fabrication of Colloidal Crystals ………………………….................29
2.3
2.2.1
Fabrication of Colloidal Crystals by Sedimentation
2.2.2
Fabrication of Colloidal Crystals by Vertical Deposition
Optical Characterization of Colloidal Crystals……………………….36
References
3.
Effects of Surfactant on Structure of Colloidal Crystals
3.1
Introduction ………..............................................................................43
3.1.1
Research Backgroud
ii
3.1.2
Introduction of Surfactant
3.2
Preparation and Characterization of Colloidal Crystals….…………..46
3.3
Results and Discussion……………………………………………….47
3.4
Conclusions…………………………………………………………51
References
4.
Effects of Pre-heating Treatment on Photonic Bandgap Properties of Silica
Colloidal Crystals
4.1
Introduction ……………......................................................................54
4.2
Experiments…………………………………………………………..55
4.3
Results and Discussion……………………………………………….56
4.4
Conclusions .………………………………………………………….61
References
5.
Fabrication and Characterization of Surfactant-Assisted TiO2 Photonic
Crystals
5.1
Introduction…………………………………………………………...63
5.2
Experiments…………………………………………………………..66
5.3
Results and Discussion……………………………………………….68
5.4
Conclusions .………………………………………………………….72
References
6.
Conclusions……………………………………………………………………75
7.
Appendices…………………………………………………………………….80
iii
Summary
Photonic bandgap (PBG) crystals have attracted great attention because of their
potential applications in confining and controlling electromagnetic waves in all three
directions of space. Three-dimensional colloidal crystals formed from monodisperse
particles possess photonic stop bandgaps. One of the promising methods of
fabricating photonic crystals with complete photonic bandgaps is to fill the voids in
three-dimensional colloidal crystals with materials possessing high refractive index
followed by the removal of the original colloidal crystals.
Although the photonic crystals fabricated from the colloids are studied intensively
recently, some bottlenecks exist, for example, defects, disorders and cracks formed
invariably in the crystals. Investigations related to the array fashion of the particles
and studies on the control of the photonic properties of colloidal crystals are very
limited. In our project, we obtained photonic crystals with limited cracks by
optimizing fabrication conditions. The effect of surfactants on the array fashion of the
particles was investigated systematically, which give a feasible way to improve the
fabrication of photonic crystals with controlled crystallography orientations.
Furthermore, a novel method is explored to achieve the fine tuning of the photonic
crystals. Using colloidal crystal templating, TiO2 photonic crystals were produced and
characterized.
iv
Firstly, the colloidal crystals were fabricated from polystyrene and silica colloidal
particles by sedimentation and vertical deposition. The crystals having structure of
face centered cubic (fcc) lattice resulted from evaporation-induced interfacial
self-assembly crystallization. Through optimizing the fabrication conditions in terms
of crystallizing temperature and the concentration of the colloids, the defects,
disorders and cracks in the colloidal crystals are greatly reduced and the typical size
of a single crystalline domain is larger than 200µm. Their reflectance spectra
measured with UV-Vis spectrometer show that they possess photonic stop bandgaps.
Secondly, the effect of surfactants on the structures of polystyrene colloidal crystals
was investigated by fabricating colloidal crystals in the presence of different
surfactants with different concentrations by sedimentation. The addition of surfactants
affected the array fashion and was favorable to form a square array.
Thirdly, the effect of pre-heating treatment on the photonic bandgap properties of
silica colloidal crystals was also explored by heating silica colloids as dry powders at
elevated temperatures prior to assembly of colloidal crystals. The reflectance spectra
of the resulting crystals showed that the central stop bandgap position of the crystals
assembled from heat-treated silica particles first blue shifted and then red shifted with
the increasing pre-heating temperature as compared to that of the crystal assembled
form original silica particles.
v
Finally, we fabricated the ordered array of air spheres in titania using colloidal crystal
templating method, yielding photonic crystals with a high contrast of the refractive
index. Micro-FTIR transmission spectroscopy confirmed the presence of stop
bandgaps in them. Additionally, a surfactant, SDS, was added into the infiltration
material and the SEM results showed that the addition of SDS might lead to tight
coating of TiO2 on the polystyrene microspheres.
vi
List of Tables
Table 3.1 Surfactants with different concentrations in PS colloids for fabricating
colloidal crystals……………………………………………………………………...47
vii
List of Figures
Figure 1.1 Schematic illustrations of photonic crystals (a) one-dimensional (1D) (b)
two-dimensional (2D) (c) three-dimensional (3D)…………………………………….2
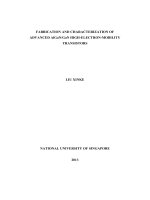
Figure 1.2 Band structure of an ‘inverse’ fcc lattice of spheres of refractive index 1 in
a background with index 3 calculated with the KKR method. The horizontal gray
band outlines the complete band gap………………………………………………….7
Figure 2.1 Schematic illustration of sedimentation………………………………….30
Figure 2.2 SEM images of a colloidal crystal of 300nm polystyrene beads: a) view in
a large area; b) oblique view along a crack; c) view in large magnification; d) square
array observed in the colloidal crystal………………………………………………..32
Figure 2.3 a, b) SEM images of colloidal crystal of 0.97µm silica spheres in large and
small magnification; c, d) SEM images of colloidal crystal of 0.33µm silica spheres in
large and small magnification………………………………………………………..33
Figure 2.4 Schematic illustration of vertical deposition……………………………..34
Figure 2.5 SEM images of a colloidal crystal of 0.33µm silica spheres using vertical
deposition: a) view in small magnification; b) view in large magnification…………35
Figure 2.6 UV-Vis reflectance and transmission spectra of a colloidal crystal
assembled from 300nm polystyrene beads with the incident light normal to the
substrate………………………………………………………………………………36
Figure 2.7 UV-Vis reflectance spectra of a colloidal crystal of 0.33µm silica spheres
with the incident light normal to the substrate…………………………………….....38
Figure 3.1 Schematic illustration of micelle formation in aqueous solution and
surface tension as a function of surfactant concentration…………………………….46
viii
Figure 3.2 SEM images of colloidal crystals formed in the presence of surfactants a)
SDS, conc. = 3.07 mg/ml; b) GAELE, conc. = 0.07 mg/ml; c) GAELE, conc. = 0.13
mg/ml; d) GAELE, conc. = 0.21 mg/ml……………………………………………..49
Figure 3.3 SEM images of colloidal crystals formed in the presence of CTAB. a)
conc. = 0.17 mg/ml; b) conc. = 0.70 mg/ml…………………………………………49
Figure 3.4 SEM images of colloidal crystals with addition of Tween 80. a) conc. =
0.00625 mg/ml; b) conc. = 0.0125 mg/ml; c) conc. = 0. 021 mg/ml; d) conc. = 0.122
mg/ml………………………………………………………………………………...50
Figure 4.1 (a) SEM image of colloidal crystal made from original silica particles; the
size of the particles is 290 nm; (b) SEM image of colloidal crystals assembled from
heat-treated silica particles. The particles were heated at 6500C for 2 hours prior to
assembly of the opal. The size of the particles is 272 nm……………………………57
Figure 4.2 A plot of silica particle size versus the pre-heating temperature………...58
Figure 4.3 Reflectance spectra of silica colloidal crystals from original and
heat-treated silica spheres…………………………………………………………….59
Figure 4.4 A plot of the mid-gap position versus the preheating temperature………61
Figure 5.1 Schematic illustration of colloidal crystal templating……………………66
Figure 5.2 SEM images of a PS colloidal crystal. (a) Oblique view along a crack; (b)
hexagonal array observed in the colloidal crystal……………………………………68
Figure 5.3 SEM images of a TiO2 photonic crystal. (a) Oblique view; (b) view in
large magnification; (c) view in small magnification; (d) cracks in the crystal. Its
template was assembled form PS particles with a diameter of 300nm………………69
Figure 5.4 SEM images of a TiO2 photonic crystal produced using the mixture of
ix
TPT and SDS solution as the infiltration material. a) View in large magnification; b)
view in small magnification. Its template was assembled form PS particles with a
diameter of 300nm…………………………………………………………………...70
Figure 5.5 Micro-FTIR transmission (a) and (b) reflectance spectra of a TiO2 inverse
opal. The template of the inverse opal was assembled form PS particles with a
diameter of 0.99µm…………………………………………………………………..71
x
Chapter 1 Introduction
1.1 Research Background
1.1.1 Introduction of Photonic Crystals
Photonic crystals are regular arrays of materials with different refractive indices, which
would not permit the propagation of electromagnetic waves in a range of frequencies
called the photonic band gap. 1 Figure 1.1 shows the simplest case in which two materials
are stacked alternately. The spatial period of the stack is known as the lattice constant,
since it corresponds to the lattice of ordinary crystals composed of a regular array of
atoms. However, one big difference between them is the scale of the lattice constant. In
the case of ordinary crystals, the lattice constant is on the order of angstroms. On the
other hand, it is on the order of wavelength of the relevant electromagnetic waves for the
photonic crystals. For example, it is about 1 µm or less for visible light, and is about 1
mm for microwaves.
Photonic crystals are classified mainly into three categories, that is, one-dimensional (1D),
two-dimensional (2D), and three-dimensional (3D) crystals according to the
dimensionality of the stack (see Fig. 1.1). The photonic crystals that work in the
microwave and far-infrared regions are relatively easy to fabricate. Those that work in the
visible region, especially 3D ones are difficult to fabricate because of their small lattice
constants (submicron scale).
2
The first photonic crystal was made by Yablonovitch by
1
drilling three sets of cylindrical holes in a block of dielectric materials in a periodic
arrangement. 3 The periodicity was on the order of a millimeter so that the photonic band
gap appeared at microwave frequencies.
(a) 1 D
(b) 2 D
(c) 3 D
Figure 1.1. Schematic illustrations of photonic crystals (a) one-dimensional (1D) (b)
two-dimensional (2D) (c) three-dimensional (3D)
Photonic crystals can offer us one solution to the problem of optical control and
manipulation. If the dielectric constants of the materials in the crystals are different
enough, and the absorption of light by the material is minimal, then the scattering at the
interfaces can produce many of the same phenomena for photons (light mode) as the
atomic potential does for electrons. Light would remain trapped at defect sites if it is
forbidden to propagate through the crystals. Such a defect can be shaped in the form of a
tiny cavity or a sharply-curved waveguide, allowing one to manipulate light in ways that
have not been possible before. Thus, photonic crystals have been proposed for a large
number of applications such as efficient microwave antennas, zero-threshold lasers,
low-loss resonators, optical switches, and miniature optoelectronic components such as
2
microlasers and waveguides. The most useful applications would occur at near-infrared
or visible wavelengths. This makes it necessary to fabricate photonic crystals with feature
sizes of less than a micrometer. Furthermore, the refractive index contrast of the crystal
must exceed 2 or 3, depending on the lattice, placing restrictions on the materials used.
A number of different methods have been used for the fabrication of photonic crystals.
Many of these apply a variety of lithographic techniques used in the semiconductor
industry for patterning substrates such as silicon. Two-dimensional photonic crystals have
been made this way, which operate at wavelengths down to the visible light.
4
Good
control over the introduction of defects has also been demonstrated. A number of attempts
have been made to create three-dimensional photonic crystals using these techniques.
5-7
However, it has so far proved too difficult to achieve submicron periodicities of much
more than one unit cell thickness.
On the other hand, colloidal particles naturally possess the desired sizes and can form
periodic structures spontaneously. Moreover, the optical properties of the individual
spheres can easily be tuned, or they can be used as templates to make inverted structures.
Colloidal self-assembly has therefore been proposed as an easy and inexpensive way to
fabricate three-dimensional photonic crystals, and as a suitable system in which to
8, 9
investigate their optical properties.
Until this realization colloidal crystals had been
prepared with only a modest refractive index contrast, in order for them to remain
3
relatively transparent and not opaque due to multiple scattering. They can thus be said to
reject light propagating in certain directions, which satisfy the Bragg condition:
2d sin θ = mλ .
(1.1)
Here, λ is the wavelength of the incident light on the crystal, d is the lattice spacing, θ is
the angle between the incident ray and the lattice planes, and the integer m is the order of
the diffraction. If the dielectric contrast between the spheres and the suspending medium
is larger, the range of angles for which waves of a given frequency diffracts increases due
to multiple scattering. At sufficiently high contrast and for certain crystal types
propagation should become impossible in all directions and for both polarizations.
1.1.2 Optical Properties of Photonic Crystals
Propagation of electromagnetic waves in periodic media displays many interesting and
useful effects. Shining a light through a large block of glass with a single bubble of air in
it, some of it will reflect and some of it will continue forward at a slightly different angle
(be refracted). This scattered light allows eyes to see the bubble, perhaps with an
attractive sparkling caused by all of the reflections and refractions. Picture now a second
bubble in the glass, just like the first but at a different place. As before, the light will
reflect and refract, this time from both bubbles, sparkling in a more intricate pattern than
before. All of these is exactly predicted by Maxwell’s equations.
10
For time-varying
fields, the differential form of these equations in cgs units is:
4
v
v v
1 ∂H
,
∇× E = −
c ∂t
(1.2)
v
v v 4π
1 ∂εE
,
∇× H =
J+
c
c ∂t
(1.3)
v v
∇ ⋅ εΕ = 4πρ ,
(1.4)
v v
∇⋅H = 0,
(1.5)
v
v
Where E and H are the electric and magnetic fields, J is the free current density,
ρ is the free charge density, ε is dielectric constant and c is the speed of light in
vacuum.
After a little manipulation, Maxwell’s Equations can be reduced to a wave equation of
the form:
v 1 v v ⎛ ω ⎞2 v
∇× ∇× H = ⎜ ⎟ H
ε
⎝c⎠
(1.6)
v
This is an eigenproblem for H , where ω is angular frequency of the wave. It can be
v
shown that the operator acting on the H field is Hermitian, and, as a consequence, its
eigenvalues are real and positive.
The Bloch-Floquet Theorem tells us that, for a Hermitian eigenproblem whose operators
5
are periodic functions of position, the solution can always be chosen of the form
v v
v
v v
v
e ik ⋅x ⋅ (periodic function). A periodic function f ( x ) is one such that f (x + Ri ) = f ( x )
v
v
for any x and any primitive lattice vector Ri of the crystal.
From the Bloch-Floquet Theorem, the solution of Eq. (1.6) for a periodic ε can be
chosen of the form:
vv
v
v
H = e i (k ⋅ x −ωt ) H kv ,
(1.7)
v
Where H kv is a periodic function of position and satisfies the “reduced” Hermitian
eigenproblem:
2
v v 1 v v v
⎛ω ⎞ v v
v
∇ + ik × ∇ + ik × H k = ⎜ ⎟ H k .
ε
⎝c⎠
(
) (
)
(1.8)
v
Because H kv is periodic, this eigenproblem is needed only considered over a finite
domain: the unit cell of the periodicity. Eigenproblems with a finite domain have a
discrete set of eigenvalues, so the eigenfrequencies ω are a countable sequence of
()
v
continuous functions: ω n k (for n = 1, 2, 3 …). When they are plotted as a function of
v
the wavevector k , these frequency “bands” form the band structure of the crystal.
6
Figure 1.2 shows band structure of an ‘inverse’ face-centered cubic lattice of spheres
consisting of air in a background material of refractive index 3. The frequencies of the
allowed modes are plotted versus wave vectors in the Brillouin zone of the f.c.c. lattice of
Figure 1.2. Band structure of an ‘inverse’ fcc lattice of spheres of refractive index 1 in a
11
background with index 3 calculated with the KKR method. The horizontal gray band
outlines the complete band gap.
spheres. The allowed modes form the photonic band structure of this crystal. There is a
narrow band gap at a frequency of ν = 2.8c / πA , where c is the speed of light and A the
size of the cubic unit cell. The ‘inverted’ crystal structure is shown here because the
‘direct’ structure, i.e. spheres of high refractive index in air, does not possess a band gap.
7
If the refractive index contrast (the ratio of the refractive index of the spheres and their
background) is increased the band gap widens. Below a contrast of 2.85 the gap is
closed.11 The band gap in Figure 1.2 is located between the 8th and 9th bands. This
corresponds to the region where, in weakly scattering crystals, the second order Bragg
diffraction is located. The first order Bragg diffraction occurs at a lower frequency,
around ν = 1.7c / πA for the direction corresponding to the L point. At this point the
waves travel perpendicularly to the (111) planes of the crystal. There is a sizeable range
of frequencies for which these waves cannot propagate through the crystal and thus are
reflected. This frequency range is called a stop bandgap. Since propagation is still
possible in other directions one usually speaks of a partial or incomplete band gap. If the
direction is moved away from the L or X points the bands are seen to split in two. These
are the different polarization states which are then no longer degenerate. There is a close
analogy with electron waves traveling in the periodic potential of atomic crystals, where,
too, the allowed modes are arranged into energy bands separated by energy gaps.
1.1.3 Optical Characterization
Optical measurements are the main technique for the characterization of photonic band
gap materials. While optical reflectance and transmission are the principle tools used to
characterize 3D systems. An infinitely large, perfect photonic crystal would reflect 100%
of the incident light at wavelengths in the band gap and would transmit 100% of the light
8
at other wavelengths. At any given angle of incidence there will be such gaps. In the case
of a complete band gap the reflected wavelength bands would overlap at every incident
angle. However, a number of experimental complications arise in practice. First of all,
real photonic crystals are neither perfect nor infinite. This problem is made worse by a
certain degree of disorder or the presence of defects, which cause the dip in the
transmission to broaden and its edges to become less well defined. Another related
problem is polycrystallinity of the sample, which often occurs in self-assembled crystals.
This will result in a large broadening of the transmitted and reflected bands, because
changing the wavelength will successively probe different crystallites with different
orientations. In all these cases, simply taking the full width at half maximum is therefore
not necessarily the best way to proceed.
Trying to observe a single crystal with as few defects as possible should be able to
minimize these difficulties. Polycrystallinity is not normally a problem in crystals made
with lithographic techniques, but may be a limitation in self-assembled crystals. It has
been shown that gap widths extracted from reflection spectra are much more reliable than
those obtained from transmission spectra, because reflected light probes only a small
number of lattice planes lying close to the surface12 (thus containing fewer domains with
limited defects). One should therefore reduce the probe beam to a size smaller than a
single crystalline domain. Reducing the beam size even further to much less than the
9
domain size will further reduce the influence of defects and surface roughness. This was
beautifully demonstrated in reflection and luminescence spectra measured with the use of
an optical microscope.13 Alternatively, polycrystallinity can be avoided by growing large
single crystals, which are not too thick, so that transmission spectra also produce accurate
gap widths.14, 15
1.1.4 Fabrication of Photonic Crystals
Numerical calculations have led to the identification of a number of three-dimensional
crystal structures that should have a complete photonic band gap. Fabrication of these
structures on a submicrometer length scale is still a challenge, especially because
materials with a sufficiently high refractive index and negligible absorption have to be
used. Suitable materials are often semiconductors such as TiO2, Si, or GaAs. The
structures must also have a very high porosity, typically containing ~80% air. A number
of strategies have been developed; generally, they are nanofabrication, self-assembly
methods, colloidal crystal templating and directed self-assembly methods.
1.1.4.1 Nanofabrication
Nanofabrication techniques use lithography and etching, or holography. Modern
semiconductor processing techniques have so far had relatively limited success in making
10
three-dimensional structures as compared to their success in the fabrication of
two-dimensional photonic crystals. A promising approach is the layer-by-layer
preparation of the so-called woodpile structure, which is known to have a complete band
16, 17
gap.
An alternative method is the use of chemically assisted ion beam etching to drill narrow
18, 19
channels into a GaAs or GaAsP wafer
in a manner similar to that used by
Yablonovitch, but on a much smaller length scale. Photo-assisted electrochemical etching
of pre-patterned silicon has been used to produce a two-dimensional array of very deep
(~100 µm) cylindrical holes.20 By modulating the light intensity with time it is possible to
induce a periodicity of up to 25 periods in the vertical direction.21 So far, this periodicity
is relatively large as compared to that in the horizontal directions, so that the structure
does not yet possess a complete photonic band gap.
The last method mentioned here is three-dimensionally periodic patterns of light created
by interfering up to four laser beams,22, 23 similar to holographic recording. The pattern is
recorded in a film of photoresist. Unpolymerized resin is then removed by washing. The
method is suitable for quickly producing large-area crystals with any desired structure, as
long as the polymerized regions are interconnected. Absorption of the light by the
photoresin limits the maximum thickness of the crystals to several tens of micrometers,
11
corresponding to several tens of lattice planes. Since photoresists have a relatively low
refractive index, additional steps must be used to increase the dielectric contrast.
1.1.4.2 Self-Assembly Methods
Monodisperse colloidal particles can spontaneously organize into three-dimensionally
periodic crystals with a macroscopic size. Their lattice constant is easily adjusted from
the nanometer to the micrometer range by varying the size of the particles. Colloidal
crystals form spontaneously if there is a thermodynamic driving force, for example a
sufficiently high particle concentration, making it favorable for the particles to order into
a lattice, thus using the limited space more efficiently. Typical crystal sizes are from tens
to thousands of micrometers. The crystal structure formed usually is face centered cubic
(fcc), although low volume fraction body centered cubic (bcc) crystals are formed if the
24
particles interact repulsively over distances much longer than their sizes.
Particles
which interact nearly as hard spheres show a tendency to form randomly stacked
hexagonal layers. In this structure the stacking order of the hexagonally packed (111)
25, 26
planes is not ABCABC… as in fcc, nor ABAB… as in hcp, but close to random.
Their self-organizing properties make spherical colloids as suitable candidates for
fabricating photonic crystals. There are only a few materials from which colloids can be
made with sufficient monodispersity to crystallize, namely silica, ZnS, and a number of
12
polymers, most notably polystyrene and polymethylmethacrylate. Most of the colloidal
crystals of these materials have a relatively modest refractive index contrast, even when
dried.
1.1.4.3 Colloidal Crystal Templating
The early calculations had already shown that the prevailing fcc structure possesses a
complete photonic band gap only for the inverted crystal structure, in which the air
27
spheres have a lower index than their environment. Furthermore, the refractive index
contrast needs to be very large (>2.85). Although the diamond structure has a complete
28
band gap for the direct crystal structure it is never formed by colloidal self-assembly.
More detailed calculations of the photonic properties of crystals formed by
self-assembling systems determined that the optimal air filling fraction was around
29, 30
80%,
but did not identify structures that are easier to fabricate. These facts quickly
led to the development of chemical means by which the interstitial voids of a colloidal
crystal can be filled with a high index solid, after which the colloidal particles can be
31-37
removed.
These approaches are known collectively as colloidal crystal templating
methods. In that way, the air filling fraction of such an “inverse opal” is automatically
close to the maximum sphere packing fraction of 74% and a larger variety of materials
can be used.
13