Green reduction and patterning of graphene oxide via photothermal and electrochemical methods
Bạn đang xem bản rút gọn của tài liệu. Xem và tải ngay bản đầy đủ của tài liệu tại đây (4.02 MB, 109 trang )
DECLARATION
I hereby declare that the thesis is my original work and it has been written by me in its
entirety. I have duly acknowledged all the sources of information which have been used in
the thesis.
This thesis has also not been submitted for any degree in any university previously.
____________
Tao Ye
21st May 2013
i
Acknowledgements
It has been an exciting and fulfilling experience for me to have spent the last three
years in the Nanomaterials Research Lab at the National University of Singapore.
Special thanks had to be given to my supervisor, Associated Professor Sow ChorngHaur for his contagious passion and optimism that encourages me on, valuable ideas
to direct me through the bottle-necks in research, and constant help and guidance in
the everyday experiments. No matter where I would be in the future, I will be sure to
take along with me this enriching and unforgettable experience.
Hearfelt gratitude must be given to Dr. Binni Varghese and Ms Sharon Lim for
interesting suggestions and numerous help, and to Mr. Teoh Hao Fatt for all the
collaborations. I would also thank Prof Tok Eng Soon, Dr Zhang Zheng for helping
with XPS measurements; Dr. Wang Shuai and Prof Loh Kian Ping for supplying
with experimental materials; Dr. Cong Chunxiao and Asst Prof Yu Ting for micro
Raman mapping. Sincere appreciation must also be given to my fellow labmates Mr.
Zheng Minrui, Mr. Lu Junpeng, Mr. Xi Yilin, Mr. Chang Sheh Lit, Mr. Rajesh, Mr.
Rajiv, Ms. Loh Pui Yee, Mr. Lee Kian Keat, and all the technicians Ms. Foo Eng Tin,
Mr. Chen Gen Seng, Mr. Ong for all the help I had received over the time and for
making the lab a warm and homely place to work in.
Last but not least, I would like to thank my family and friends for their endless
support and for always being there for me through all difficulties and frustrations. I
hereby dedicate this piece of work to them.
ii
Table of Contents
Acknowledgements ..................................................................................................... ii
Table of Contents ...................................................................................................... iii
Abstract ...................................................................................................................... vi
List of Publications and Presentations ................................................................... vii
List of Figures .......................................................................................................... viii
Chapter 1: Introduction ............................................................................................ 1
References ................................................................................................................ 3
Chapter 2: Theoretical Background ........................................................................ 4
2.1
Graphene ...................................................................................................... 4
2.1.1
Structure and Properties ........................................................................... 4
2.1.2
Synthesis and Modification ...................................................................... 7
2.2
Graphene Oxide ........................................................................................... 8
2.2.1
Structure ................................................................................................... 9
2.2.2
Synthesis ................................................................................................ 10
2.2.3
Properties ............................................................................................... 12
2.3
Reduced Graphene Oxide .......................................................................... 14
2.3.1
Structure ................................................................................................. 14
2.3.2
Reduction of Graphene Oxide................................................................ 15
2.3.3
Properties ............................................................................................... 17
2.4
Applications of Graphene Oxide-based Materials ..................................... 21
2.4.1
Thin Films of GO or RGO ..................................................................... 21
2.4.2
Transparent Conductor ........................................................................... 21
2.4.3
Sensing ................................................................................................... 22
2.4.4
Precursor to Graphitic Nanostructure .................................................... 22
2.4.5
Precursor to Graphene-based Composites ............................................. 22
References .............................................................................................................. 24
Chapter 3: Experimental Methods ......................................................................... 29
3.1
Sample Preparation .................................................................................... 29
3.2
Direct Writing with Focused Laser System ............................................... 31
3.3
Electrical Measurement .............................................................................. 34
3.4
Raman Spectroscopy .................................................................................. 35
iii
3.4.1
Basic Principles ...................................................................................... 35
3.4.2
Vibrational States ................................................................................... 37
3.4.3
Raman Spectrum of Graphite-based Materials ...................................... 38
3.4.4
Raman Spectra for Defective Graphite .................................................. 41
3.4.5
Substrate Effect ...................................................................................... 42
3.5
X-ray Photoemission Spectroscopy ........................................................... 43
3.6
AFM ........................................................................................................... 43
3.7
Microscopy and Spectrometer.................................................................... 44
References .............................................................................................................. 45
Chapter 4: Photothermal Reduction ...................................................................... 47
4.1
Introduction ................................................................................................ 47
4.2
Conductivity change................................................................................... 48
4.2.1
Increased Electrical Conductivity .......................................................... 49
4.2.2
Contact Resistance ................................................................................. 51
4.2.3
Effect of Channel Dimensions ............................................................... 52
4.2.4
Effect of Repeated Irradiation ................................................................ 53
4.3
Chemical Composition ............................................................................... 56
4.3.1
Raman Spectroscopy .............................................................................. 56
4.3.2
XPS ........................................................................................................ 58
4.4
Morphological Change ............................................................................... 60
4.4.1
Film Thickness ....................................................................................... 60
4.4.2
Optical Contrast ..................................................................................... 68
4.4.3
Patterning Ability ................................................................................... 72
4.5
Surface Properties ...................................................................................... 73
4.6
Proposed Mechanism of Reduction ........................................................... 74
4.7
Conclusion.................................................................................................. 75
References .............................................................................................................. 76
Chapter 5: Visible Electrochemical Reduction ..................................................... 78
5.1
Introduction ................................................................................................ 78
5.2
Electrochemical Reduction ........................................................................ 79
5.2.1
Directional .............................................................................................. 79
5.2.2
Reversibility ........................................................................................... 80
5.3
Change of Properties .................................................................................. 82
iv
5.3.1
Chemical Composition ........................................................................... 82
5.3.2
Morphological Change ........................................................................... 84
5.4
Temporal Behavior..................................................................................... 86
5.4.1
Area Change with respect to Time ......................................................... 86
5.4.2
Area Change correlated to Conductivity ................................................ 90
5.5
Mechanism ................................................................................................. 93
5.5.1
5.6
Moist assisted Redox Reaction .............................................................. 93
Conclusion.................................................................................................. 96
References .............................................................................................................. 97
Chapter 6: Conclusion ............................................................................................. 98
v
Abstract
The exfoliation of graphite oxide into graphene oxide (GO), and its subsequent
reduction to reduced graphene oxide (RGO), came into research attention initially as
a chemical synthesis route for large-quantity of solution-processable graphene; and
later for the unique properties and potential of graphene oxide (GO) and reduced
graphene oxide (RGO) themselves in applications, such as transparent conductors
and super capacitors. Most common methods of reduction to synthesize RGO require
hazardous chemicals as the reduction agents, which introduces additional
contaminations. However, here we investigated and compared two different
approaches for the green synthesis of RGO in ambient environment. We first
employed a focused laser beam system to locally reduce GO thin film deposited on
silicon-based substrates. The changes in the morphology, chemical composition and
electrical properties were studied between GO and RGO to reveal the mechanism of
the reduction via photothermal removal of the oxygen-containing functional groups.
The RGO had a high concentration of residual defects, similar to other works.
Therefore it could not demonstrate Quantum Hall Effect or ballistic transport as
graphene. However, a significant increase in its conductivity was observed upon
reduction. Moreover, controlled and facile patterning of the sample could be
achieved to produce continuous 2-dimensional carbon matrix with different electrical
properties. More complicated 3-dimensional structuring could also be achieved. We
then also investigated the reduction of GO via direct current. The reduction process
was reversible and optically observable in real-time. The properties of electrically
reduced GO (ERG) were also studied to confirm the change in its morphology,
chemical composition and electrical properties were similar to the product of
photothermal reduction. The process was tracked to elucidate the mechanism of the
electrochemical reduction. Finally the two different synthesis route was combined for
guided-electrochemical reduction of GO.
vi
List of Publications and Presentations
1. Ye Tao, Binni Varghese, Manu Jaiswal, Shuai Wang, Zheng Zhang, Barbaros
Oezyilmaz, Kian Ping Loh, Eng Soon Tok, Chorng Haur Sow Localized
insulator-conductor transformation of graphene oxide thin films via focused
laser beam irradiation Appl Phys A 106, 523-531 (2012)
2. Hao Fatt Teoh, Ye Tao, Eng Soon Tok, Ghim Wei Ho, Chorng Haur Sow Direct laserenabled graphene oxide–Reduced graphene oxide layered structures with
micropatterning J. Appl. Phys. 112, 064309 (2012)
3. H. F. Teoh, Y. Tao, E. S. Tok, G. W. Ho, and C. H. Sow Electrical current
mediated interconversion between graphene oxide to reduced grapene oxide
Applied Physics Letters 98, 1 (2011)
4. Conference presentation: Recent Advances in Graphene and Related
Materials Localized Insulator-Conductor Transformation of Graphene Oxide
Film via Focused Laser Beam Irradiation (2010)
vii
List of Figures
Figure 3.1A) Schematics of the Laser Beam System to focus laser onto sample
placed on the computer controlled x-y stage; B) Schematic diagram depicting
focused laser beam following onto the GO film on substrate with pre-deposited
gold electrodes for electrical measurement. ....................................................... 33
Figure 3.2 Basic principle of Raman Scattering ........................................................ 36
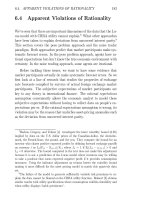
Figure 4.1 A) Optical micrograph of GO film after pruning a single channel across
the gold electrode (insert is the optical image of the as-deposited GO film); B) IV curves recorded from the as-deposited (black line) and laser pruned (blue
line) GO film. ..................................................................................................... 48
Figure 4.2 Mobility measurement from the single channel ....................................... 50
Figure 4.3 Comparison of I-V curve between different laser irradiated patterns: A)
single channel scanned (left optical image in the insert) and large area scanned
at contacts (right optical image in the insert); B) Single channel with contacts
scanned (left optical image in the insert) and additional large area scanned in the
centre (right optical image in the insert). ........................................................... 52
Figure 4.4 A) i) to v) Optical microscopy image of the channel with increasing width
vi) Schematic representation of the laser-scanning sequence to create a
conducting channel with fixed length and increasing width; B) I-V curves
recorded from channels i) to v); C) A plot of conductance of laser created
channel as a function of channel width .............................................................. 53
Figure 4.5 A) Optical micrograph to show the repeatedly irradiated area between the
electrodes; B) Change of conductance of reduced GO with repeated laser
irradiation, each time with 6 mW irradiation power. ......................................... 54
Figure 4.6 A) Raman spectrum and B) Raman-mapping of as-deposited and laserpruned GO .......................................................................................................... 57
Figure 4.7 A) C1s scan of XPS for GO and rGO; B) [pending] O1s scan for GO and
rGO..................................................................................................................... 58
Figure 4.8 XPS Spectrum of A) as-deposited and B) laser-irradiated GO film for
valence band. ...................................................................................................... 59
Figure 4.9 Change in film thickness due to laser irradiation as measured by AFM. A)
AFM image of single laser irradiated channel across two electrodes B) AFM
scan of the area enclosed by dotted line in Figure A and its corresponding height
profile; C) AFM image of a scratch on the GO film; D) Height profile near the
scratched region (blue) and fitted difference in film thickness (red) ................. 61
viii
Figure 4.10 A) AFM image of the laser irradiated channel and a nearby scratch; B)
height profile along the line indicated in the left image (blue) and fitted change
in film thickness (red). The film thickness is ~16nm and sunken depth is ~6nm.
............................................................................................................................ 63
Figure 4.11 A) AFM image of the laser irradiated area, including the electrodes; B)
AFM image of the area enclosed by dotted line in Image (A), GO film to the left
of the dotted line was laser-irradiated, to the right was as-deposited; C) AFM
image of a nearby scratch; D) Height profile along the line indicated in image C
(blue) and fitted difference in film thickness (red). ........................................... 64
Figure 4.12 The plot of the remaining thickness of laser-irradiated region against the
original film thickenss. Laser of 532nm, 10mW was focused over a 1μm by
2μm region and scanned over the sample at 10μm/s. ....................................... 65
Figure 4.13 AFM images of 8 line cuts with 1 to 8 times of laser irradiation each
(above) and the height profile along the line drawn in AFM image (below),
indicating no significant difference between sunken depth for four different
sample with sunken depth of A)<20nm; B)~100nm; C) ~200nm; D)~300nm. . 67
Figure 4.14 A) Optical contrast of GO film of various thickness with respect to the
SiO2 wafer with 100nm oxide layer (background); B) Optical micrograph
image of GO film of thickness i)~30nm; ii)~120nm; iii)~230nm respectively.
Note the alternating color for the thick patch in Biii). ....................................... 69
Figure 4.15 A) For a ~70nm film the i) optical micrograph, ii) reflection spectra, iii)
contrast spectra of as-deposited and laser pruned areas; B) For a ~230nm film
the i) optical micrograph, ii) reflection spectra, iii) contrast spectra of asdeposited and laser pruned areas. ....................................................................... 71
Figure 4.16: (A) and (B) Complex structures created by focused laser irradiation on a
GO drop-cast film on SiO2/Si substrate. ........................................................... 72
Figure 4.17 A) Optical image of the laser irradiated channel across electrodes (top)
and after sonication GO film was removed from substrates while rGO remained
(bottom); B) I-V curves of the same channel measured before and after
sonication; C) A single stand-alone channel on SiO2/Si substrate, far away from
the electrodes, created by laser pruning and followed by sonication. ................ 73
Figure 5.1 The optical micrograph of GO film deposited between two gold electrodes
at t=0, 100, 200 and 300s respectively to show darkening of the sample from
negative electrode on the right which extend towards and eventually bridges
with the positive electrode on the left. ............................................................... 80
Figure 5.2 Reversibility of Electrochemical Reduction of GO. A) as-deposited GO
film on two gold electrodes. Bias voltage of 3V is applied across the two
electrodes starting from t=0, with left electrode being positive; B) darkening of
sample from right electrode indicating formation of ERG region until t=120s
ix
when ERG region has not reached the left electrode, applied bias was reversed;
C) at t=164s, ERG on the right is receding, while ERG region from left is
extending to the right; D) at t=234s ERG region from the right has completely
retracted. ............................................................................................................. 81
Figure 5.3 A) Raman of as-deposited and electrochemically reduced GO; B) D and G
peaks of as-deposited, reduced and reoxidized GO. .......................................... 83
Figure 5.4 C1s spectrum from XPS measurement of the as-deposited, electrically
reduced or electrically re-oxidized GO sample. The C=O peak at 287eV
decreased upon reduction and increased to beyond its original value during reoxidization. There is also a lack of formation of C-O peak around 286eV. ...... 84
Figure 5.5 AFM for ERGO samples. A) ERG region between two electrodes as
imaged by i)optical microscope and ii) AFM image, note the dotted line maps
the ERG region; B) section line taken from AFM image; C)Height change along
the section line taken. ......................................................................................... 85
Figure 5.6 A) Region between electrodes was captured from optical micrograph to
track the area of reduced GO; Note that for the area analysis, only the blue and
cyan regions were counted as the others were inhomogeneous patches inherent
with the as-deposited GO film. B) Evolution of reduced GO area over time from
frame by frame analysis of video captured, note the additional growing finger
after 9.5s when ERG region has bridged the two electrodes. The electrodes are
not shown in the graph, with anode on the left. ................................................. 86
Figure 5.7 Area over time curve. The curve starts with a quardratic phase followed
by a linear phase. The decreasing “tail” at the end of the curve was due to
change of contrast at the end of video. ............................................................... 87
Figure 5.8 A) Model of extension of ERG area in Phase I; B) Transition state when
the ERG region first fully connects the two electrodes forming a conduction
bridge; C) Models for the expansion of ERG area in Phase II, Model I assuming
uniform rate of expansion throughout the area, Model II assuming non-uniform
rate of expansion, resulting in a linear correlation between width of ERG region
and the longitudinal position. The actual shape of the ERG region is somewhere
in between. Red arrows indicate the velocity of evolution of ERG regions. ..... 89
Figure 5.9 A) Current Vs Area B) Change of Sheet Resistance over time. Model I
and II were shown in Figure 5.8C) .................................................................... 91
Figure 5.11 Laser Pruning guided ERG. A) GO film with laser irradiated RGO
segments between gold electrodes; B) The same sample after 5V bias voltage
over a period of time. Note the dendrites extended from RGO segments towards
the cathode, while the end nearer to the anode fades. Dendritic connections were
formed between other electrodes, or between RGO segments and other
electrodes, too. ................................................................................................... 95
x
Chapter 1: Introduction
Graphite as an allotrope of carbon has been a subject of interest for scientists since
18th centuries. It has been long known that graphite consists of layers of honeycombshaped carbon atoms stacked one over another. Each atomically thin single layer of
graphite is called graphene. It has been presumed that free standing single layer
graphene is unstable until demonstrated otherwise in 2004 by Geim and Novoselov
et. al[1]. It has shown unique electronic properties right from its discovery and since
then attracted remarkable research interests.
A major hurdle in research and application of graphene is to find an efficient method
for large-scale synthesis of the high-quality material. One of the potential methods
explored was the chemical exfoliation of graphite via oxidation-reduction cycle. The
oxidation of graphite [2] produces graphene oxide (GO), or earlier known as graphite
oxide. The reduction of GO forms reduced graphene oxide (RGO). The residual
defects in RGO [3] lead to the drastic differences in its structure and properties from
pristine graphene. It is better viewed as a non-stoichiometric material with highly
conducting graphitic domains interspersed in an amorphous matrix. On the other
hand, the presence of defects renders the material miscible with a wide range of
solvents [4, 5] and readily available for chemical or physical adsorption [6-9]. The
physical properties of GO and RGO can also be chemically tuned by varying the
oxygen-containing functional groups [10, 11]. Therefore, reduction of GO remains
an economical and up-scalable method for producing solution-processable and
chemically viable graphene for a wide range of applications that are less demanding
on the band structures of pristine graphene.
Reduction for most experiments was carried out with chemical reducing agents,
thermal annealing, or a combination of both. These methods would reduce the entire
sample, and require furnace or hazardous chemicals. Our focus in this thesis is to
investigate green reduction methods that can be carried out in ambient environment
and room temperature, assisted by either a focused laser beam or a direct applied
current. More importantly, both methods reported here allow the localized reduction
of GO to RGO on a deposited GO film, with the best resolution of ~1μm. Therefore
1
patterning and reduction of GO was carried out simultaneously instead of the
traditional methods of patterning GO thin film via oxidative removal before
reduction. As the electronic properties of GO and RGO differs drastically, these
green methods for localized reduction of GO leads us one-step closer to achieving
continuous carbon electronics. Via investigation of the properties of RGO produced
as well as the reduction process, we strive to better understand the mechanisms of
these methods for its future optimizations and applications.
This thesis is organized as follows. In the next chapter, some backgrounds on
graphene, graphene oxide and reduced graphene oxide would be introduced,
covering the structure, properties, methods of synthesis and applications. The current
methods for reduction and patterning of GO is also presented, as well as some
theories on the electrical conduction in RGO.
In Chapter 3, the experimental methods for the synthesis, reduction and
characterization of GO film is described. Some theories on Raman spectroscopy of
graphitic material were also detailed. In Chapter 4, methods of photothermal
reduction and patterning of GO is detailed as well as characterization of the
properties of GO and RGO. In Chapter 5, electrochemical reduction of GO is
detailed with a focus on the reduction process. Finally, the concluding Chapter 6
summarizes the results of the previous two chapters.
2
References
[1]
K. S. Novoselov et al., Science 306, 666 (2004).
[2]
D. C. Marcano et al., Acs Nano 4, 4806 (2010).
[3]
C. Gomez-Navarro et al., Nano Letters 10, 1144 (2010).
[4]
S. Park et al., Nano Letters 9, 1593 (2009).
[5]
D. Li et al., Nature Nanotechnology 3, 101 (2008).
[6]
D. R. Dreyer et al., Chem. Soc. Rev. 39, 228 (2010).
[7]
S. Park, and R. S. Ruoff, Nature Nanotechnology 5, 309 (2010).
[8]
K. P. Loh et al., J. Mater. Chem. 20, 2277 (2010).
[9]
G. Eda, and M. Chhowalla, Advanced Materials 22, 2392 (2010).
[10]
U. Kurum et al., Applied Physics Letters 98 (2011).
[11]
J. Yan et al., Physical Review Letters 98 (2007).
3
Chapter 2: Theoretical Background
2.1 Graphene
Graphene is a single layer of graphite discovered as the first atomically thin film
being metallic and continuous under ambient conditions[1]. Its unique band structure
has drawn great research attention on its properties and applications.
2.1.1 Structure and Properties
Graphene has the same atomic structure as a single layer of graphite, with carbon
atoms in hexagonal arrangements. Each atom is connected to three neighboring
carbon atoms via a single bond. All carbon atoms, except those on the edge, are in
sp2 hybridization. The honeycomb lattice of carbon atoms has been confirmed by
transmission electron microscopy. Rippling of the flat graphene monolayer is present
in both suspended graphene or graphene on a substrate, which is believed to
compensate for the instability of 2D crystals [2].
2.1.1.1 Band Structure
The calculation of energy band of graphene is the same as that of a single layer of
graphite, ignoring inter-layer interaction. Each carbon has four valence electrons,
three of which form tight bonds with neighboring atoms 120° apart in the same
plane. Their wave functions are of the form [3]
where
is the 2s wave function for carbon and
functions whose axes are in the directions
are the 2p wave
towards its three neigbours in the plane.
The fourth electron is in the 2pz orbital perpendicular to the plane.
Each unit cell of graphene contains two atoms, with unit vectors
4
where
is the unit cell size of 1.42Å. The corresponding reciprocal space is defined
by reciprocal vectors
The reciprocal unit cell or Brillouin zone is therefore also a hexognal cell rotated π/6
from the unit cell. The distance between centre of Brillouin zone Γ to the midpoint of
one side M is
. The points of the hexagon are termed K and K’ alternatively.
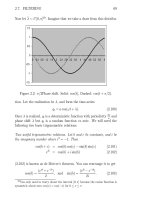
Tight-binding calculation generates the energy dispersion relationship of graphene as
,
where t=2.75 eV is the nearest neighour transfer integral. The dispersion relationship
in the Γ-K or Γ-K’ directions can be obtained as
,
which upon first-order approximation gives a linear dispersion relationship
As the effective mass of fermions is defined as
, at Dirac points graphene
can be viewed as having massless fermions[4], which leads to a range of interesting
phenomenon such as Quantum Hall Effect[5] that gave rise to the significance of
graphene in both fundamental research and applications.
5
2.1.1.2 Optical Contrast
The unique optical property of graphene has been noted since its discovery for its
potential as a transparent conductor [6]. It has also been noted that graphene layers
has a distinctive optical contrast on an oxidized Si wafer. As a good conductor, the
transparency of graphene is sensitively dependent on the thickness so much so that
difference of a single layer can be identified with optical contrast under the right
condition. This property allows optical micrograph to be the most practical fast
method to identify monolayer graphene as compared to the traditional methods like
Atomic Force Microscopy (AFM) or Scanning Electron Microscopy (SEM) that are
much slower and damaging to the sample.
In the earliest works, the single sheet graphene can be sufficiently visible for optical
detection under a microscope only on 300nm SiO2[7]. Small changes in substrate
property, such as thickness of the oxide layer would lead to a significant reduction of
contrast. As expected the optical contrast also varies from group to group due to
different preparation method and sample quality.
Various follow-up works have been carried out to explain the origin of the optical
contrast [8-11] and therefore enhance optical detection of single sheet graphene[12].
Calculations are mostly done with Fresnel’s conditions with frequency-dependent
dielectric function of silicon and silicon dioxide [13] while for graphene, some
studies approximate it as the real part of the complex dielectric function of graphite
that is dispersionless for the visible range [6, 11], while others use experimentally
measured frequency-dependent conductivity of graphene[8] or refractive index of
graphite [10] . Thin film interference alone does not account for the optical contrast
of single layers of graphene merely 0.34nm in thickness. Another important factor is
the opacity of graphene that modulates the relative amplitude of the interfering paths
giving red shift of interferences in the reflection spectrum [11]. Standing wave
resonances in the oxide layer lead to resonance cancellation and therefore reflection
zeroes for specific matching conditions [8, 11], consequently the most suitable
wavelength for human eye sensitivity occurs for oxide thickness of 300nm.
6
2.1.2 Synthesis and Modification
The first graphene film was prepared by mechanical exfoliation of pyrolytic graphite
[1], commonly referred to as the scotch tape method. The method is labor-intensive
and film size is limited to 10μm, but it produces the graphene film with the best
integrity. Graphene produced can be suspended to be considered “free-standing”, or
transferred to other substrates such as silicon (Si), silicon dioxide (SiO2) or boron
nitride (BN).
Ever since then there has been much effort devoted to synthesize graphene faster in
larger quantities with higher quality. The vast number of different methods can be
classified into five approaches [14]: mechanical exfoliation of bulk graphite [1];
chemical exfoliation of bulk graphite, usually via graphene oxide or graphene
fluoride[15]; expitaxial growth of graphene films from silicon carbide (SiC) [16-18];
chemical vapor deposition (CVD) of graphene monolayers[19, 20]; and longitudinal
unzipping of carbon nanotubes (CNTs)[21-23].
Chemical exfoliation of graphite via oxidation-reduction cycle was, in the early
stage, one of the potential methods for producing graphene in a cost-effective and
up-scalable manner. This advantage was less significant with the development of
CVD methods to produce large-scale graphene rapidly. However, chemical
exfoliation is still the only method to produce solution-processable graphene, and
maintains its competitive edge for functionalization which is essential for certain
applications of graphene.
7
2.2 Graphene Oxide
Graphene oxide (GO) or earlier known as graphite oxide has been the subject of
study for a long time[24-26] . The initial research attention concentrated on it after
the discovery of graphene was for its potential as a precursor for solution-based
synthesis of graphene[27]. Subsequent studies, however, found that although
reduction of GO can remove the oxygen functional groups; it is difficult to restore
the defect sites introduced during oxidation. The non-stoichiometric nature of its
chemical structure also presents difficulty in its understanding, as the band structure
of GO as well as RGO varies between samples. The presence of residual defect sites
renders reduced graphene oxide (RGO) ineffective of demonstrating the fundamental
two-dimensional condensed-matter effects unique to graphene such as quantum hall
effects or ballistic transport.
On the other hand, however, its heterogeneous chemical and electronic structures
have led to unique properties and potential of GO itself. GO can be synthesized
conveniently from oxidation of graphite[28]. The various oxygen-functional groups
allow GO to interact with a wide range of organic and inorganic materials. It is
therefore miscible with a variety of solvents [29, 30] and can be deposited with
controlled thickness onto various substrates, and also readily complex with many
organic and inorganic systems for the synthesis of functional hybrids and composites
[31-34]. Furthermore, GO is an electronically hybrid material with conducting πstates from sp2 hybridized sites and a large carrier transport gap between the σ-states
of the sp3 hybridized defect sites. The fraction of sp2 and sp3 sites, and in turn the
band gap as well as conductivity can be chemically tuned over the range from
insulator to semi-metal. GO was therefore studied as a promising candidate for
number of applications like plastic electronics, solar cells, biosensors as well as
super-capacitors.
8
2.2.1 Structure
Graphene oxide (GO) is chemically similar, if not identical, to its precursor graphite
oxide. Structurally, however, GO is referring to the monolayers exfoliated from the
stacked structure of graphite oxide. Thickness of GO monolayer was determined as
~1nm from atomic force microscopy studies[35-37]. The significant increase of layer
thickness from that of single-layer graphene, which is 0.34nm [38], is attributed to
the oxygen-containing functional groups and adsorbed water above and below the
carbon basal plane. The intrinsic thickness from dehydrated samples is measured to
be ~0.6nm [39] . Lateral dimensions of GO can vary from a few nanometers to
hundreds of micrometers depending on various synthesis routes [40, 41].
The oxidative mechanisms as well as the precise chemical structure of GO has been
debated over the years. Before 1996 all the proposed structure of GO consists of
regular lattices with discrete repeat units with variation in the distribution and type of
the oxygen functional groups [42, 43]. Through solid-state magnetic resonance
(NMR) studies [44] Lerf et a.l characterized a series of GO derivatives and proposed
the widely accepted structural model of GO. Lerf’s model proposed that GO is of
non-stoichiometric and amorphous nature which explains the complexity and the
sample-to-sample variation that presents the primary challenge in elucidation of its
structure. They have demonstrated that the fundamental features of GO are mainly
tertiary alcohols and epoxides present on the surface with the double bonds being
either aromatic or conjugate [45]. They are ambiguous about the presence or absence
of carboxylic acid groups, if in very low quantities, at the periphery of GO[46]. Other
slight modifications have been proposed over the years, including esters of tertiary
alcohols, with five – and six-membered lactol rings decorating the edge [47, 48], but
the essence of model has not changed.
As-synthesized GO is primarily a covalent material with ~60% of carbon atoms in
the basal plane being sp3 hybridized through σ-bonding with oxygen in the form of
epoxy and hydroxyl groups. Yet, the atomic structure of GO is unique in that the
graphene basal plane is retained despite of the large strain. An ideal graphene sheet
consists entirely of sp2 hybridized carbon atoms, GO on the other hand is a two-
9
dimensional network consisting of variable sp2 and sp3 concentrations. Therefore
GO is also commonly viewed as a graphene-like material consisting of ordered small
sp2 clusters isolated within sp3 C-O matrix[49]. The oxygen-containing functional
groups responsible for the sp3 matrix have a wide range of variability in terms of type
and coverage, primary due to the difference in starting materials, i.e. quality of
graphite, and the oxidation protocols. The ordered-cluster-in-amorphous-matrix
model can be applied to explain various experimental observations including Raman
spectroscopy[50,
51],
scanning
tunneling
microscopy[52],
high
resolution
transmission electron microscopy[53, 54] and transport studies[27, 55].
2.2.2 Synthesis
The oxidation of graphite was dated back to some of the earliest studies on chemistry
of graphite. As early as 1859 graphite was oxidized with potassium chlorate (KCoO3)
and nitric acid(HNO3) in the effort to determine the molecular formula of graphite
[31]. Nearly a century later, Hummers and Offeman developed an alternative
oxidation method[56] using a combination of potassium permanganate (KMnO4) and
concentrated sulfuric acid (H2SO4). Diamanganese heptoxide (Mn2O7) formed from
KMnO4 in the presence of strong acid is the main oxidizing agent.
Subsequent methods of synthesis are mainly modified from these two primary
reaction routes. The reaction products show strong variance, depending not only on
the particular oxidation agents used, but also on the reaction conditions, and the
graphite sources, as the localized defects in its π-structure serve as seed points for the
oxidation process [31]. The Hummers method, with its relatively shorter reaction
time and absence of hazardous ClO2 has seen more use in current research, such as
the Modified Hummer’s methods used in our experiment [57]. One drawback of the
Hummers method is potential contamination by excess permanganate ions, which
could be removed by an additional treatment with hydrogen peroxide[58].
10
To obtain graphene oxide (GO), it is necessary to exfoliate the stacked graphite oxide
into monolayer or few-layered stacks. The most common exfoliation method is
simple sonication or stirring of GO in water or polar organic media. Compared to
mechanical stirring, sonication is faster, but causes substantial damage[59] to the
platelets leading to smaller size and a larger distribution of sizes [60]. In addition, the
oxidation process itself also causes breaking of the graphitic structure into smaller
fragments [61]. Exfoliated GO is then dispersed in a basic media solution so that the
surface functionality weakens the platelet-platelet interactions and prevents
agglomerations.
Other than differences in starting materials or oxidation protocols, the extent of
oxidation also leads to the variability of the structure and properties of graphene
oxide. Theoretical calculations predict that partial oxidation is thermodynamically
favored over complete oxidation; the exact identity and distribution of oxide
functional groups also depend strongly on the extent coverage, for example the
epoxy to alcohol ratio increases with increasing oxidation [62]. The fluidity of the
GO structure presents great challenges in its characterization and understanding, but
also great potential in its application as controlled and careful modification of the
oxygen-containing functional groups would allow tuning of the sp2 fraction and
tailoring of the electrical, optical and chemical properties of GO. [49]
11
2.2.3 Properties
2.2.3.1 Solubility
Graphene oxide (GO) can be dispersed in a number of different organic and
inorganic solvents, and therefore readily available for solution-based reactions and
depositions. Such dispersions are the precursors from which other graphene-based
derivatives are prepared.
Graphene oxide is intrinsically hydrophilic and readily disperses in water by mild
sonication. In fact GO is mostly synthesized in an aqueous solution. The maximum
dispersibility of graphene oxide in solution, which is important for processing and
further reactions, depends both on the solvent and the extent of surface
functionalization imparted during oxidation. At slightly basic pH, negatively
charged, hydrophilic oxygen-containing functional groups on the graphene oxide
surface can stabilize dispersions of exfoliated sheets and prevent agglomerations in
aqueous media. The greater the polarity of the surface, the greater the dispersability
will be, reported values typically range from 1 to a few mg mL-1.
The preparation of graphene oxide dispersions in the organic solvents is highly
desirable too, because it may significantly facilitate the practical use of this material
in forming graphene-polymer composites [63] or graphene-based hybrid materials
[64]. Suspending GO in organic solvent is not so easily accomplished. GO was first
dispersed in organic solvents via covalent functionalization with different molecules
and polymers[65]. However the presence of such stabilizers is not desirable as
surface modification can complicate the subsequent processing of materials and
affect both the mechanical and electronic properties. As-prepared GO can form
stable dispersion in several organic solvents[59]. Suspension of unmodified GO in
organic media was achieved by prolonged sonication of fine GO powder[59] or by
serial dilution of an aqueous dispersion of aqueous graphene oxide with appropriate
organic solvent into a primarily organic media[29].
12
2.2.3.2 Functionalization
One key application of graphene oxide (GO) is as a precursor to synthesize reduced
graphene oxide (RGO) via removal of oxygen-containing functional groups in order
to restore the structure and properties of graphene, albeit partially. The methods and
mechanisms of reductions would be discussed later in Section 2.3.2.
Instead of removing the functional groups, it is also possible to add other groups to
GO platelets using various chemical reactions via either covalent or non-covalent
bonding, resulting in chemically modified graphene (CMG). The chemically reactive
oxygen-containing functional groups on GO includes carboxylic acid groups at their
edges and epoxy and hydroxyl groups on the basal plane. For the carboxylic groups,
introduction of substituted amines is one of the most common methods of covalent
functionalization and the final products have been investigated for various
applications in optoelectronics [66], biodevices[67], drug-delivery [68] and polymer
composites [60] [69]. The epoxy groups can be easily modified through ring-opening
reactions under various conditions, such as nucleophilic attack by the amine.
Reaction of epoxy group can be also used to cross-link GO platelets via the epoxy
groups and strengthen the graphene paper [70]. Polymers have also been attached to
the surface of GO, typically by grafting-onto or grafting-from approaches [69, 71].
An ideal approach would utilize orthogonal reactions to selectively functionalize one
site over another. However, demonstration of the selectivity of these chemical
transformations remains challenging. Reaction with multiple functionalities is
possible, and the wide range of variability in the chemical composition of GO
presents immense difficulties in isolation and rigorous characterization of the
products. Despite of these challenges, GO is regarded as a versatile precursor for a
wide range of applications as would be discussed later.
13
2.3 Reduced Graphene Oxide
As one can tell from the name, reduced graphene oxide (RGO) is the product from
the reduction of graphene oxide (GO). Reduction is one of the most important
reactions of graphene oxide as it restores the disrupted sp2 bonding network of GO,
in order to recover graphene-like electrical properties due to the π-network. The
product of reduction is also called highly-reduced graphene oxide (HRG), and
chemically derived graphene (CDG) in literaures. However the product has
significant structural difference from graphene that would be made apparent. For
clarity, we will use the term reduced graphene oxide (RGO) from here onwards.
2.3.1 Structure
The structure of RGO is similar to GO except for the removal of oxygen-containing
functional groups. As the reduction produced CO and CO2 instead of O2 [72], it was
expected that the removal of the functional groups would not readily lead to
restoration of the sp2 bonding. Rather, a high concentration of residual defects would
remain on the π-network, such as remnant oxygen atoms[73], Stone-Wales
defects[50, 53] (pentagon-heptagon pairs) and holes[53] due to loss of carbon in the
form of CO and CO2. Improvement in high resolution imaging has allowed direct
visualization of the defective nature of RGO as shown in Figure 2 of Reference [53].
The high percentage of defect sites limits the electronic quality of RGO and therefore
it is not as effective as graphene in fundamental research of two-dimensional
materials.
In contrast with GO, the work on proposing calculated models for RGO has been
limited [49]. The work by Bagri et al demonstrated the evolution of the atomic
structure of GO as a function of the degree of reduction [74]. They observed that
RGO is disordered, consisting of holes within the basal plane due to the evolution of
CO and CO2 in agreement with the microscopy observations. They also found that
residual oxygen in fully reduced GO is a consequence of the formation of highly
stable carbonyl and ether groups that cannot be removed without destroying the
graphene basal plane. These calculations confirm and explain the difficulties in
restoring sp2 structures of RGO.
14
2.3.2 Reduction of Graphene Oxide
Reduction of GO to graphene can be carried out via a number of different approaches
such as thermal[75], chemical[76] and electrochemical methods[77].
When dispersed in solvents, a variety of chemical means may be used to reduce
graphene oxide. The most commonly used and one of the first reducing agent to be
reported was hydrazine monohydrate[76]. The strongly reducing chemical does not
react with water, making it perfect for GO reduction. One of the disadvantages of
using chemical methods of reduction, hydrazine in particular, is the introduction of
heteroatomic impurities. While effective at removing oxygen functional groups,
nitrogen tends to remain covalently bonded to the surface of graphene oxide and
affect the electronic structure of the graphene. Later sodium borohydride (NaBH4)
[78] was found to be more effective. The principal impurities are additional alcohols
and as an indication of effective reduction, sheet resistance of the product was
lowered to 59000Ωsq-1. Other reductants used include gaseous hydrogen[79] and
strongly alkaline solutions[80]. The use of multiple chemical reductants has also
been demonstrated as a route to rigorously reduce graphene [81].
Rather than using a chemical to strip the oxygen-containing functional groups from
the surface, it is also possible to create thermodynamically stable carbon oxide
species by directly heating graphite oxide in a furnace [82]. Exfoliation of the
stacked structure occurs through the extrusion of carbon dioxide generated by
heating GO whereby the high temperature gas creates enormous pressure within the
stacked layers[83]. A notable effect of thermal exfoliation is the structural damage
caused to the platelets by the releases of carbon dioxide[51]. Approximately 30% of
the mass of the GO is lost during the exfoliation process, leaving behind vacancies
and topological defects throughout the plane of the RGO platelet [84]. Defects
inevitably affect the electronic properties of the product and may also have an effect
on the mechanical properties of the product, compared to a chemically-reduced
sample [70, 85, 86]. An alternative heat source for thermal reduction other than
furnaces is strong light. Photothermal reduction was carried out using camera flash
light[87], pulsed femtosecond laser[88], or focused laser beam[89], with the added
15