High-Surface-Area Catalyst Design- Synthesis, Characterization, and Reaction Studies of Platinum Nanoparticles in Mesoporous SBA-15 Silica
Bạn đang xem bản rút gọn của tài liệu. Xem và tải ngay bản đầy đủ của tài liệu tại đây (736.8 KB, 11 trang )
2192
J. Phys. Chem. B 2005, 109, 2192-2202
High-Surface-Area Catalyst Design: Synthesis, Characterization, and Reaction Studies of
Platinum Nanoparticles in Mesoporous SBA-15 Silica†
R. M. Rioux,‡ H. Song,‡ J. D. Hoefelmeyer, P. Yang,* and G. A. Somorjai*
Department of Chemistry, UniVersity of California, Berkeley, and Materials Science DiVision,
Lawrence Berkeley National Laboratory, Berkeley, California 94720
ReceiVed: March 14, 2004; In Final Form: June 6, 2004
Platinum nanoparticles in the size range of 1.7-7.1 nm were produced by alcohol reduction methods. A
polymer (poly(vinylpyrrolidone), PVP) was used to stabilize the particles by capping them in aqueous solution.
The particles were characterized by X-ray diffraction (XRD) and transmission electron microscopy (TEM).
TEM investigations demonstrate that the particles have a narrow size distribution. Mesoporous SBA-15 silica
with 9-nm pores was synthesized by a hydrothermal process and used as a catalyst support. After incorporation
into mesoporous SBA-15 silica using low-power sonication, the catalysts were calcined to remove the stabilizing
polymer from the nanoparticle surface and reduced by H2. Pt particle sizes determined from selective gas
adsorption measurements are larger than those determined by bulk techniques such as XRD and TEM. Roomtemperature ethylene hydrogenation was chosen as a model reaction to probe the activity of the Pt/SBA-15
materials. The reaction was shown to be structure insensitive over a series of Pt/SBA-15 materials with particle
sizes between 1.7 and 3.6 nm. The hydrogenolysis of ethane on Pt particles from 1.7 to 7.1 nm was weakly
structure sensitive with smaller particles demonstrating higher specific activity. Turnover rates for ethane
hydrogenolysis increased monotonically with increasing metal dispersion, suggesting that coordinatively
unsaturated metal atoms present in small particles are more active for C2H6 hydrogenolysis than the low
index planes that dominate in large particles. An explanation for the structure sensitivity is suggested, and
the potential applications of these novel supported nanocatalysts for further studies of structure-activity and
structure-selectivity relationships are discussed.
1 Introduction
One of the goals of catalysis research is to design and
fabricate a catalyst system that produces only one desired
product out of many other possible products (100% selectivity)
at high turnover rates. Such a “green chemistry” process
eliminates the production of undesirable waste. To design a
catalyst for the “green chemistry” era, an understanding of the
molecular ingredients that influence selectivity must be incorporated into catalyst synthesis. Using model catalysts possessing
low surface area (1 cm2 metal single crystals) and 2-D transition
metal/metal oxide array catalysts, many of the molecular features
that control activity and selectivity have been uncovered. These
include the surface structure,1 metal particle size,2 site blocking
(i.e., selective poisoning of the catalyst surface),3 bifunctional
catalytic systems,4 and certain metal-oxide interfaces5 capable
of performing unique chemistry. One of the most mature areas
of selectivity control in heterogeneous catalysis is shapeselective zeolite catalysis.6 Reaction selectivity is imparted by
restricting the entry channel to the internal zeolite structure to
molecular diameters which are smaller than the diameter of some
potential reactants and products, requiring product formation
to occur in a shape-selective manner.
We have recently initiated research to design high-surfacearea catalysts7,8 whose properties can be controlled systematically and ultimately allow us to determine the role of various
†
Part of the special issue “Michel Boudart Festschrift”.
* Authors to whom correspondence should be addressed. E-mail:
,
‡ These authors contributed equally to this work.
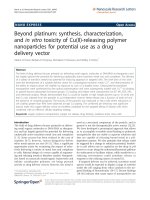
Figure 1. Synthetic scheme for the inclusion method.
parameters on reaction activity and selectivity. Departing from
the traditional catalytic synthetic techniques (i.e., incipient
wetness, ion exchange), we have developed a synthetic method
which allows precise control of the metal particle size and tuning
of the mesoporous SBA-15 silica support pore diameter (Figure
1). Control of the Pt particle size is achieved with solutionbased alcohol reduction methods. Platinum nanoparticles in the
1.7-7.1-nm range have been synthesized and incorporated into
a mesoporous silicate support using low-power sonication that
facilitates Pt particle entry into the SBA-15 channels by capillary
inclusion. After synthesis, the catalysts were characterized by
both physical and chemical techniques, such as transmission
electron microscopy (TEM), X-ray diffraction (XRD), low-angle
XRD, physical adsorption, and chemisorption of probe gases
to determine metal surface area. Chemisorption of probe gases
demonstrated that the stabilizing polymer used during nanoparticle synthesis could be removed after appropriate thermal
treatment. These Pt/SBA-15 materials are active for two
hydrocarbon test reactions, C2H4 hydrogenation and C2H6
hydrogenolysis. Reaction kinetics are compared with results
obtained using two-dimensional single crystals, nanoparticle
arrays deposited on silica, and with classical high-surface-area
supported platinum catalysts. This study represents a new
10.1021/jp048867x CCC: $30.25 © 2005 American Chemical Society
Published on Web 08/12/2004
Design of Pt/SBA-15 High-Surface-Area Catalyst
strategy in catalyst design that utilizes nanoscience to fabricate
active catalyst sites, which are deposited on a support to produce
a model heterogeneous catalyst. The precise control obtained
in these catalytic systems may enable very accurate structureactivity or more importantly structure-selectivity correlations
to be established, which will be the direction of future research.
2 Experimental Section
2.1 Pt Nanoparticle Synthesis. Hexachloroplatinic acid,
H2PtCl6‚6H2O (99.9%, metals basis) was purchased from Alfa
Aesar. Poly(vinylpyrrolidone) (PVP, Mw ) 29 000 and 55 000)
was obtained from Aldrich. Methanol, ethanol, and ethylene
glycol were used without further purification. Platinum particles
from 1.7 to 3.6 nm were synthesized according to literature
methods.9,10 The synthesis of Pt nanoparticles in the size range
1.7-7.1 nm is briefly summarized.
1.7-nm Pt Particles. NaOH (12.5 mL, 0.5 M) in ethylene
glycol was added to a solution of H2PtCl6‚6H2O (0.25 g, 0.48
mmol) in 12.5 mL of ethylene glycol. The mixture was heated
at 433 K for 3 h accompanied by N2 bubbling. A 6-mL aliquot
of the resulting solution was transferred to a vial. The particles
were precipitated by adding 1 mL of 2 M HCl, and dispersed
in ethanol containing 12.2 mg of PVP (Mw ) 29 000). The
solvent was evaporated and the residue was redispersed in water.
2.6-nm Pt Particles. PVP (133 mg) was dissolved in a mixture
of 20 mL of 6.0 mM H2PtCl6‚6H2O aqueous solution and 180
mL of ethanol. The mixture was refluxed for 3 h. The solvent
was evaporated, and the residue was redispersed in water.
2.9-nm Pt Particles. PVP (133 mg) was dissolved in a mixture
of 20 mL of 6.0 mM H2PtCl6‚6H2O aqueous solution and 180
mL of methanol. The reaction condition was the same as that
for 2.6-nm particles.
3.6-nm Pt Particles. Freshly prepared 2.9-nm Pt colloidal
solution (100 mL) in a water/methanol (1:9) mixture was mixed
with 10 mL of 6.0 mM H2PtCl6‚6H2O solution and 90 mL of
methanol. The reaction condition was the same as those for 2.6and 2.9-nm particles.
7.1-nm Pt Particles. A total 3 mL of 0.375 M PVP (Mw )
55 000) and 1.5 mL of 0.0625 M H2PtCl6‚6H2O (PVP/Pt salt
) 12:1) solutions in ethylene glycol were alternatively added
to 2.5 mL of boiling ethylene glycol every 30 s over 16 min.
The reaction mixture was refluxed for additional 5 min. The
particles were precipitated by adding triple volume of acetone,
and redispersed in water. All Pt colloidal solutions were adjusted
to 3 × 10⁻³ M based on the Pt salt concentration by adding
appropriate amount of deionized water.
2.2 Synthesis of Mesoporous SBA-15 Silica. Silica SBA15 was prepared according to the method reported in the
literature.11 Pluronic P123 (BASF, EO20PO70EO20, EO )
ethylene oxide, PO ) propylene oxide) and tetraethoxysilane
(TEOS, 99+%, Alfa Aesar) were used as received. Pluronic
P123 (6 g) was dissolved in 45 g of water and 180 g of 2 M
HCl solution with stirring at 308 K for 30 min. TEOS (12.75
g) was added to the solution with stirring at 308 K for 20 h.
The mixture was aged at 373 K for 24 h. The white powder
was recovered through filtration, washed with water and ethanol
thoroughly, and dried in air. The product was calcined at 823
K for 12 h to produce SBA-15 with a pore diameter of 9 nm.
The final calcined material had a surface area of 765 m2 g-1
and a pore volume of 1.16 cm3 g-1.
2.3 Preparation of Pt/SBA-15. Pt colloidal aqueous solution
(25.6 mL, 3 × 10⁻³ M) was mixed with 74.4 mL of water and
100 mL of ethanol. The mixture was quickly added to 1.5 g of
SBA-15, and the slurry was sonicated for 3 h at room
J. Phys. Chem. B, Vol. 109, No. 6, 2005 2193
temperature by a commercial ultrasonic cleaner (Branson,
1510R-MT, 70 W, 42 kHz). The brown precipitates were
separated by centrifugation, thoroughly washed with water and
ethanol, and dried in an oven at 373 K. Pt (1.7 nm)/SBA-15
was calcined at 623 K for 12 h, Pt (7.1 nm)/SBA-15 was
calcined at 723 K for 24 h, and all other catalysts were calcined
at 723 K for 12 h with O2 flow.
2.4 Catalyst Characterization. TEM experiments were made
on a Topcon EM002B microscope operated at 200 kV at the
National Center for Electron Microscopy at Lawrence Berkeley
National Laboratory. Aqueous Pt colloidal solutions were
dropped and dried on carbon-film-coated copper grids (Ted
Pella). Dried SBA-15 and Pt/SBA-15 powders were sonicated
in acetone for several seconds, dropped on the TEM grids, and
dried in air. A minimum of two hundred particles were counted
for determination of a number-average particle size. XRD
patterns were measured on a Bruker D8 GADDS diffractometer
using Co KR radiation (1.79 Å). Low-angle XRD patterns were
recorded on a Siemens D5000 diffractometer using Cu KR
radiation (1.54 Å). Nitrogen porosimetry data were collected
on a Quantachrome Autosorb-1 analyzer at 77 K. Elemental
analyses were conducted at Galbraith Laboratories, Inc.
Selective gas adsorption measurements were measured in a
volumetric apparatus constructed of Pyrex that obtained a
pressure below 5 × 10⁻⁶ Torr in the sample cell by use of a
liquid nitrogen trapped diffusion pump (Varian M2). The amount
of adsorbed gas was monitored using a digital pressure gauge
(MKS, model PDR-D). Total and reversible isotherms were
measured with an interim 1-h evacuation between isotherms.
The amount of adsorbed gas was extrapolated to zero pressure
for all adsorbates. Catalysts were reduced at 673 K for 75 min
and evacuated at 623 K for 1 h prior to any chemisorption
measurement at 295-300 K. H2 (Matheson, UHP), O2 (Airgas,
UHP), and CO (Matheson, UHP, Al cylinder) were all used
without further purification for chemisorption measurements.
2.5 Reaction Studies. The hydrogenation of ethylene was
conducted at 273-313 K in a plug flow reactor (PFR)
constructed of Pyrex. Gas flow rates were controlled by mass
flow controllers (Unit instruments) connected to a central
manifold of 1/4-in. stainless steel tubing. Ethylene (Airgas CP
grade), H2 (Matheson, UHP), and He (Matheson, UHP) were
used without further purification. Gas-phase concentrations were
determined by gas chromatography (HP 5890) using an FID
detector and isothermal temperature program with a homemade
alumina column (6 ft. × 1/8-in. o.d.). The total conversion of
ethylene was <10% for all temperatures studied. Typically,
catalysts were diluted with low-surface-area (2.5 m2 g-1) acidwashed quartz in a 1:3 catalyst-to-quartz ratio. Room-temperature ethylene hydrogenation required 1-3 mg of catalyst. The
effect of dilution on catalyst performance was tested12 and it
was verified that dilution ratios less than 10 had no effect on
catalyst activity. Lack of heat and mass transfer limitations were
confirmed by use of the Madon-Boudart test13 at 273 and 298
K for Pt (3.6 nm)/SBA-15 with three different Pt loadings.
Kinetic parameters on the reduced catalysts were measured as
well as reaction orders in ethylene and hydrogen at various
temperatures. Turnover rates in this paper are reported at
standard conditions of 10 Torr C2H4, 100 Torr H2, and 298 K.
During all kinetic measurements, the last point was duplicated
to verify that deactivation had not occurred during the course
of the experiment.
Hydrogenolysis of ethane (Airgas, UHP) was studied from
613 to 653 K in a differentially operated plug flow reactor
(PFR). At standard conditions of 20 Torr C2H6 and 200 Torr
2194 J. Phys. Chem. B, Vol. 109, No. 6, 2005
Rioux et al.
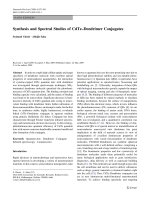
Figure 3. TEM image and particle size histogram for free-standing
2.9 nm Pt particles. The number-average Pt particle size was obtained
by counting 281 particles.
Figure 2. TEM images of the Pt particles of (a) 1.7 nm, (b) 2.6 nm,
(c) 2.9 nm, (d) 3.6 nm, and (e) 7.1 nm. The scale bars represent 10
nm.
H2, all conversions were <5% for the entire temperature range
examined. Reaction orders in ethane and hydrogen were
collected for Pt (X)/SBA-15 catalysts at 643 K with particle
sizes (X) ranging from 1.7 to 7.1 nm.
3 Results and Discussion
3.1 Synthesis and Characterization of Pt Particles. Monodisperse Pt particles of 1.7-3.6 nm were synthesized by
modified alcohol reduction methods according to the literature.9,10 Methanol, ethanol, and ethylene glycol served as
solvents for dissolving Pt salts and PVP, and as a reducing agent
of Pt according to the following reaction:
H2PtCl6 + 2 RCH2OH f Pt0 + 2RCHO + 6HCl
Pt particle size increases from 1.7 to 2.9 nm as the reaction
temperature decreases from 433 K in ethylene glycol to 338 K
in boiling methanol. This indicates that reduction of the Pt salts
at high temperature produces more Pt nuclei in a short period
and eventually affords smaller Pt particles. The 3.6-nm Pt
particles were successfully obtained by addition of 2.9-nm
particles as a seed for stepwise growth. The 7.1-nm Pt particles
were generated by slow and continuous addition of the Pt salt
and PVP to boiling ethylene glycol, described elsewhere in
detail.14 All aqueous Pt colloidal solutions with PVP are stable
for more than two weeks.
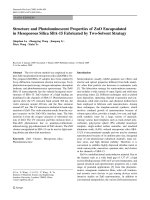
Pt particle sizes were measured by XRD and TEM. Figure 2
shows that the particles are uniform and have a narrow size
distribution. An example of the particle size distribution for freestanding 2.9-nm particles is shown in Figure 3. Average Pt
particle sizes estimated by XRD (Figure 4) are 1.7, 2.6, 2.9,
3.6, and 7.1 nm, and match very well with TEM results
(1.73(0.26, 2.48(0.22, 2.80(0.21, 3.39(0.26, and 7.16(0.37
nm).
Figure 4. XRD data for free-standing Pt particles of (a) 1.7 nm, (b)
2.6 nm, (c) 2.9 nm, (d) 3.6 nm, and (e) 7.1 nm.
3.2 Synthesis and Characterization of Pt/SBA-15 Catalysts. 3.2.1 Incorporation of the Pt Particles in SBA-15
Structure. SBA-15 with a pore diameter of 9.0 nm was used as
a catalyst support due to its high surface area (700-800 m2
g-1) and ordered mesoporous structure.11 Platinum particles of
different sizes were dispersed in a 1:1 mixture of water and
ethanol, and mixed with SBA-15 under sonication for 3 h at
room temperature. After calcination at 723 K with O2 flow, ca.
1 wt. % Pt(X)/SBA-15 catalysts (X ) 1.7, 2.6, 2.9, 3.6, and 7.1
nm) were obtained as pale brown powders. These materials were
characterized by XRD, TEM, and physisorption measurements.
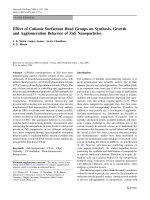
TEM images of Pt/SBA-15 samples (Figure 5) show that the
particles are well-dispersed in the entire channel structures even
for the largest Pt particles (7.1 nm). Three Pt reflections are
seen in the XRD patterns of SBA-15 catalysts (Figure 6). These
peaks are observed at 2θ ) 45.9°, 54.0°, and 80.1° assignable
to (111), (200), and (220) reflections of the fcc Pt lattice,
respectively, as well as a very broad signal at 2θ ) 27.4° for
amorphous SiO2. As the particle size increases, characteristic
reflections of the Pt lattice become sharper as expected. The
particle sizes for Pt incorporated into the support were calculated
from the full width at half-maximum (fwhm) of the Pt(111)
peak after baseline subtraction of pristine SBA-15. Particle sizes
are almost identical to those of the free-standing Pt particles in
solution. Low-angle XRD patterns (Figure 7) for all Pt/SBA15 catalysts exhibit three characteristic peaks indexed as (100),
(110), and (200) of the two-dimensional p6mm hexagonal
mesostructure with d100 spacing of 10.1 nm, similar to pristine
SBA-15.11 Measured BET surface areas of the catalysts are
690-830 m2 g-1, while pore volumes are 1.08-1.31 cm3 g-1.
BET isotherms of the samples before and after inclusion of 2.9nm Pt particles on SBA-15 are shown in Figure 8, and
Design of Pt/SBA-15 High-Surface-Area Catalyst
J. Phys. Chem. B, Vol. 109, No. 6, 2005 2195
Figure 7. Low-angle XRD patterns of (a) pristine SBA-15, and ∼1%
Pt(X)/SBA-15: X ) (b) 1.7 nm, (c) 2.6 nm, (d) 2.9 nm, (e) 3.6 nm,
and (f) 7.1 nm.
Figure 5. TEM images of the Pt(X)/SBA-15 catalysts: X ) (a) 1.7
nm, (b) 2.6 nm, (c) 2.9 nm, (d) 3.6 nm, and (e) 7.1 nm. The scale bars
represent 20 nm.
Figure 8. Nitrogen adsorption isotherms of SBA-15 and Pt (2.9 nm)/
SBA-15. The isotherm for Pt (2.9 nm)/SBA-15 is shifted by 400 cm3/g
STP.
Figure 6. XRD data of the Pt(X)/SBA-15 catalysts: X ) (a) 1.7 nm,
(b) 2.6 nm, (c) 2.9 nm, (d) 3.6 nm, and (e) 7.1 nm.
demonstrate that the inclusion process does not disrupt the SBA15 mesostructure. Low-angle XRD data and TEM images
indicate that the hexagonal wall structure of SBA-15 is robust
under the conditions of catalyst synthesis. The minimal change
in SBA-15 physical parameters after incorporation of Pt into
the silica reveals that there is no significant blocking of the
SBA-15 channel by Pt particles.
3.2.2 Efficient Incorporation of Pt Nanoparticles in SBA-15.
For homogeneous dispersion of the Pt particles within the silica
channels, sonication of the reaction mixture is required. Without
sonication, particles are primarily attached on the external
surface of SBA-15 and become large aggregates after hightemperature treatment. The extent of Pt dispersion with the SBA15 framework was followed with time by TEM (Figure 9). Pt
particles were rapidly adsorbed on the external surface of SBA15 within 3 min, followed by diffusion of the Pt particles into
the channels over 1.5 h, and finally dispersed throughout the
entire SBA-15 channel. Sonication effectively prevents Pt
particles from blocking the pore entrance, promoting homogeneous inclusion. A proper choice of the inclusion solvent should
also be considered. In pure water rather than a water/ethanol
(1:1) mixture, Pt particles were mainly deposited on the outer
surface of SBA-15 after sonication for 3 h, eventually leading
to large aggregates after calcination. Huang et al. reported
similar phenomenon for Ag nanowire formation within SBA15 channels,15 and suggested that it is attributed to the different
surface tensions of H2O (71.99 mN m-1) and ethanol (21.97
mN m-1).
The location of nanoparticles is an important issue in these
metal/mesoporous silica catalysts. Janssen et al. imaged threedimensional structures of metal and metal oxide particles in
SBA-15 by bright-field electron tomography, but the results were
difficult to interpret due to diffraction contrast.16 The ordering
of Pt nanoparticles within the silica channels was visualized by
synthesizing a Pt (2.9 nm)/SBA-15 with a high metal content
(14.4 wt %). Figure 10a shows that the silica channels are filled
with a significant number of small particles appearing as black
stripes. After treatment at 673 K for 75 min with H2 flow (Figure
10b), nearest neighbor particles aggregated to form nanorods
in conformation with the geometry of the SBA-15 channel. This
2196 J. Phys. Chem. B, Vol. 109, No. 6, 2005
Figure 9. TEM images of Pt/SBA-15 sonicated for various times at
room temperature in water/ethanol (1:1) mixture: (a) for 3 min,. (b)
for 10 min, (c) for 30 min, (d) for 90 min. The scale bars represent 20
nm.
Figure 10. TEM images of 14.4 wt % Pt (2.9 nm)/SBA-15: (a) before
H2 treatment, and (b) after treatment with H2 flow at 673 K for 75
min. The scale bars represent 20 nm.
confirms that most of the Pt particles in Pt/SBA-15 are located
inside the mesopores. It appears that the Pt particles in 0.95%
Pt (2.9 nm)/SBA-15 are primarily located inside the channels,
although the possibility of Pt particles located on the external
surface cannot be ruled out.
3.2.3 Particle Size Determination by Chemisorption Measurement. Particle size determinations by TEM and XRD are in
excellent agreement. While these techniques are bulk measures
of particle size, we have measured the particle size of the
supported Pt crystallites using selective chemisorption measurements. Boudart17 has suggested that the most pertinent normalization of catalytic activity to a turnover frequency basis should
be done with chemisorption measurements rather than electron
microscopy or XRD.
The dispersion or ratio of surface atoms to the total number
of atoms was determined for all ∼1% Pt/SBA-15 catalysts. A
summary of the chemisorption data for all catalysts is compiled
in Table 1. Monolayer values were obtained by extrapolating
isotherms to zero pressure. Dispersions for all catalysts were
determined using four separate methods: H2 chemisorption, CO
chemisorption, O2 chemisorption, and H2-O2 titration (Pts-O
+ 3/2H2 f Pts-H + H2O).18 The well accepted 1:1 surface
Rioux et al.
hydrogen metal atom stoichiometry was used to count the
number of surface atoms by H2.19 The reported dispersion based
on H2 chemisorption and H2-O2 titration for the Pt/SBA-15
series was based on the total, rather the irreversible (strong)
uptakes. Boudart20 has suggested that the total rather than the
irreversible uptake is a better measurement of Pt surface area
when Pt is not highly dispersed. For CO chemisorption, the
surface reaction was assumed to occur with a 1:1 stoichiometry.
Carbon monoxide adsorbs predominantly in the linear form on
Pt at ambient temperatures and high pressures of CO.21 Oxygen
was assumed to adsorb dissociatively at room temperature.
Fractional dispersions for the Pt/SBA-15 series range from
0.13 to 0.31 based on total H2-O2 titration uptakes for supported
as-synthesized Pt particles ranging from 1.7 to 7.1 nm. The four
separate measurements are in good agreement when compared
for the same sample. A 3.2% Pt/SiO2 catalyst prepared by ion
exchange (Pt/SiO2-IE)22 used as a standard had an irreversible
measured uptake corresponding to a dispersion greater than
unity. Spenadel and Boudart23 have suggested it is unlikely that
Pt is truly atomically dispersed because it would be difficult to
account for the rapid uptake of one hydrogen atom per platinum
atom. The lack of any Pt reflections in the X-ray diffraction
pattern confirms that the Pt particles are very small (<2.5 nm).
A value of unity for metallic dispersion was used for the 3.2%
Pt/SiO2-IE in calculations of turnover frequency for ethane or
methane formation in ethylene hydrogenation and ethane
hydrogenolysis, respectively.
The Pt particle size based on chemisorption was calculated
according to the equation d (nm) ) 1.13/D, where D is the
metallic dispersion. The above equation assumes spherical
particles and a Pt atom density of 1.25 × 10¹⁹ atoms m-2.24
From Table 1, it can be seen that the Pt particle size calculated
from chemisorption trends with the TEM particle size of the
free-standing particles. XRD measurements on the supported
Pt/SBA-15 particles indicated that the Pt particles were not
agglomerated by sonication or the pretreatment procedure;
however, as shown in Table 1, there is a significant difference
in the measured particle size between the two techniques
(chemisorption and XRD). While the two techniques measure
average particle size, their averages (surface versus volume) are
different, but often good agreement between the two is found
when the Pt particle size is in the range in which the
line-broadening technique is applicable.23 Two possible explanations exist to explain this large discrepancy in particle size.
Synthesis of the Pt nanoparticles requires the use of a template
polymer that prevents particles from agglomerating while in
solution. Consequently, this polymer (PVP in our synthesis)
bonds very strongly to the Pt surface and is difficult to remove
after the particles have been dispersed within the SBA-15 matrix.
A polymer removal method based on thermal calcination that
leads to no particle agglomeration has been developed. Although
the calcination procedure has been optimized, a possible
explanation for the discrepancy between chemisorption and
XRD particle size is a reduced exposed surface area due to
the existence of remaining polymer on the Pt surface. XRD
would be insensitive to this circumstance, while chemisorption
would directly probe this loss of surface area. Spectroscopic
data (both infrared and Raman) show no absorption bands
attributable to PVP, although it cannot be ruled out that the Pt
surface is covered with carbon. There is no apparent advantage
of using calcination times longer than 12 h (7.1 nm as an
exception).
An important consequence to note about comparison of the
free-standing TEM particle and that determined by selective
Design of Pt/SBA-15 High-Surface-Area Catalyst
J. Phys. Chem. B, Vol. 109, No. 6, 2005 2197
TABLE 1. Probe Gas Uptake and Average Particle Size for the Pt/SBA-15 Catalysts
probe gas uptakesc (µmol g-1)
catalysta
Pt powder
3.2% Pt/SiO2-IE
0.73% Pt/SBA-15
0.90% Pt/SBA-15
0.95% Pt/SBA-15
0.46% Pt/SBA-15
1.0% Pt/SBA-15
1.01% Pt/SBA-15
CO
particle size, d (nm)
TEM
particle sizeb
H2 total
total
irrev
O2 irrev
H2-O2
total
dispersion, D,
H2-O2, total
1.7
2.6
2.9
3.6
3.6
7.1
12.3
133.1
7.4
3.9
6.8
3.7
4.0
2.1
7.1
166.7
13.3
9.4
7.8
5.0
9.6
5.0
6.9
152.2
12.2
9.4
7.8
3.9
9.3
4.6
4.0
24.2
4.3
3.2
2.6
1.6
2.6
2.2
17.2
262.0
17.4
22.2
18.1
12.9
15.6
10.1
0.0022
1f
0.311
0.321
0.248
0.364
0.203
0.131
chemisorptiond
H2
H2-O2
235
<1
2.9
6.6
4.1
3.5
7.1
8.7
505
<1
3.6
3.5
4.6
3.1
5.6
8.7
XRDe
> 100
2.5
3.0
3.8
3.8
7.8
a
Elemental analyses determined by ICP-MS. b Number-average particle size. Determined by counting a minimum of 200 free-standing particles.
Conducted at 295 K. d Determined by 1.13/(Pts/PtT). e Based on the Scherrer equation after subtracting SBA-15 baseline. f Dispersion, D ) 1 if
Pts/PtT > 1.
c
TABLE 2. Reaction Rate and Kinetic Data for Ethylene Hydrogenation on Pt/SBA-15 Catalysts
catalysta
TEM particle
sizeb (nm)
activityc
(µmol g-1 s-1)
TOFc,d
(s-1)
Eae
(kcal mol-1)
3.2% Pt/SiO2-IE
0.73% Pt/SBA-15
0.90% Pt/SBA-15
0.95% Pt/SBA-15
0.46% Pt/SBA-15
1.0% Pt/SBA-15
1.7
2.6
2.9
3.6
3.6
123.34h
8.3
9.8
8.5
5.9
6.7
0.752h
0.710
0.659
0.703
0.683
0.644
7.1
6.9
7.4
7.9
7.6
6.9
reaction orders
H2g
C2H4f
-0.2
0.1
0.08
0.05
0.08
0.11
0.86
0.75
0.72
0.77
0.7
0.69
a
Elemental analyses determined by ICP-MS. b Number-average particle size. Determined by counting a minimum of 200 free-standing particles.
Reaction conditions were 10 Torr C2H4, 100 Torr H2, and 298 K. d Surface Pt (Pts) determined from total H2-O2 titration. e Reaction conditions
were 10 Torr C2H4, 100 Torr H2, and 273-313 K. f Reaction conditions were 6-40 Torr C2H4, 150 Torr H2, and 298 K. g Reaction conditions were
10 Torr C2H4, 100-500 Torr H2, and 298 K. h Rate extrapolated from 227 K assuming Ea ) 7 kcal mol-1 and temperature-independent reaction
orders.
c
chemisorption is that some portion of the supported Pt nanoparticle is involved in bonding with the silica surface and will
be unable to chemisorb gas. With the construction of the
appropriate geometrical picture of the metal-support interface,
the difference in particle size between XRD and chemisorption
measurements could potentially be used to calculate the
interfacial area between the Pt nanoparticle and mesoporous
SBA-15 silica.
3.3 Ethylene Hydrogenation on Pt/SBA-15 Catalysts. 3.3.1
Comparison of ActiVity and Kinetic Parameters with Other
Model Systems. Ethylene hydrogenation was chosen as a test
reaction to compare the activity of Pt/SBA-15 materials with
kinetic measurements made on supported Pt catalysts prepared
by standard preparation techniques (i.e., incipient wetness, ionexchange) and other model systems such as single crystals and
nanoparticle arrays. Table 2 is a compilation of the turnover
rates (at standard conditions) measured on a number of catalysts
used in this study including a Pt powder (Alfa Aesar, 99.9%, 1
µm particle size). Turnover frequencies at standard conditions
(10 Torr C2H4, 100 Torr H2, 298 K) for the Pt/SBA-15 catalysts
are ∼0.7 s-1. Pristine SBA-15 and the quartz diluent had no
activity for ethylene hydrogenation over the entire temperature
range of this study (273-313 K). The apparent activation energy
for this reaction is low (∼6-7 kcal mol-1). Turnover frequencies
for all catalysts with particle sizes ranging from 1.7 to 7.1 nm
were the same, confirming the well-known structure insensitivity
of this reaction. Table 3 is a compilation of turnover frequencies
for ethylene hydrogenation over selected classical high-surfacearea supported catalysts and model systems. A complete
compilation of ethylene hydrogenation kinetics on metallic
catalysts can be found elsewhere.25 Both the Pt(111) single
crystal and Pt nanoparticle arrays are more active than the Pt/
SBA-15 catalysts by an order of magnitude. Rates measured
on our monodispersed nanocatalysts (Pt/SBA-15 series) are in
TABLE 3. Compilation of Turnover Frequencies for
Ethylene Hydrogenation on Model Catalysts and Selected
Classical High-Surface-Area Supported Catalysts
catalyst
turnover
frequencya,b
(s-1)
Ea
(kcal mol-1)
reference
Pt/SBA-15
Pt(111)
Pt nanoparticle array
0.04% Pt/SiO2
Pt wire
Pt wire
0.05% Pt/SiO2
0.05% Pt/SiO2
2.45% Pt/SiO2
Pt film (evaporated)
0.05% Pt/SiO2
0.5% Pt/SiO2
9.2% Pt/Al2O3
∼0.7
9.3
14.3
4.4
2.7
3.5
0.0037
0.0029
9.3
50.5
1.3
17.5
53.4
∼7
10.8
10.2
8.6
8.6
10.0
16.0
17.0
10.5
10.7
9.1
8.9
10.0
this work
25
26
27
27
28
29
30
31
32
33
33
34
a
Rates corrected to 10 Torr C2H4, 100 Torr H2, and 298 K.
Corrected assuming zero order and first order dependence for ethylene
and H2, respectively.
b
very good agreement with measurements on classical highsurface-area supported catalysts.
The Madon-Boudart (MB) test13 was used to verify the
absence of heat and mass transfer effects during the roomtemperature hydrogenation of ethylene in a differential PFR.
The MB test requires measurement of the reaction rate (on per
gram basis) for catalysts with varying surface concentrations
of metal but with similar dispersion. A log-log plot of rate
versus surface concentration should yield a straight line with a
slope equal to one, if heat and mass transfer effects are absent.
For an exothermic reaction, the test should be repeated at a
second temperature. In accordance with the criteria of the MB
test, the rate was measured using catalysts with different metal
loading but similar dispersion (determined by H2-O2 titration)
2198 J. Phys. Chem. B, Vol. 109, No. 6, 2005
Figure 11. Temperature dependence (273-313 K) of H2 partial
pressure for ethylene hydrogenation on a 1.0% Pt (3.6 nm)/SBA-15.
Reaction conditions were 10 Torr C2H4, and 100-500 Torr H2. Lines
are drawn in for clarity.
at two different temperatures. The slope of the line (not shown)
at both temperatures is ∼1 verifying that the measured rate is
independent of the influence of transport effects.
Table 3 also contains a compilation of apparent activation
energies for a number of model systems and some selected
examples of classically prepared (i.e., incipient wetness, ion
exchange) heterogeneous catalysts. It is well-known that ethylene hydrogenation occurs at room temperature and below,
which suggests that the true activation energy for the reaction
is quite low. For all catalysts used in this study, the apparent
activation energy was ca. 7 kcal mol-1, which is slightly lower
than previously reported values on low loaded Pt/SiO2 catalysts
(9 kcal mol-1),26 electron beam lithography Pt nanoparticle
arrays (10.2 kcal mol-1),27 and a Pt(111) single crystal (10.8
kcal mol-1).28 Reaction orders in hydrogen are ∼0.6 at 298 K.
These are higher than the H2 order (0.5) predicted based on the
Horiuti-Polanyi mechanism,29 which assumes gas-phase hydrogen and surface H atoms are in equilibrium. The apparent
H2 reaction order is temperature-dependent, as shown in Figure
11. As the temperature increases from 273 to 313 K, the reaction
order in hydrogen increases from 0.45 to 0.7. Reaction orders
in hydrogen on the same series of Pt/SBA-15 catalysts at 195
K are ∼0.4. In a study of ethylene hydrogenation on Pt/SiO2
catalysts, Cortright and co-workers30 have shown that the
hydrogen order increased from 0.48 to 1.10 as the temperature
was increased from 223 to 336 K, at 25 Torr C2H4 and hydrogen
pressures ranging from 50 to 650 Torr. At low temperatures
and high ethylene pressures, the observed reaction-order dependency for both ethylene and hydrogen can be explained by
a Horiuti-Polanyi mechanism in which hydrogen is adsorbed
noncompetitively on a surface essentially covered with adsorbed
hydrocarbon species.
The olefin generally has an inhibiting effect on the overall
reaction rate in olefin hydrogenation reactions.31 The olefin
displaces hydrogen from the metal surface, negatively impacting
the measured reaction rate as the olefin pressure is increased.
At lower ethylene pressures and higher temperatures, more
adsorption sites are available for hydrogen and a maximum in
ethylene hydrogenation activity is seen on Pt catalysts. The
apparent reaction order in ethylene is temperature-dependent
(not shown). At room temperature, the dependence on ethylene
Rioux et al.
is zero order or slightly positive, while at higher temperatures,
the reaction order approaches -0.3. As the temperature is
increased and total surface coverage decreases, the ethylene
order becomes more negative, suggesting that the adsorption
between ethylene and hydrogen becomes competitive. Cortright
and co-workers30 have measured a similar trend with temperature, and have separately assembled a microkinetic model.32
Assuming a mechanism in which H2 could adsorb dissociatively
on a surface site in direct competition with ethylene or on a
noncompetitive adsorption site, the microkinetic model is able
to predict the experimentally observed reaction orders over a
100 K range.32 El-Sayed and co-workers have shown that the
reaction order in propylene during propylene hydrogenation is
∼0.1 at 313 K.33 In fact, a reaction order of ∼0.2 for ethylene
on the Pt/SBA-15 catalysts at 195 K has been measured. At
these low temperatures, on the Pt/SBA-15 catalysts, it appears
that ethylene is in direct competition with hydrogen for
adsorption sites and ethylene hydrogenation is not occurring
over the hydrocarbon-covered fraction of the surface.
Horiuti and Polanyi29 proposed a reaction mechanism that
involved the sequential hydrogenation of a surface olefin species,
which involved the formation of a surface half-hydrogenated
species (i.e., ethyl in the case of ethylene hydrogenation). Zaera
and Somorjai demonstrated that the hydrogenation of ethylene
on Pt(111) occurs on a hydrocarbon-covered surface.28 Ethylidyne (tCsCH3) was identified as a spectator species that turns
over orders of magnitude slower than the presumed reaction
intermediate, π-bonded ethylene.34 Somorjai and co-workers
suggest that the ethylidyne layer covers the surface upon which
ethylene adsorbs and H2 is adsorbed dissociatively on the Pt
surface.35 Electron energy loss spectroscopy studies of ethylene
hydrogenation on Pt(111) at 298 K demonstrated that the Pt(111)
surface is covered with ethylidyne and ethyl radicals.36 The ethyl
radicals were easily hydrogenated, which suggests they are a
reaction intermediate to ethane formation. Dumesic and coworkers have shown that the formation of ethylidyne is not
necessary for the hydrogenation of ethylene on supported Pt
particles.37 Beebe and Yates38 have shown that under hydrogenrich conditions, surface ethylidyne is not necessary for ethane
formation over supported Pd catalysts. It appears that there is
still much debate over the mechanism of ethylene hydrogenation,
but it is clear that the mechanism changes with temperature and
partial pressure of both ethylene and hydrogen, and our
nanocatalysts display behavior similar to that of classical catalyst
systems when ethylene and hydrogen pressures are varied.
3.4 Ethane Hydrogenolysis. The hydrogenolysis of ethane
is one of the most fundamental reactions studied in heterogeneous catalysis. The importance of studying such a reaction is
noted by considering that two of the most important processes
in heterogeneous catalysis are occurring in one reaction: C-H
and C-C bond activation. The high temperatures required for
ethane hydrogenolysis signifies the strength of the C-C bond
because it is well-known that H/D exchange on ethane occurs
at temperatures significantly lower than those required for
measurable hydrogenolysis activity.39 Anderson and Kemball40
have shown that H/D exchange on Pt films occurs at ∼430 K
with an apparent activation energy of 22 kcal mol-1. Zaera and
Somorjai have shown that deuterium exchange rates were 3
orders of magnitude higher than the rate of ethane hydrogenolysis on Pt(111) at 550 K.41
3.4.1 Comparison of Hydrogenolysis ActiVity and Kinetic
Parameters with Classical Supported Catalyst. The hydrogenolysis of ethane on the Pt/SBA-15 catalysts was studied in
a PFR at temperatures of 613-653 K under high hydrogen
Design of Pt/SBA-15 High-Surface-Area Catalyst
J. Phys. Chem. B, Vol. 109, No. 6, 2005 2199
TABLE 4. Reaction Rate and Kinetic Data for Ethane Hydrogenolysis on Pt/SBA-15 Catalysts
catalysta
Pt powder
3.2% Pt/SiO2-IE
0.73% Pt/SBA-15
0.90% Pt/SBA-15
0.95% Pt/SBA-15
1.0% Pt/SBA-15
1.01% Pt/SBA-15
TEM particle
sizeb (nm)
activityc
(µmol g-1 s-1)
TOFd
100 × (s-1)
Ea
(kcal mol-1)
1.7
2.6
2.9
3.6
7.1
0.508
2.356
0.159
0.155
0.110
0.091
0.035
4.51
1.44
1.36
1.05
0.91
0.87
0.52
54.0
65.3
48.9
54.6
53.9
56.7
48.9
reaction orders
H2g
C2H6f
0.90
0.98
0.70
0.70
0.65
0.74
0.75
-2.2
-2.6
-1.87
-1.84
-1.92
-1.91
-1.92
a
Elemental analyses determined by ICP-MS. b Number-average particle size. Determined by counting a minimum of 200 free-standing particles.
Reaction conditions were 20 Torr C2H6, 200 Torr H2, and 643 K. d Based on total H2-O2 titration. e Reaction conditions were 20 Torr C2H6, 200
Torr H2, and 613-653 K. f Reaction conditions were 18-55 Torr C2H6, 200 Torr H2, and 643 K. g Reaction conditions were 32 Torr C2H6, 80-300
Torr H2, and 643 K.
c
Figure 12. Time on stream behavior of 1% Pt (3.6 nm)/SBA-15
catalyst during ethane hydrogenolysis. Rates corrected to 20 Torr C2H6,
200 Torr H2, and 643 K.
partial pressures. Freshly reduced catalysts generally deactivated
over a 1-2 h time period, after which a steady-state rate was
achieved and measured rates were stable for the duration of an
experiment. The temporal behavior of ethane hydrogenolysis
for a 1% Pt (3.6 nm)/SBA-15 catalyst is shown in Figure 12.
All rates reported represent measured rates after deactivation
had subsided. Table 4 is a compilation of turnover frequencies
(at standard conditions) and kinetic parameters for this reaction.
Turnover frequencies for ethane hydrogenolysis range from 0.52
to 1.44 × 10⁻² s-1 at 643 K. The turnover frequency for Pt
powder was higher by about a factor of 3 for the most active
SBA-15 sample, 0.73% Pt (1.7 nm)/SBA-15. The higher
turnover frequency may be due to temperature gradients within
the catalyst bed. The Pt powder was not diluted and heat transfer
effects may influence the rate reported in Table 4. The absence
of transport artifacts was confirmed with the MB test for the
Pt/SBA-15 catalysts. Cortright and co-workers42 reported a
turnover frequency of 2.4 × 10⁻¹ s-1 at 643 K for a 2.5% Pt/
SiO2 with a particle size of 1.3 nm, which is an order of
magnitude higher than that measured on a Pt/SBA-15 catalyst
with comparable Pt particle size. Sinfelt and co-workers43
measured a turnover frequency of 1 × 10⁻³ s-1 on a 10% Pt/
SiO2 catalyst with a particle size of 5 nm. On the Pt/SBA-15
catalysts, the rate is sensitive to the Pt particle size with smaller
particles displaying higher activity. It appears from comparison
with reported turnover frequencies on high-surface-area supported catalysts that rates differ with particle size. A discussion
about the apparent structure sensitivity44 of ethane hydrogenolysis will be presented later.
Figure 13. Arrhenius plot for ethane hydrogenolysis. Reaction
conditions were 20 Torr C2H6, 200 Torr H2, and 613-653 K: (9) 1.7
nm, (2) 2.6 nm, (]) 3.6 nm, ([) 7.1 nm.
The apparent activation energy over the temperature range
studied (613-653 K) and a C2H6:H2 ratio of ∼5 varied from
48 to 65 kcal mol-1 with average activation energy of ca. 53
kcal mol-1 for the Pt/SBA-15 samples (Figure 13). Sinfelt and
co-workers measured an apparent activation of 54 kcal mol-1
on a 0.6% and 10% Pt/SiO2 catalyst at similar temperatures
and partial pressures of ethane and hydrogen.43,45 Apparent
activation energies for ethane hydrogenolysis have been shown
to change due to catalyst supports,43,46 bimetallic composition,47,48 and metal surface.43 The change in activation energy
with metal surface is attributed to a change in the ratedetermining step49 and has been correlated with the % d
character of the metal.50 The amount of hydrogen has been
shown to have a significant influence on the measured apparent
activation energy, with the activation energy decreasing as the
ratio of C2H6:H2 becomes greater than unity. Gudov et al.51
determined an apparent activation energy of 47 kcal mol-1 when
H2 was present in a 10-fold excess, and 23 kcal mol-1 when
ethane was in 3-fold excess.
Reaction orders for ethane and hydrogen are ∼0.7 and -1.9,
respectively, on the Pt/SBA-15 catalysts at 643 K (see Table
4). The strong negative hydrogen dependence suggests an
intense competitive adsorption between hydrogen and ethane
on the catalyst surface. Cortright and co-workers have shown
that the H2 order becomes less negative as the temperature is
increased (-1.6 at 673 K versus -2.2 at 573 K) or the H2 partial
2200 J. Phys. Chem. B, Vol. 109, No. 6, 2005
Figure 14. Structure sensitivity of ethane hydrogenolysis on ∼1%
Pt(X)/SBA-15 with Pt particle sizes ranging from X ) 1.7 to 7.1 nm.
Rates corrected to 20 Torr C2H6, 200 Torr H2, and 643 K.
pressure is decreased. A noticeable difference between the Pt/
SBA-15 catalysts and both standard samples (Pt powder and
Pt/SiO2-IE) is the degree of hydrogen dependence on the
overall rate. The hydrogen reaction order for the two standard
catalysts are g-2.2, while the H2 order for the SBA-15 catalysts
is ∼-1.9. One possible explanation for the lower negative
dependence on hydrogen is consistent with a previously
proposed mechanism in which ethane is adsorbed on chemisorbed hydrogen.52-54 The apparent reaction order in ethane is
consistent with previous experimental observations55 that for
measured reaction orders less negative in H2, the reaction order
in ethane decreases to below one. The ethane reaction order
was temperature-dependent, decreasing from 1 to 0 as the
temperature was increased from 573 to 673 K at a H2 partial
pressure of 100 Torr, but remained unity when the hydrogen
pressure was 350 Torr.42 Gudkov et al.51 have shown that the
measured reaction order in hydrocarbon and hydrogen can be
either positive or negative depending on the conditions, and
Cimino et al.56 have shown that the identity of the metal can
influence whether the hydrogen reaction order is positive or
negative. Observed partial pressure dependencies are consistent
with previously reported values and suggest a mechanism where
ethane adsorbs associatively to chemisorbed hydrogen.
3.4.2 Structure SensitiVity of Ethane Hydrogenolysis on Pt.
Turnover frequencies for ethane hydrogenolysis varied by a
factor of 3 over 1.7-7.1-nm particles with smaller particles
having higher activity for the Pt/SBA-15 catalysts (Figure 14).
A limited number of studies of ethane hydrogenolysis have been
conducted on Pt catalysts. Guczi and Gudkov57 reported a
monotonic decrease in ethane hydrogenolysis on supported Pt
particles in the size range of 3-20 nm. Turnover frequency
varied from 0.13 to 3 × 10⁻³ s-1 at 523 K with smaller particles
demonstrating higher activity. The authors suggest that the
increase in rate with smaller particles is related to an increase
in the number of corner and edge atoms. Sinfelt and co-workers
have measured turnover rates on atomically dispersed Pt
particles supported on both Al2O3 and SiO2. Measured turnover
frequencies are approximately an order of magnitude lower than
those measured in this work.45 Maximum rates as a function of
particle size have also been observed on supported Pt catalysts.
In a range of Pt particles of 1.7-5 nm, the specific activity had
a clear maximum at 2.5 nm.58 In fact, similar behavior was
observed for propane hydrogenolysis on the same series of
Rioux et al.
catalysts. Ethane hydrogenolysis over Pt/γ-Al2O3 catalysts
prepared by impregnation methods demonstrated a maximum
in rate with particle size although a limited number of samples
were studied.59 Catalysts with atomically dispersed Pt (dPt < 1
nm by H2 chemisorption) had a turnover frequency of 0.02 s-1
at 666 K in excess hydrogen, while the turnover frequency for
a catalyst with 1.4-nm particles increased by a factor of 2.5
(0.05 s-1), but decreased to 0.01 s-1 after the catalyst was
intentionally sintered by thermal treatment.
3.4.3 Ethane Hydrogenolysis Reaction Mechanism and Its
Relationship to Structure SensitiVity. A feature common to all
proposed mechanisms for ethane hydrogenolysis is that the
dehydrogenated C2Hx species is bonded to more than one metal
surface atom, which is dependent upon the degree of ethane
dehydrogenation. Dumesic and co-workers have conducted a
number of theoretical studies of ethane adsorption on Pt
clusters60,61 and slabs61 to investigate the interaction of possible
C2Hx intermediates with a Pt surface. Calculations of C2Hx
species adsorbed on a Pt surface suggest that primary pathways
for C-C bond cleavage may take place through highly
hydrogenated activated complexes, which is contrary to the
mechanisms interpreted solely from kinetic measurements.62,63
For example, the barriers to C-C bond cleavage of the activated
complexes of ethyl (C2H5) and ethylidene (CHCH3) are 44 and
39 kcal mol-1, respectively, compared with 61 and 79 kcal
mol-1 for vinyl (CHCH2) and vinylidene (CCH2) species.
Microkinetic analysis64 has also suggested that C-C bond
cleavage takes place through an ethyl (C2H5) species, while a
CHCH3 species also contributes to C-C bond cleavage. The
ethyl radical is the most reactive intermediate, but not the most
abundant surface intermediate (masi). The highly dehydrogenated species, ethylidyne (C-CH3), is stable on the surface
and believed to be the masi after adsorbed H (θH ) 0.55 at 623
K). Examining the hydrogenolysis of ethane over a wide range
of experimental conditions, Gudkov suggested that the ratedetermining step changes with reaction conditions. At high ratios
of hydrogen to ethane, the cleavage of the C-C bond occurs
through the ethyl radical, while at low hydrogen-to-ethane ratios,
C-C bond breakage occurs in a highly dehydrogenated species.51 The hydrogenolysis of ethane on Pt single crystals is
currently under investigation in our laboratories using sum
frequency generation to identify reaction intermediates under
relevant turnover conditions.65
Boudart has suggested that structure sensitivity/insensitivity
may be related to the number of surface atoms to which the
critical reactive intermediate is bound.66 With this definition, a
structure-insensitive reaction may be one where the critical
intermediate binds through one or two surface atoms. Conversely, a reaction may be classified as structure-sensitive if
the critical reactive intermediate is bound to multiple atoms.
Single crystals are useful for studying the effect of surface
structure on catalytic activity, and are useful analogues for
comparison with metal particles in the range of 1-5 nm. A
particle size change from 1 to 5 nm is similar to looking at
different crystallographic planes on a macroscopic single
crystal.66 Surprisingly, outside of one study,41 no other kinetic
data could be found for the hydrogenolysis of ethane on Pt single
crystals.
To understand the role of surface structure on ethane
hydrogenolysis, Dumesic and co-workers have studied the
reactivity of various C2Hx species on Pt(111) and Pt(211) slabs
using density functional theory methods.61 The (211) facet is
composed of single atom steps of (001) orientation separated
by two atom wide terraces of (111) orientation. The calculations
Design of Pt/SBA-15 High-Surface-Area Catalyst
J. Phys. Chem. B, Vol. 109, No. 6, 2005 2201
tools are complimentary and more is learned together rather
than individually. The development of a high-surface-area
monodispersed metal nanocatalyst is a major development in
heterogeneous catalysis research. These materials are model
systems of the industrially used materials with the major
advantage that they have several properties (i.e., metal particle
size and surface structure, particle location within support) that
can be rationally tuned. This permits promising experimental
studies of structure-activity and more importantly structureselectivity relationships using multi-path catalyzed reactions
such as alkane (n-hexane, n-heptane) reforming.
Figure 15. TEM images of 0.95 wt % Pt (2.9 nm)/SBA-15 after
reaction: (a) ethylene hydrogenation at 195 K, and (b) ethane
hydrogenolysis at 643 K. The scale bars represent 20 nm.
show that the barrier from the stable C2H5 adsorbed species to
the corresponding activated complex is 17 kcal mol-1 lower
on Pt(211) than Pt(111), while the Pt(211) is more efficient at
stabilizing the C2H5 adsorbed species by ∼11 kcal mol-1.60,61
The stable adsorption of C2H5 to Pt(221) and Pt(111) occurs
through a carbon atop a Pt atom, while the activated C2H5
complex is bonded to two Pt atoms on Pt(111). In the case of
Pt(211), the activated C2H5 complex is bonded through two
atoms on the (111) terrace adjacent to the step edge. The binding
energy in a 2-fold adsorption site is 28 kcal mol-1 stronger for
Pt(211) than Pt(111). Small metal crystallites have a higher
proportion of coordinatively unsaturated surface atoms, analogous to a stepped single crystal, while the surfaces of large
particles primarily expose low index planes (i.e., Pt(111)). It
appears that reactions involving these C2Hx and their activated
complexes will occur on these defect sites because they provide
more stable bonding. The theoretical calculation supports the
observed structure sensitivity of ethane hydrogenolysis on
smaller Pt crystallites.
The presence of an adsorbed alkyl layer on the metal surface
has been used to explain the structure insensitivity of olefin
hydrogenation reactions.44,66 The presence of this organic layer
on the metal surface effectively washes out the original metal
surface. In the case, of ethylene hydrogenation, Somorjai and
co-workers34 have shown that under reaction conditions, the
surface is covered with ethylidyne, a spectator in the reaction
because it turns over orders by magnitude slower than π-bonded
ethylene. Theoretical calculations and microkinetic analyses of
Dumesic and co-workers have shown that ethylidyne, vinylidene, and hydrogen are the most abundant intermediates on
the surface during ethane hydrogenolysis. While ethylidyne and
vinylidene are not involved in the primary reaction pathways,
they affect the observed kinetic rates through site blocking. The
presence of this metal-alkyl may be an additional factor
contributing to the weak structure sensitivity for ethane hydrogenolysis on supported Pt nanoparticles.
3.5 Stability of the Pt/SBA-15 Catalysts After Reaction.
Pt particles on the Pt/SBA-15 catalysts exhibited excellent
thermal stability. There was no detectable agglomeration after
ethylene hydrogenation at low temperature (195 K) and ethane
hydrogenolysis at high temperature (643 K) (Figure 15). Those
observations indicate that this catalyst is a very good model
for studying catalytic reactions at relevant turnover conditions.
3.6 Future Prospects for a High-Surface-Area Model
Catalyst. Our understanding of heterogeneous catalysis has
increased enormously due to studies using model systems. The
development of theoretical tools has enabled us to understand
experimental results and calculate heterogeneous catalysis
phenomena from first principles. In most circumstances, the
4 Summary
Pt nanoparticles with narrow size distributions (i.e., monodispersed) were produced by various solution-based reduction
methods and mesoporous SBA-15 silica was produced by wellestablished hydrothermal reactions. Pt nanoparticles were
embedded into the mesoporous silica using low power sonication. The as-synthesized Pt/SBA-15 was calcined under specific
conditions to remove the template polymer from the nanoparticle
surface and subsequently reduced to remove oxygen from the
Pt surface. The reduced Pt/SBA-15 catalysts were characterized
by TEM, XRD, and selective chemisorption measurements.
TEM and XRD measurements confirm that the as-synthesized
Pt particle size is unaffected by sonication, calcination, or
reduction, but particle sizes measured by selective chemisorption
are larger on average. Ethylene hydrogenation and ethane
hydrogenolysis were used as test reactions to compare the
activity of our high-surface-area monodispersed metal nanocatalysts with classical high-surface-area catalysts. Turnover
rates for room-temperature hydrogenation of ethylene were
identical to a Pt/SiO2 catalyst made by ion exchange and in
good agreement with single-crystal measurements, confirming
the structure insensitivity of this reaction. Ethane hydrogenolysis
rates were comparable to rates on Pt powder and an ionexchanged Pt/SiO2 catalyst. The Pt/SBA-15 catalysts demonstrated weak structure sensitivity, with smaller particles demonstrating higher activity. These catalysts exhibited excellent
thermal stability under relevant turnover conditions. The
synthesis of these catalysts is a general procedure which enables
numerous metal/support systems to be constructed for the study
of structure-selectivity correlations in heterogeneous catalysis.
Acknowledgment. This work is supported by the Director,
Office of Energy Research, Office of Basic Energy Sciences,
Materials and Chemical Sciences Divisions of the U. S.
Department of Energy under Contract DE-AC03-76SF00098.
We thank Professor M. A. Vannice of the Pennsylvania State
University for the 3.2% Pt/SiO2-IE material and Samrat
Mukherjee for preparation of the material. R.M.R. acknowledges
the Ford Motor Company and the Berkeley Catalysis Center
for financial support. H.S. thanks the Korea Science and
Engineering Foundation (KOSEF) for support under the Postdoctoral Fellowship Program.
References and Notes
(1) Strongin, D. R.; Carrazza, J.; Bare, S. R.; Somorjai, G. A. J. Catal.
1987, 103, 213.
(2) Mohr, C.; Hofmeister, H.; Radnik, J.; Claus, P. J. Am. Chem. Soc.
2003, 125, 1905.
(3) Farias, M. H.; Gellman, A. J.; Somorjai, G. A.; Chianelli, R. R.;
Liang, K. S. Surf. Sci. 1984, 140, 181.
(4) Sinfelt, J. H.; Hurwitz, H.; Rohrer, J. C. J. Phys. Chem. 1960, 64,
892.
(5) Hayek, K.; Kramer, R.; Paa´l, Z. Appl. Catal. A. 1997, 162, 1.
(6) Weisz, P. B. Pure. Appl. Chem. 1980, 52, 2091.
2202 J. Phys. Chem. B, Vol. 109, No. 6, 2005
(7) Ko´nya, Z.; Puntes, V. F.; Kiricsi, I.; Zhu, J.; Alivisatos, A. P.;
Somorjai, G. A. Catal. Lett. 2002, 81, 137.
(8) Ko´nya, Z.; Puntes, V. F.; Kiricsi, I.; Zhu, J.; Alivisatos A. P.;
Somorjai, G. A.; Nano Lett. 2002, 2, 907.
(9) Teranish, T.; Hosoe, M.; Tanaka, T.; Miyake, M. J. Phys. Chem.
B 1999, 103, 3818.
(10) Wang, Y.; Ren, J.; Deng, K.; Gui, L.; Tang, Y. Chem. Mater. 2000,
12, 1622.
(11) Zhao, D.; Huo, Q.; Feng, J.; Chmelka, B. F.; Stucky, G. D. J. Am.
Chem. Soc. 1998, 120, 6024.
(12) Berger, R. J.; Pe´rez-Ramı´re´z, J.; Kapteijn, F.; Moulijn, J. A. Chem.
Eng. Sci. 2002, 57, 4921.
(13) Madon, R. J.; Boudart, M. Ind. Eng. Chem. Fundam. 1982, 21,
438.
(14) Song, H.; Kim, F.; Connor, S.; Yang, P. 2004, submitted for
publication.
(15) Huang, M. H.; Choudrey, A.; Yang, P. Chem. Commun. 2000, 1063.
(16) Janssen, A. H.; Yang, C.-M.; Wang, Y.; Schu¨th, F.; Koster, A. J.;
de Jong, K. P. J. Phys. Chem. B 2003, 107, 10552.
(17) Boudart, M.; Dje´ga-Maraidassou, G. Kinetics of Heterogeneous
Catalytic Reactions; Princeton University Press: Princeton, NJ, 1984.
(18) Benson, J. E.; Boudart, M. J. Catal. 1965, 4, 704.
(19) Sinfelt, J. H.; Yates, D. J. C. J. Catal. 1968, 10, 362.
(20) Vannice, M. A.; Benson, J. E.; Boudart, M. J. Catal. 1970, 16,
348.
(21) Yates, D. J. C.; Sinfelt, J. H. J. Catal. 1967, 8, 348.
(22) Singh, U. K.; Vannice, M. A. J. Catal. 2000, 191, 165.
(23) Spenadel, L.; Boudart, M. J. Phys. Chem. 1960, 64, 204.
(24) Anderson, J. R.; Structure of Metallic Catalysts; Academic Press:
New York, 1975.
(25) Horiuti, J.; Miyahara, K. Hydrogenation of Ethylene on Metallic
Catalysts; NSRDS-NBS 13; National Bureau of Standards; U. S. Government Printing Office: Washington, DC, 1968.
(26) Schlatter, J. C.; Boudart, M. J. Catal. 1972, 24, 482.
(27) Grunes, J.; Zhu, J.; Anderson, E. A.; Somorjai, G. A. J. Phys. Chem.
B 2002, 106, 11463.
(28) Zaera, F.; Somorjai, G. A. J. Am. Chem. Soc. 1984, 106, 2288.
(29) Horiuti, I.; Polanyi, M. Trans. Faraday Soc. 1934, 30, 1164.
(30) Cortright, R. D.; Goddard, S. A.; Rekoske, J. E.; Dumesic, J. A. J.
Catal. 1991, 127, 342.
(31) Bond, G. C. Heterogeneous Catalysis: Principles and Applications,
2nd ed.; Oxford Science Publication: New York, 1987.
(32) Rekoske, J. E.; Cortright, R. D.; Goddard, S. A.; Sharma, S. B.;
Dumesic, J. A. J. Phys. Chem. 1992, 96, 1990.
(33) Yoo, J. W.; Hathcock, D. J.; El-Sayed, M. A. J. Catal. 2003, 214,
1.
(34) Davis, S. M.; Zaera, F.; Gordon, B. E.; Somorjai, G. A. J. Catal.
1985, 92, 240.
Rioux et al.
(35) Cremer, P. S.; Su, X. C.; Shen, Y. R.; Somorjai, G. A. J. Am. Chem.
Soc. 1996, 118, 2942.
(36) Backman, A. L.; Masel, R. I. J. Vac. Sci. Technol. A 1991, 9, 1989.
(37) Goddard, S. A.; Cortright, R. D.; Dumesic, J. A. J. Catal. 1992,
137, 186.
(38) Beebe, T. P.; Yates, J. T., Jr. J. Am. Chem. Soc. 1986, 108, 663.
(39) Loazia, A.; Xu, M. D.; Zaera, F. J. Catal. 1996, 159, 127.
(40) Anderson, J. R.; Baker, B. G. Proc. R. Soc. (London) A 1963, 271,
402.
(41) Zaera, F.; Somorjai, G. A. J. Phys. Chem. 1985, 89, 3211.
(42) Cortright, R. D.; Watwe, R. M.; Spiewak, B. E.; Dumesic, J. A.
Catal. Today 1999, 53, 395.
(43) Sinfelt, J. H.; Taylor, W. F.; Yates, D. J. C. J. Phys. Chem. 1965,
69, 95.
(44) Boudart, M. AdV. Catal. Relat. Subj. 1969, 20, 152.
(45) Sinfelt, J. H. J. Phys. Chem. 1964, 68, 344.
(46) Taylor, W. F.; Yates, D. J. C.; Sinfelt, J. H. J. Phys. Chem. 1964,
68, 2962.
(47) Sinfelt, J. H.; Carter, J. L.; Yates, D. J. C. J. Catal. 1972, 24, 283.
(48) Sinfelt, J. H. Acc. Chem. Res. 1977, 10, 15.
(49) Anderson, J. R.; Kemball, C. Proc. R. Soc. London A 1954, 223,
361.
(50) Sinfelt, J. H.; Yates, D. J. C. J. Catal. 1968, 10, 362.
(51) Gudkov, B. S.; Guczi, G.; Te´te´nyi, P. J. Catal. 1982, 74, 207.
(52) Frennet, A. In Hydrogen Effects in Catalysis; Paa´l, Z., Menon, P.
G., Eds.; Marcel Dekker: New York, 1988; p 399.
(53) Frennet, A. Catal. Today 1992, 12, 131.
(54) Frennet, A.; Lie´nard, G. J. Chim. Phys. PCB 1971, 68, 1526.
(55) Frennet, A.; Lie´nard, G.; Crucq, A.; Degols, L. J. Catal. 1978, 53,
150.
(56) Cimino, A.; Boudart, M.; Taylor, H. J. Phys. Chem. 1954, 58, 796.
(57) Guczi, L.; Gudkov, B. S. React. Kinet. Catal. Lett. 1978, 9, 343.
(58) Rhyndin, Y. A.; Kuznetsov, B. N.; Yermakov, Y. I. React. Kinet.
Catal. Lett. 1977, 7, 105.
(59) Cho, I. H.; Park, S. B.; Cho, S. J.; Ryoo, R. J. Catal. 1998, 173,
295.
(60) Watwe, R. M.; Spiewak, B. E.; Cortright, R. D.; Dumesic, J. A. J.
Catal. 1998, 180, 184.
(61) Watwe, R. M.; Cortright, R. D.; Nørskov, J. K.; Dumesic, J. A. J.
Phys. Chem. B 2000, 104, 2299.
(62) Sinfelt, J. H. J. Catal. 1972, 27, 468.
(63) Sinfelt, J. H. Catal. Lett. 1991, 9, 159.
(64) Cortright, R. D.; Watwe, R. M.; Dumesic, J. A. J. Mol. Catal. A
2000, 163, 91.
(65) Rioux, R. M.; Marsh, A. L.; Somorjai, G. A. Accepted for
publication.
(66) Boudart, M. J. Mol. Catal. 1985, 30, 27.