Psychological pathways influencing body fat changes among restrained eaters stress, eating and exercise behaviors
Bạn đang xem bản rút gọn của tài liệu. Xem và tải ngay bản đầy đủ của tài liệu tại đây (482.86 KB, 64 trang )
PSYCHOLOGICAL PATHWAYS INFLUENCING BODY
FAT CHANGES AMONG RESTRAINED EATERS:
STRESS, EATING, AND EXERCISE BEHAVIORS
LAI ZHAOXIU
B.Soc.Sci.(Hons), NUS
A THESIS SUBMITTED
FOR THE DEGREE OF MASTER OF SOCIAL SCIENCES
DEPARTMENT OF PSYCHOLOGY
NATIONAL UNIVERSITY OF SINGAPORE
2011
i
Acknowledgements
This research was funded by the National University of Singapore (WBS No.: R-581000-069-112).
I would like to give my heartfelt thanks to Dr Why Yong Peng, who has been a very
encouraging and patient supervisor. If not for his expert guidance, this study would not
have been possible.
I am grateful to A/P Fabian Lim, Professor David Koh, Ms Vivian Ng, Ms Sharon Sng,
Ms Margaret Yap, Mr Leong Kah Wai, and Dr Low Yen Ling for sharing with me their
expertise and for assisting me with various technical aspects of this study.
I would also like to thank Ms Cinda Ong, Mr Raymond Peh, and Ms Salome Antonette
Rebello for all their assistance with the Food Intake Assessment program.
I would also like to thank Deborah, Jiaoyu, Eleanor, Clara, Dorothy, Dania, Wan Ling,
and Shi Ting for their efforts during the tedious data collection and data processing.
Many thanks to Oliver, Manisha, and Yongzhi for their help with other aspects of the
study, such as helping me make sense of my incoherent ideas.
And last but not the least,
To Mum: Thank you for your tender loving care, and of course, for the home-cooked
meals. To Yj: Thank you for being my confidant, counselor, and cheerleader. And also,
for scolding me—because of that, I managed to finish my Discussion.
ii
Table of Contents
Acknowledgements
i
Table of Contents
ii
Summary
iv
List of Tables
v
List of Figures
vi
Chapter 1: Introduction
1.1.
Obesity: A pressing concern
1
1.2.
Body fat gain: Who is at risk and when?
2
1.3.
Stress and body fat gain: Eating behavior as an explanation
4
1.4.
Stress and body fat gain: Exercise behavior as an explanation
8
1.5.
Aims and hypotheses
10
Chapter 2: Method
2.1.
Participants
13
2.2.
Measures
16
2.3.
Design
20
2.4.
Procedure
20
2.5.
Data analysis
22
Chapter 3: Results
3.1.
Manipulation checks
24
3.2.
MLM analyses
25
iii
Chapter 4: Discussion
4.1.
Summary of findings
35
4.2.
Body fat gain: Restrained eaters may be at risk during stress
35
4.3.
Stress and body fat gain: Eating behavior is not an explanation
36
4.4.
Stress and body fat gain: Exercise behavior may be an explanation
39
4.5.
Stress and body fat gain: Irregular exercise and weight cycling as
another explanation
42
4.6.
Limitations and improvements
43
4.7.
Future directions
45
4.8.
Conclusion
45
References
46
iv
Summary
A prospective study was conducted to test eating (energy intake) and exercise
behaviors (energy expenditure) as explanations of stress-induced body fat gain among
high restrained eaters (dieters), a group identified as being vulnerable to obesity. In
addition, this study attempted to replicate stress-induced overeating among high
restrained eaters. Restrained eating was also examined as a moderator of the relationship
between stress and exercise behavior. Participants were 24 female high restrained eaters
and 24 female low restrained eaters with a mean age of 19.19 years (SD = 0.67).
Psychological stress, body fat, energy intake, and weekly exercise were measured at three
time points: the low stress baseline, high stress pre-examination, and low stress recovery.
High restrained eaters showed an increase in body fat during high stress while low
restrained eaters showed no significant change. The increase in body fat was not due to
energy intake but was possibly due to a decrease in energy expenditure, as inferred from
decreased exercise levels. Previous findings of stress-induced overeating among high
restrained eaters were not replicated. Restrained eating was a significant moderator of the
relationship between stress and exercise behavior. High restrained eaters showed a
decrease in exercise levels during high stress and an increase in exercise levels during
low stress. On the other hand, low restrained eaters showed no significant changes in
exercise levels. In conclusion, obesity prevention programs for restrained eaters should
not only focus on regulating energy intake but should also target physical exercise.
v
List of Tables
Table 1
Means and Standard Deviations of Dependent Variables for Total
Sample and by Restrained Eating and Time (N = 48)
16
Table 2
MLM Testing Differences Between High Restrained and Low
Restrained Eaters’ BF% Trends (N = 48)
27
Table 3
MLM Testing Differences Between High Restrained and Low
Restrained Eaters’ Energy Intake Trends (N = 48)
30
Table 4
MLM Testing Differences Between High Restrained and Low
Restrained Eaters’ Weekly Exercise Trends (N = 48)
33
vi
List of Figures
Figure 1
Psychological pathways of body fat investigated in this study.
2
Figure 2
Responses throughout recruitment process.
14
Figure 3
Changes in perceived stress levels across time points. Error bars
represent standard errors.
25
Figure 4
Changes in body fat percentage across stress levels by restrained
eating group. ―*‖ and ―**‖ indicate that adjacent points are
significantly different, p < .05 and p < .01 respectively.
28
Figure 5
Changes in weekly exercise across stress levels by restrained
eating group. ―*‖ and ―**‖ indicate that adjacent points are
significantly different, p < .05 and p < .01 respectively.
34
1
Chapter 1
Introduction
1.1. Obesity: A Pressing Concern
Obesity refers to the condition of having a high amount of body fat that can
threaten one’s health (World Health Organization, 2011a). Many studies have uncovered
links between excessive body fat and a number of diseases including type II diabetes,
cardiovascular diseases, some cancers, high blood pressure, osteoarthritis, and chronic
back pain (Field et al., 2001; Guh et al., 2009). For example, an obese individual has
seven times greater risk of developing type II diabetes compared to a normal-weight
individual (Abdullah, Peeters, de Courten, & Stoelwinder, 2010). Strazzullo and
colleagues (2010) have found that obese individuals were 1.50 times more likely to get
ischemic strokes.
Around the world, more and more people are becoming obese. In several
developed countries, the rates of obesity have risen to alarming levels. The estimated
prevalence rates among those aged 15 years and older range from 8% to 25% in
Germany, Italy, France, and UK (World Health Organization, 2011b). In USA,
prevalence rates have reached epidemic levels, with 50% of the population being obese
(World Health Organization, 2011b). Even in developing countries, the rates of obesity
are increasing (World Health Organization, 2011a).
The rising rates of obesity is a pressing concern, given the severe health
implications and substantial medical spending associated with obesity (Finkelstein,
Trogdon, Cohen, & Dietz, 2009). It is important to prevent this public health problem
from escalating further by developing primary interventions. To devise effective
2
interventions, the pathways influencing the development of obesity must first be
understood. For example, psychological pathways influencing body fat gain can be
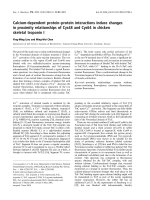
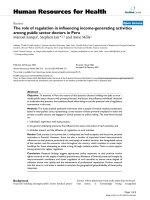
examined. As shown in Figure 1, this study investigates the effects of psychological
stress on body fat via the pathways of eating (energy intake) and exercise behaviors
(energy expenditure), among high restrained eaters (dieters) and low restrained eaters
(non-dieters). In other words, this study examines whether health behaviors that regulate
energy balance can explain stress-induced changes in body fat among high restrained
eaters and low restrained eaters (if such changes were observed). At the same time, the
study also examines if stress-induced changes in eating and exercise behaviors differed
across the two groups. The primary purpose is to delineate the psychological pathways
influencing body fat gain among high restrained eaters.
Eating behavior
(energy intake)
Restrained eating
Body fat
×
Psychological stress
Exercise behavior
(energy expenditure)
Figure 1. Psychological pathways of body fat investigated in this study.
1.2. Body Fat Gain: Who is at Risk and When?
Some people may be more prone to putting on weight than others. Restrained
eaters are one such group that has been identified as being particularly vulnerable (van
Strien, Engels, & van Staveren, 2006). Restrained eating, otherwise known as ―chronic
3
dieting‖, is the cognitive control of food intake to maintain or achieve an ideal body
weight (Herman & Polivy, 1980). This construct originated from interest in the etiology
of obesity (Greeno & Wing, 1994; Herman & Mack, 1975; Herman & Polivy, 1975).
Paradoxically, restrained eating may promote weight gain. It has been positively
associated with weight and body fat percentage in cross-sectional (Beiseigel & NickolsRichardson, 2004) and prospective studies (Drapeau et al., 2003; Lowe et al., 2006;
Vella-Zarb & Elgar, 2009). On the other hand, there are also studies showing no
significant relationships between restrained eating and obesity (de Lauzon-Guillain et al.,
2006; Hays et al., 2002).
The equivocal findings may point to a complex relationship between restrained
eating and obesity. Perhaps, restrained eaters are vulnerable to body fat gain only under
certain circumstances, such as during psychological stress. Both cross-sectional and
prospective studies have demonstrated positive links between stress-related factors such
as socioeconomic status and job strain with indicators of obesity such as body mass index
and waist-to-hip ratio (Economos, Hildebrandt, & Hyatt, 2008; Kouvonen, Kivimäki,
Cox, Cox, & Vahtera, 2005; Roberts, Troop, Connan, Treasure, & Campbell, 2007;
Rosmond & Björntorp, 1999; Rosmond, Lapidus, & Björntorp, 1996). Psychological
stress may increase the vulnerability of restrained eaters to body fat gain by disrupting
their health behaviors (Steptoe, 1991). For example, stress may promote overeating
among restrained eaters (Greeno & Wing, 1994) or it may cause a reduction in their
frequency of physical exercise (e.g., Ng & Jeffery, 2003). Given that previous studies
done on restrained eating and obesity have not considered the influence of stress, it might
4
be informative to examine changes in the body fat of restrained eaters across varying
stress levels.
1.3. Stress and Body Fat Gain: Eating Behavior as an Explanation
One psychological pathway affecting a restrained eater’s body fat during stress
could be stress-induced changes in eating behavior and a resultant increase in energy
intake. For example, stress has been associated with higher dietary fat intake (Ng &
Jeffery, 2003), a greater frequency of fast food consumption (Steptoe, Lipsey, & Wardle,
1998), a greater frequency of snacks consumption (Conner, Fitter, & Fletcher, 1999), and
increased energy intake (Michaud et al., 1990; Wardle, Steptoe, Oliver, & Lipsey, 2000).
Eating more when under psychological stress may promote greater weight gain (Epel et
al., 2004). This may be attributed to a positive energy balance that encourages body fat
accumulation (Nieuwenhuizen & Rutters, 2008).
1.3.1. Literature on stress-induced eating among restrained eaters
The phenomenon of stress-induced eating among restrained eaters has attracted
considerable attention from researchers. Much research has been done to test the
hypothesis that restrained eaters would eat more under stress than when not under stress
while unrestrained eaters would show minimal changes in their food intake. Such studies
have typically been done on female participants because larger proportions of restrained
eaters are found among female participants than male participants (Rand & Kuldau,
1991).
In an experimental study by Rutledge and Linden (1998), participants were first
exposed to stress from cognitive tasks and then presented with food. Restrained eaters
who experienced high negative affect ate more cookies and crackers than restrained
5
eaters who experienced low negative affect. In contrast, unrestrained eaters did not show
significant changes in the amount eaten as a function of negative affect. Other
experimental studies have also found comparable results (Heatherton, Herman, & Polivy,
1991; Polivy & Herman, 1999; Polivy, Herman, & McFarlane, 1994; Wallis &
Heatherington, 2004). On the other hand, there have also been studies that did not
uncover any stress-induced overeating among restrained eaters (Herman & Polivy, 1975;
Oliver, Wardle, & Gibson, 2000).
Apart from experimental studies, there have also been a few naturalistic studies
done to test the hypothesis. Such studies usually assess natural stressors such as
examinations and daily hassles and measure eating behavior using dietary recalls. Both
supporting (O'Connor, Jones, Conner, McMillan, & Ferguson, 2008; Wardle et al., 2000)
and contradictory evidence have been uncovered (Conner et al., 1999; Pollard, Steptoe,
Canaan, Davies, & Wardle, 1995).
To sum up, the prediction that restrained eaters will show disinhibited eating
behavior during stressful times has been supported by several studies. However, a
handful of studies have also shown contradictory evidence. Thus, the moderating role of
restrained eating in stress-induced food intake still warrants examination.
1.3.2. Stress-induced eating: Depleted self-regulatory resources as an
explanation
There are a few possible explanations for restrained eaters’ stress-induced
overeating. One is that restrained eaters eat more to cope with stress (Polivy et al., 1994).
Specifically, eating may help to reduce anxiety from the stressor (Kaplan & Kaplan,
1957), it may help to distract from the stressor (Polivy & Herman, 1999), or it may help
6
mask the actual, more uncontrollable source of the distress (Herman & Polivy, 1988).
However, studies testing these coping explanations have failed to find any convincing
support for them (Herman & Polivy, 1975; Polivy & Herman, 1999; Polivy et al., 1994).
Another explanation is that restrained eaters become especially sensitive to food-relevant
cues in the environment when they are distressed, which makes them susceptible to
overeating (Schachter, 1971; Slochower, 1976; Slochower & Kaplan, 1980). However,
there is also little empirical support for this explanation (Polivy et al., 1994).
On the other hand, the self-regulation literature offers a compelling explanation of
restrained eaters’ stress-induced overeating. Dieting is a behavior that entails selfregulation (Baumeister, Heatherton, & Tice, 1994; Schmeichel & Baumeister, 2004).
When a restrained eater is under stress, the exertion of resources to cope with the source
of the stress might impair the self-regulation of other activities such as eating behavior
(Baumeister & Heatherton, 1996; Baumeister et al., 1994). This may lead to overeating.
Self-regulation refers to the deliberate processes that bring about changes in a
person’s internal state or external behavior so that they are in line with the person’s goals
(Baumeister, Vohs, & Tice, 2007; Carver, 2001). The implementation of goal-directed
behavior involves the ―overriding‖ of impulses and habitual responses (Baumeister et al.,
1994, p. 7). For example, a person with the goal of being slim may suppress the impulses
to eat chocolates. This ―overriding‖ of impulses requires self-regulatory resources
(Baumeister et al., 1994).
People are not always successful in regulating themselves. For example, a person
with the goal of being slim may sometimes give in to temptations to eat chocolates or to
give excuses to not exercise. Baumeister and colleagues proposed that one possible cause
7
of self-regulation failure is the depletion of self-regulatory resources (Baumeister &
Heatherton, 1996; Baumeister et al., 1994; Baumeister et al., 2007). In such a situation,
the person becomes unable to control his or her impulses, leading to an inability to
regulate behavior. Muraven and Baumeister (2000) postulate that all self-regulation tasks
tap on the same pool of resources. In other words, using the resources to override
impulses to play so as to stay focused on studying will leave less available for controlling
one’s diet. Self-regulatory resources can also get depleted (Muraven & Baumeister,
2000). For example, after exerting self-regulation resources in studying, there may not be
enough resources left for initiating and persisting in exercise. When self-regulatory
resources get depleted, subsequent behaviors that require self-regulation will have a
greater chance of failure (Muraven & Baumeister, 2000). These assumptions have been
tested and confirmed in a number of studies (Muraven & Baumeister, 2000).
Coping with psychological stress may deplete a person’s self-regulatory resources
and lead to greater risks of failure in subsequent self-regulation tasks. Coping with stress
typically includes trying to override negative emotions and trying to stay focused on
dealing with the stressor (see review by Muraven & Baumeister, 2000). Therefore
someone who is stressed may suffer from depleted resources which might in turn cause
the regulation of other behaviors to fail more often. For example, a prospective study
found that stress from financial difficulties was associated with a higher probability of
smoking relapses (Siahpush & Carlin, 2006). Several other studies have also linked stress
with a breakdown of behaviors requiring self-regulation such as abstinence from
substance use (Hodgins, el-Guebaly, & Armstrong, 1995) and engagement in exercise
(Ng & Jeffery, 2003; Sonnentag & Jelden, 2009).
8
Dieting is a self-regulation task that utilizes self-regulatory resources because it
involves overriding impulses to eat fattening (but desirable) food (Baumeister et al.,
1994; Schmeichel & Baumeister, 2004). Therefore, it is likely that dieters would show
disinhibited eating under conditions of stress during which self-regulatory resources are
in short supply (Kahan, Polivy, & Herman, 2003; Vohs & Heatherton, 2000). Findings
from studies done on the moderating effect of restrained eating on stress-induced eating
actually mirror findings from the self-regulation literature (e.g., O'Connor et al., 2008;
Polivy et al., 1994; Wallis & Heatherington, 2004), suggesting that depleted selfregulatory resources may be at work.
In summary, the existing literature points to the depletion of self-regulatory
resources as the most likely explanation for restrained eaters’ tendency to overeat under
stress. The tendency to overeat may in turn account for restrained eaters’ body fat gain
under stress.
1.4. Stress and Body Fat Gain: Exercise Behavior as an Explanation
Another psychological pathway that might account for the body fat gain of
restrained eaters under stress is a reduction in physical exercise. Apart from increasing
energy intake, psychological stress may affect the body fat of restrained eaters by
simultaneously reducing energy expenditure via physical exercise. This may result in an
overall energy surplus that can contribute to body fat gain (Tremblay & Therrien, 2006).
Studies have found that high stress predicted lower frequency of exercise (Ng & Jeffery,
2003; Rosmond & Björntorp, 1999; Steptoe, Wardle, Pollard, Canaan, & Davies, 1996)
and poorer adherence to an exercise program (Oman & King, 2000).
9
1.4.1. Rationale for examining exercise behavior: A new research area
Investigating stress-induced changes in exercise behavior as a function of
restrained eating not only allows a potential psychological pathway of stress-induced
body fat gain to be examined, it also allows a new research area to be explored. Although
there is an accumulated literature on the role of restrained eating as a moderator in stressinduced eating, no studies have examined the moderating influence of restrained eating in
the relationship between stress and exercise behavior.
Exercise behavior does not appear to be immediately relevant to the construct of
restrained eating. But it is likely that restrained eaters will be concerned about having
sufficient amounts of exercise on top of dieting, given their goal of maintaining or
achieving an ideal body weight (Herman & Polivy, 1980). In fact, there is preliminary
evidence showing that restrained eaters exercise more as compared to unrestrained eaters
(McLean & Barr, 2003; Mclean, Barr, & Prior, 2001), suggesting that exercise may also
be used as a weight control strategy.
Apart from being another weight control strategy, exercise is also a behavior that
taps into the limited self-regulatory resources of a restrained eater. Resources are needed
to initiate exercise against impulses to do other more pleasurable leisure activities and to
persist in exercise against impulses to rest (Baumeister et al., 1994; Sonnentag & Jelden,
2009). Evidence showing that exercise requires self-regulatory resources comes from
Sonnentag and Jelden (2009), who found that a reduction in self-regulatory resources
predicted less time spent in sports activities.
Under the conditions of stress and a consequent depletion of self-regulatory
resources, the frequency of exercise behavior may decrease. If high restrained eaters’
10
resources were depleted by both stress and dieting, exercise levels may decrease by a
significant extent. This study is interested to examine how stress-induced changes in
exercise behavior may differ across high restrained eaters and low restrained eaters.
1.5. Aims and Hypotheses
The current study investigates stress-induced changes in the eating and exercising
behaviors of high restrained eaters and low restrained eaters and how these changes may
influence the body fat of these individuals. Female undergraduates were measured over
three time points corresponding to the low stress baseline, high stress pre-examination,
and low stress recovery.
1.5.1. Aims
The primary aim is to investigate the psychological pathways influencing body fat
gain among high restrained eaters, a group that is vulnerable to obesity. A secondary aim
is to examine whether high restrained eaters would show an increase in energy intake
during stressful times to replicate past studies done on stress-induced eating. Another
secondary aim is to examine whether high restrained eaters and low restrained eaters
differed in the pattern of changes in exercise behavior across varying stress levels.
1.5.2. Hypotheses for energy intake
High restrained eaters are hypothesized to increase their energy intake during the
high stress pre-examination period compared to the low stress baseline. Energy intake is
expected to decrease during the low stress recovery period. In other words, an inverted-U
quadratic trend is predicted for high restrained eaters’ energy intake. During the high
stress period, self-regulatory resources are likely to be directed to the higher priority tasks
of emotional regulation (Tice, 2009) and studying, reducing their availability for other
11
behaviors like dieting and exercising. Therefore, the depleted supply of self-regulatory
resources may increase the likelihood of disinhibited eating (Kahan et al., 2003; Vohs &
Heatherton, 2000).
In contrast, low restrained eaters are not expected to show changes in energy
intake across the three stress levels. Since their eating behavior is not subjected to the
same demands of self-regulation experienced by the high restrained eaters, their energy
intake is unlikely to be affected by stress and the availability of self-regulatory resources
(Muraven & Baumeister, 2000).
1.5.3. Hypotheses for exercise behavior
Hypotheses regarding the differential effects of stress on high and low restrained
eaters’ exercise levels are more speculative, in view of the paucity of theories and
research in this area. Similar to dieting, the exercise behavior of high restrained eaters is
likely to demand self-regulatory resources. Therefore, high restrained eaters’ exercise
levels during the high stress period are expected to show a drop from baseline levels due
to the depletion of resources. Exercise levels are expected to increase during the low
stress recovery period.
Unlike the high restrained eaters, low restrained eaters may be less likely to use
exercise behavior as a weight control strategy. Therefore, it is possible that this would not
demand as much self-regulatory resources as the goal-directed exercise behavior of high
restrained eaters. On this basis, low restrained eaters are not expected to show significant
changes in their exercise behavior across varying stress levels. This is in line with
Muraven and Baumeister’s (2000) postulation that behaviors that do not require much
self-regulatory resources will not be affected by a depletion of resources.
12
1.5.4. Hypotheses for body fat
Based on the predictions that high restrained eaters would show an increase in
energy intake and a decrease in energy expenditure when under stress, they are expected
to demonstrate an increase in body fat between the baseline and high stress preexamination period. Body fat is expected to decrease during low stress recovery in
response to lower levels of energy intake and higher levels of energy expenditure. For
low restrained eaters, the hypothesized consistency of their energy intake and energy
expenditure across varying stress levels is expected to translate into minimal body fat
changes.
13
Chapter 2
Method
2.1. Participants
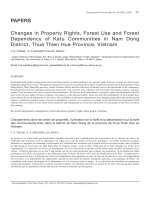
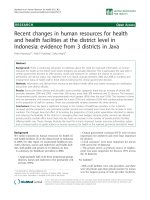
The detailed recruitment process is represented by Figure 2. Prior to the study,
305 Chinese female first year undergraduates from the National University of Singapore
completed the Dutch Eating Behavior Questionnaire Restrained Eating subscale (DEBQR; van Strien, Frijters, Bergers, & Defares, 1986) and the Beck Depression Inventory
(BDI; Beck, Rush, Shaw, & Emery, 1979). Only female students of Chinese ethnicity
were sampled because of considerations of ethnic differences in diet. One hundred and
fourteen participants (37.38 %) were identified as scoring one standard deviation above
or one standard deviation below the mean on the DEBQ-R (M = 2.45, SD = 0.83). Of
these participants, those who have indicated that they were vegetarians or were on special
diets were excluded. Those with scores of 16 and above on the BDI, which indicated that
they had moderate and severe depression symptoms (Beck, Ward, Mendelson, Mock, &
Erbaugh, 1961), were also excluded. The remaining participants were contacted by phone
and screened for other physical or psychological conditions that might affect their eating
behavior, exercise behavior, and body fat. Specifically, they were asked if they had
conditions such as eating disorders, endocrine disorders, and metabolic disorders. Those
without these conditions were invited to a briefing. Five participants were ineligible for
the briefing because they were either on steroid medication or had gum disease. These
two exclusion criteria are for another study’s procedure of saliva sampling to perform
cortisol analyses.
14
305 completed
DEBQ-R and BDI
114 met criteria for
DEBQ-R
10 non-contactable
25 refused screening
96 to be contacted
for phone screening
86 contacted
61 screened
6 declined participation
4 vegetarians/on special diets
14 scored 16 and above on BDI
3 on steroid medication
2 with gum disease
56 eligible and
attended briefing
50 recruited
48 in final sample
42% of those who
met DEBQ-R
criteria
1 dropped out of study
1 with missing data
Figure 2. Responses throughout recruitment process.
Out of 56 potential participants who attended the briefing, 50 Chinese female
undergraduates participated in this study for course credits. One participant had dropped
out of the study and was excluded from data analyses. Another participant had missing
data and was also excluded. Both were low restrained eaters. The remaining 48
participants had a mean age of 19.19 years (SD = 0.67) and a mean BMI of 20.74 kg/m2
(SD = 3.25). Half of the participants were categorized as high restrained eaters and the
other half were categorized as low restrained eaters. The mean age of high restrained
15
eaters was 19.13 years (SD = 0.45) and the mean age of low restrained eaters was 19.25
years (SD = 0.85). High restrained eaters had a restrained eating score of 3.83 (SD =
0.37) while low restrained eaters had a restrained eating score of 1.34 (SD = 0.18). As
seen from Table 1, the sample’s BF% was in the ―below average‖ health category,
according to the recommendations for females between 20 to 29 years old (American
College of Sports Medicine, 2008; p. 59). The energy intake of participants appears to be
below the daily recommendation of 2,000 kcal for adults (Health Promotion Board,
2010). One sample t-tests showed that high restrained eaters’ energy intake at each of the
three time points was significantly lower than 2,000 kcal, t(23) = -3.58, p = .002; t(23) = 9.12, p < .001; t(23) = -6.96, p < .001 respectively. For low restrained eaters, energy
intake at the first two time points did not differ from 2,000 kcal, t(23) = -1.18, p = .251
and t(23) = -1.43; p = .166 respectively, while energy intake at the last time point was
significantly different from 2,000 kcal, t(23) = -2.96; p = .007.
16
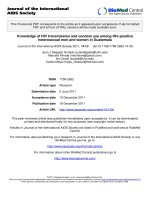
Table 1
Means and Standard Deviations of Dependent Variables for Total Sample and by
Restrained Eating and Time (N = 48)
Total
High restrained eaters
Low restrained eaters
Time 0a
Time 1b
Time 2c
Time 0
Time 1
Time 2
M (SD)
M (SD)
M (SD)
M (SD)
M (SD)
M (SD)
32.44
(3.73)
33.00
(3.81)
32.31
(3.88)
29.18
(3.69)
29.33
(3.72)
29.73
(3.81)
Energy
1636.74 1652.06
intake
(400.95) (476.41)
(kcal/day)
1443.06
(299.16)
1400.39
(422.21)
1854.92
(603.85)
1786.58
(730.94)
1683.42
(523.93)
Weekly
exercise
20.83
(15.76)
31.04
(24.48)
29.42
(21.60)
30.92
(22.71)
32.08
(22.02)
Variable
M (SD)
BF%
31.00
(4.02)
28.53
(19.95)
26.92
(21.10)
Note. BF% = body fat percentage. aBaseline. bPre-examination. cRecovery.
2.2. Measures
2.2.1. Beck Depression Inventory (BDI)
The BDI (Beck et al., 1979) was used to identify and exclude participants with
moderate and severe depression symptoms. In each of the 21 items, participants selected
one statement out of four (e.g., ―I do not feel sad‖, ―I feel sad‖, ―I am sad all the time and
I can’t snap out of it‖, ―I am so sad and unhappy that I can’t stand it‖) that best described
how they felt in the past one week. Each statement corresponds to a score ranging from 0
to 3. Studies have shown that the scale possesses good reliability and validity in
nonclinical populations (Beck & Speer, 1988; Lightfoot & Oliver, 1985). Cronbach’s
alpha for this sample was .86. The scores corresponding to each selected statement were
summed up to reflect the severity of depression symptoms.
17
2.2.2. Dutch Eating Behavior Questionnaire Restrained Eating scale (DEBQR)
The DEBQ-R (van Strien et al., 1986) was administered to identify participants
who were high or low in restrained eating. In each of the 10 items, participants rated how
frequently they exhibited a restrained eating habit on a scale extending 1 (never), 2
(seldom), 3 (sometimes), 4 (often), 5 (very often). One example of an item is ―do you try
to eat less at mealtimes than you would like to eat?‖ The scale had a Cronbach’s alpha of
.91. Previous studies have demonstrated its adequate reliability and validity (Laessle,
Reinhard, Kotthaus, & Pirke, 1989; van Strien et al., 1986). Participants’ scores on the
DEBQ-R items were averaged and used as an index of restrained eating.
2.2.3. Perceived Stress Scale (PSS)
The 10-item PSS measures the overall level of stress respondents experienced
with reference to the last one month (Cohen, Kamarck, & Mermelstein, 1983). In this
study, the time frame was modified to one week. Participants rated how frequently they
felt that things were out of control, unpredictable, and overwhelming on a scale ranging 0
(never), 1 (almost never), 2 (sometimes), 3 (fairly often), 4 (very often). For example, one
item asks ―in the last week, how often have you found that you could not cope with all
the things that you had to do?‖ Cronbach’s alpha of the scale ranged from .82 to .87
across repeated assessments and averaged .85. The PSS has been shown to have good
reliability and validity (Cohen et al., 1983). The level of perceived stress was quantified
by taking the sum of the PSS items.
18
2.2.4. Three-day food diary
The food diary gathered participants’ dietary information over two weekdays and
one weekend day to estimate the amount of energy intake. This assessment was
developed by Low (2009) for the GUSTO birth cohort study. An experimenter went
through a briefing session with each participant to train her on how to make accurate
dietary records. Participants had to write down (a) the name of food or drink consumed,
(b) other details that were relevant (e.g., part of meat, type of vegetable, type of cooking
method, brand name of packaged food products), and (c) the amount eaten. The food
diary contains guidelines on making proper dietary records. There are also photographs
of standard servings of food and household measurements which participants used to
estimate the amounts of food and drinks they had consumed. This method of dietary
assessment has been considered to be the gold standard (Thompson & Subar, 2001).
The food diary records were analyzed using the computer program Food Intake
Assessment to determine the amount of energy intake averaged across the three days.
This program was developed by the National University of Singapore’s Centre for
Molecular Epidemiology (2010) and comprises data from various sources such as
laboratory analysis of local food and overseas databases e.g., USDA National Nutrient
Database for Standard Reference.
2.2.5. Godin’s Leisure Time Exercise Questionnaire (GLTEQ)
The GLTEQ (Godin & Shephard, 1985) was used as an index of participants’
level of weekly exercise. Participants responded to three questions asking them how
many times they engaged in strenuous (e.g., running), moderate (e.g., fast walking), and
mild exercise (e.g., easy walking) for at least 15 minutes in the previous one week. The