Principal component analysis on chemical abundances spaces
Bạn đang xem bản rút gọn của tài liệu. Xem và tải ngay bản đầy đủ của tài liệu tại đây (1.5 MB, 84 trang )
Principal Component Analysis on Chemical
Abundances Spaces
Ting Yuan Sen
A thesis submitted for the degree of
Master of Science in Physics of
National University of Singapore
February, 2012
ii
Declaration
This thesis is an account of research undertaken between April 2011 and December 2011
at Research School of Astrophysics and Astronomy, The Australian National University,
Canberra, Australia.
The material in this thesis was published as an article for which I am the leading
author to the Monthly Notice of the Royal Astronomical Society (2012, MNRAS, 421,
1231). The article was accepted for publication on the 14 December 2011 and was first
published online on the 13 February 2012 (DOI: 10.1111/j.1365-2966.2011.20387.x).
The publisher of the journal has been informed and agreed on the usage of all or part of
the article and abstract in this thesis.
Except where acknowledged in the customary manner, the material presented in this
thesis is, to the best of my knowledge, original and has not been submitted in whole or
part for a degree in any university.
Ting Yuan Sen
February, 2012
iii
iv
Acknowledgements
I am truly grateful to Ken Freeman at the Australian National University for his supervision throughout this project. Ken has been very kind to me both in research and personal
life. In term of research, it is truly a great honor to work with such an eminent professor
and the leading expert of his area. His advices, immense knowledge and experience have
been invaluable to me and made my Master experience the most fulfilling. He also trusted
me and gave me enormous opportunities to learn various life-changing techniques, such as
observing experience at the Siding Spring Observatory that I had always dreamed about!
Ken also allowed me to meet with astronomers at the Australian Astronomical Observatory and University of Sydney in Sydney, and to interact with them. In term of personal
life, he gave me very much needed advices for my future. I also experienced my first ever
Christmas lunch with him and his family. That was definitely the highlight of the year! I
truly enjoy every moment working with him.
The project would not be possible without the help from researchers at the Australian
National University. I would like to thank Martin Asplund for verifying of my manuscript,
Chiaki Kobayashi, Amanda Karakas, Richard Stancliffe, David Yong, Peter Wood, John
Norris for giving up their time for discussion and all the exciting brainstorming morning
tea sessions. I would also like to thank Christophe Pichon, Piercarlo Bonifacio from Paris,
Joss Bland-Hawthorn, Gayandhi de Silva and Sanjib Sharma from Sydney, Anna Frebel
from MIT for providing me ingenious solutions to all the conundrums that I faced during
this project. I am also grateful to Ricardo Carrera, Elena Pancino from Spain and Jon
Fulbright from John Hopkins University for making their study samples available for this
project.
I would also like to thank Emma Kirby and Paul Francis for providing me chances
to learn and to perform public outreach and interact with school students. I would also
like to thank Geoffrey Bicknell, Harvey Butcher, the College of Physical and Mathematical
Science and the Research School of Astronomy and Astrophysics at the Australian National
University for their financial support throughout this project. I am also grateful to my
local supervisor Phil Chan Aik Hui, Kiri Robbie and Karen Nulty for going through all
the administrative procedures and making this trip possible.
To my friends at Mount Stromlo: Jundan Nie, George Zhou, Devika Kamath, Luke
Shingle, Fr´ederic Vogt, thank you for all the movie nights, and putting up with me while I
felt sleep watching your favorite A Midsummer Night’s Dream. Thank you for making me
at home during these 8 months at the Australian National University, and making my time
at Mount Stromlo so enjoyable. Special thank to Jundan for driving me to supermarket
and meet the civilization every week. Special thank to George for all the stargazing nights,
and tirelessly introducing Taylor Swift’s songs.
Mum and Dad, thank you for everything. I cannot imagine where I would be without
all your support and love.
v
vi
Abstract
In preparation for the High Efficiency and Resolution Multi-Element Spectrograph (HERMES) chemical tagging survey of about a million Galactic FGK stars, we estimate the
number of independent dimensions of the space defined by the stellar chemical element
abundances [X/Fe]. This leads to a way to study the origin of elements from observed
chemical abundances using principal component analysis. We explore abundances in several environments, including solar neighbourhood thin/thick disc stars, halo metal-poor
stars, globular clusters, open clusters, the Large Magellanic Cloud and the Fornax dwarf
spheroidal galaxy. By studying solar-neighbourhood stars, we confirm the universality
of the r-process that tends to produce [neutron-capture elements/Fe] in a constant ratio. We find that, especially at low metallicity, the production of r-process elements is
likely to be associated with the production of α-elements. This may support the corecollapse supernovae as the r-process site. We also verify the overabundances of light
s-process elements at low metallicity, and find that the relative contribution decreases at
higher metallicity, which suggests that this lighter elements primary process may be associated with massive stars. We also verify the contribution from the s-process in low-mass
asymptotic giant branch (AGB) stars at high metallicity. Our analysis reveals two types
of core-collapse supernovae: one produces mainly α-elements, the other produces both
α-elements and Fe-peak elements with a large enhancement of heavy Fe-peak elements
which may be the contribution from hypernovae. Excluding light elements that may be
subject to internal mixing, K and Cu, we find that the [X/Fe] chemical abundance space
in the solar neighbourhood has about six independent dimensions both at low metallicity
(−3.5 [Fe/H] −2) and high metallicity ([Fe/H] −1). However the dimensions come
from very different origins in these two cases. The extra contribution from low-mass AGB
stars at high metallicity compensates the dimension loss due to the homogenization of the
core-collapse supernovae ejecta. Including the extra dimensions from [Fe/H], K, Cu and
the light elements, the number of independent dimensions of the [X/Fe]+[Fe/H] chemical
space in the solar neighbourhood for HERMES is about eight to nine. Comparing fainter
galaxies and the solar neighbourhood, we find that the chemical space for fainter galaxies such as Fornax and the Large Magellanic Cloud has a higher dimensionality. This is
consistent with the slower star formation history of fainter galaxies. We find that open
clusters have more chemical space dimensions than the nearby metal-rich field stars. This
suggests that a survey of stars in a larger Galactic volume than the solar neighbourhood
may show about one more dimension in its chemical abundance space.
vii
viii
Contents
Declaration
iii
Acknowledgements
v
Abstract
vii
1 Introduction
15
2 Chemical evolution processes
17
3 Data selection
3.1 Low metallicity . . . . . . . .
3.2 Intermediate, high metallicity
3.3 Dwarf galaxies . . . . . . . .
3.4 Globular and open clusters .
.
.
.
.
21
21
22
22
23
.
.
.
.
.
27
27
27
30
31
32
.
.
.
.
.
35
35
42
45
47
52
.
.
.
.
.
.
.
.
.
.
55
55
55
55
56
56
57
57
63
64
64
.
.
.
.
.
.
.
.
.
.
.
.
.
.
.
.
.
.
.
.
.
.
.
.
.
.
.
.
.
.
.
.
.
.
.
.
.
.
.
.
.
.
.
.
.
.
.
.
.
.
.
.
4 Analysis method
4.1 PCA . . . . . . . . . . . . . . . . . . . . . . . . . . .
4.1.1 Toy models . . . . . . . . . . . . . . . . . . .
4.1.2 Dealing with incomplete data sets . . . . . .
4.1.3 Best cut-off for ranked-eigenvalues cumulative
4.2 Estimate of intrinsic correlation . . . . . . . . . . . .
5 Analysis results
5.1 Low-metallicity stars .
5.2 High-metallicity stars
5.3 Open clusters . . . . .
5.4 Satellite galaxies . . .
5.5 Globular clusters . . .
.
.
.
.
.
.
.
.
.
.
.
.
.
.
.
.
.
.
.
.
.
.
.
.
.
.
.
.
.
.
.
.
.
.
.
.
.
.
.
.
.
.
.
.
.
.
.
.
.
.
.
.
.
.
.
.
.
.
.
.
6 Discussion
6.1 The n-capture elements subspace . . . . . .
6.1.1 The r-process contribution . . . . .
6.1.2 The overabundance of light s-process
6.1.3 Low-mass AGB contribution . . . .
6.2 Satellite galaxies . . . . . . . . . . . . . . .
6.3 All elements . . . . . . . . . . . . . . . . . .
6.3.1 Low metallicity . . . . . . . . . . . .
6.3.2 High metallicity . . . . . . . . . . .
6.4 Wider region of survey . . . . . . . . . . . .
6.5 K and Cu; APOGEE; the Ca-triplet region
7 Conclusion
.
.
.
.
.
.
.
.
.
.
.
.
.
.
.
.
.
.
.
.
.
.
.
.
.
.
.
.
.
.
.
.
.
.
.
.
.
.
.
.
.
.
.
.
.
.
.
.
.
.
.
.
.
. . . . . . .
. . . . . . .
. . . . . . .
percentages
. . . . . . .
.
.
.
.
.
. . . . . .
. . . . . .
elements
. . . . . .
. . . . . .
. . . . . .
. . . . . .
. . . . . .
. . . . . .
. . . . . .
.
.
.
.
.
.
.
.
.
.
.
.
.
.
.
.
.
.
.
.
.
.
.
.
.
.
.
.
.
.
.
.
.
.
.
.
.
.
.
.
.
.
.
.
.
.
.
.
.
.
.
.
.
.
.
.
.
.
.
.
.
.
.
.
.
.
.
.
.
.
.
.
.
.
.
.
.
.
.
.
.
.
.
.
.
.
.
.
.
.
.
.
.
.
.
.
.
.
.
.
.
.
.
.
.
.
.
.
.
.
.
.
.
.
.
.
.
.
.
.
.
.
.
.
.
.
.
.
.
.
.
.
.
.
.
.
.
.
.
.
.
.
.
.
.
.
.
.
.
.
.
.
.
.
.
.
.
.
.
.
.
.
.
.
.
.
.
.
.
.
.
.
.
.
.
.
.
.
.
.
.
.
.
.
.
.
.
.
.
.
.
.
.
.
.
.
.
.
.
.
.
.
.
.
.
.
.
.
.
.
67
ix
x
Contents
A Principal Component Analysis
69
B Incomplete data set
71
C Weighted total least square
73
List of Figures
3.1
Metallicity distributions of adopted samples . . . . . . . . . . . . . . . . . . 24
4.1
4.2
4.3
Toy model to illustrate principal component analysis, case γ = 1 . . . . . . 28
Toy model to illustrate principal component analysis, case γ = 2 . . . . . . 29
Illustration of the intrinsic scatter search . . . . . . . . . . . . . . . . . . . . 33
5.1
5.2
5.3
5.4
5.5
5.6
5.7
5.8
5.9
5.10
5.11
5.12
5.13
5.14
5.15
5.16
5.17
Eigenvalues cumulative percentages of n-capture elements: low metallicity .
Principal components of n-capture elements: low metallicity . . . . . . . . .
[Y/Ba]–[Fe/H] for the Milky Way halo/disc stars . . . . . . . . . . . . . . .
Principal components of all elements: low metallicity (Al corrected) . . . .
Eigenvalues cumulative percentages of all elements: low metallicity . . . . .
Principal components of all elements: low metallicity (Al not corrected) . .
Principal components of n-capture elements: high metallicity . . . . . . . .
Eigenvalues cumulative percentages of n-capture elements: high metallicity
Principal components of all elements: high metallicity . . . . . . . . . . . .
Eigenvalues cumulative percentages of all elements: high metallicity . . . .
Eigenvalues cumulative percentages of α-elements: open clusters . . . . . .
Eigenvalues cumulative percentages of all elements: open clusters . . . . . .
Eigenvalues cumulative percentages of n-capture elements: dwarf galaxies .
Principal components of n-capture elements: dwarf galaxies . . . . . . . . .
Eigenvalues cumulative percentages of α-elements: dwarf galaxies . . . . . .
Eigenvalues cumulative percentages of all elements: dwarf galaxies . . . . .
Eigenvalues cumulative percentages of α-, n-capture, all elements: globular
clusters . . . . . . . . . . . . . . . . . . . . . . . . . . . . . . . . . . . . . .
53
[hs/Fe]–[Fe/H] for the solar neighbourhood, Fornax and the LMC stars . . .
[ls/Fe]–[Fe/H] for the solar neighbourhood, Fornax and the LMC stars . . .
[Y/Ba]–[Fe/H] for the solar neighbourhood, CEMP-s and dwarf galaxies stars
Illustration of the odd-even-Z effect . . . . . . . . . . . . . . . . . . . . . . .
58
59
60
62
6.1
6.2
6.3
6.4
xi
35
37
38
39
40
41
43
43
44
45
46
47
48
49
50
51
xii
LIST OF FIGURES
List of Tables
3.1
Summary of adopted samples . . . . . . . . . . . . . . . . . . . . . . . . . . 25
5.1
Fraction of LEPP contribution in different metallicity . . . . . . . . . . . . 38
6.1
Summary of effective dimensions in various environments and C-subspace.
xiii
66
14
LIST OF TABLES
Chapter 1
Introduction
Stars are believed to form in aggregates which are mostly short-lived. The aggregates
are disrupted through the action of mass loss from stellar evolution, two-body effects and
the tidal field of the Galaxy (e.g. Chernoff & Weinberg 1990; Odenkirchen et al. 2003).
After the aggregates dissolve, their debris disperses and after several Galactic rotation
periods, they become mixed throughout an annular region around the Galaxy. In this
way, the stellar disc was gradually built up. The goal of chemical tagging is to use element
abundances to reconstruct these ancient clusters in which the stars were born (Freeman &
Bland-Hawthorn 2002). Individual clusters are observed to be chemically homogeneous,
at least in elements heavier than Na (e.g. De Silva et al. 2006; Mikolaitis et al. 2010, 2011).
Stars that were born in the same cluster and have now dispersed will have similar element
abundance patterns, reflecting the chemical evolution of the gas from which they formed.
This gas had its own history of pollution, by ejecta from core-collapse supernovae, Type
Ia supernovae (SNe Ia) and asymptotic giant branch (AGB) stars.
Chemical space (C-space) is a space defined by the abundances of the chemical elements that we are able to measure. Finding the debris from long-dispersed clusters using
chemical tagging is an exercise in group finding, in this multidimensional C-space. For
stars which formed in clusters within the Milky Way (MW), chemical tagging appears
relatively straightforward. The stars were born in chemically homogeneous clusters and
the detailed abundance pattern changes from cluster to cluster. The debris from a single star cluster will be tightly clustered in chemical space. Stars can also come into the
Galaxy in small accreted galaxies; their stars are again disrupted by the Galactic tidal
field and disperse. If these small galaxies are like the dwarf spheroidal galaxies (dSph)
and ultrafaint galaxies now found around the Milky Way, they would not have been be
chemically homogeneous (Tolstoy, Hill & Tosi 2009). Their broad and different element
abundance patterns are defined by their individual star formation histories (SFH) and are
unlike those of the Galactic disc. The debris of such accreted galaxies would not lie in a
tight clump but in a streak through C-space, and the streak reflects the element abundance
pattern in the parent dwarf.
To make a significant recovery of the dispersed aggregates, simulations show that a
large sample of stars, of order one million, is needed (Bland-Hawthorn & Freeman 2004).
The Galactic Archaeology with HERMES (GALAH) survey, using the High Efficiency and
Resolution Multi-Element Spectrograph (HERMES) instrument on the Anglo-Australian
Telescope, is designed to do such a chemical tagging study. It will measure abundances of
about 25 elements using multi-object high resolution (R = 28 000) spectroscopy of about
a million stars. Its C-space will have about 25 dimensions but the abundances of these 25
elements do not all vary independently. The abundances of some elements are correlated
because of the underlying nucleosynthetic processes, and the effective dimensionality of
15
16
Introduction
the C-space will be less than 25. Based on the existence of the various element groups
[light, light odd-Z, α, Fe-peak, light and heavy slow (s-) process (ls and hs) and mostly
rapid (r-) process] represented in the HERMES spectra, and from various abundance
patterns observed in field and cluster stars, we think that the dimensionality of the Cspace will be about seven to nine. The higher the dimensionality of C-space, the more
power chemical tagging will have to identify the debris of the disrupted systems. We
would like to determine the dimensionality of C-space more rigorously, and that is one of
the main purposes of this project.
It seems likely that the dimensionality of C-space will depend on the metallicity1 of the
stars defining the C-space. For example, stars of low metallicity may have formed within a
brief period of time and the gas from which they formed may have been enriched by only
a few supernovae events (Audouze & Silk 1995). Among the neutron-capture (n-capture)
elements, there would not have been time for the AGB stars to provide enrichment of
s-process elements, so the r-process may dominate the chemical evolution. On the other
hand, the more metal-rich stars may have had a long history of chemical evolution with
more than one process contributing to the n-capture element abundances.
We will use Principal Component Analysis (PCA) to determine the dimensionality of
C-space for various samples of stars, including field stars in different metallicity intervals,
star clusters and stars in the Fornax dSph galaxy and the Large Magellanic Cloud (LMC).
This is because the components will be different in the different situations. We will attempt
to interpret the principal components in terms relating to the nucleosynthesis processes
and hopefully gain some insight into the dominant processes in each situation.
This thesis is organized as follows: Chapter 2 gives a brief discussion of some related
aspects of chemical evolution processes and sites. In Chapter 3, we give details on the
samples that we chose to study. In Chapter 4, we will describe the PCA method and a
way to estimate intrinsic correlation using Monte Carlo simulations. In Chapter 5, we will
present the results of PCA analysis and then in Chapter 6, we will interpret the results
and discuss their origins. We summarize our main conclusions in Chapter 7.
1
We assume that the iron abundance [Fe/H] is a pertinent tracer of the metallicity in this paper.
Chapter 2
Chemical evolution processes
Stellar element abundance studies are usually presented in terms of [X/Fe]–[Fe/H]1 diagrams. These illustrate many basic element behaviour patterns, such as decreasing trend
of [α/Fe] toward higher [Fe/H] which is usually attributed to the increasing contribution of
SNe Ia to the chemical evolution at later times. These two-dimensional plots do not readily reveal the interplay between different families of elements during the different stages of
chemical evolution. This interplay is of particular interest to us in trying to determine the
dimensionality of C-space. As chemical evolution proceeds, different groups of elements
evolve together and define individual dimensions of the C-space. We seek an approach that
is able to display these groups of elements using PCA, and we will present PCA here. This
will hopefully benefit the analysis of elemental abundances that will be obtained soon for
large samples of stars with high-resolution multi-object surveys such as the Apache Point
Observatory Galactic Evolution Experiment (APOGEE)(Allende Prieto et al. 2008), the
HERMES and the ESO-Gaia Very Large Telescope (VLT) survey. First we briefly discuss
the major production sites for different families of elements.
α-elements such as O, Ne, Mg, Si, S, and Ca are mainly produced by core-collapse supernovae (i.e. Type II, Ib and Ic supernovae), while Fe-peak elements such as Cr, Mn, Ni,
and Fe are mainly produced by SNe Ia. Although the progenitor models are still debated,
the onset delay for these SNe is in a range of 0.1–2Gyr after star formation begins (see
model from Kobayashi & Nomoto 2009) . Observations show complications such as overabundances of heavy Fe-peak elements, such as Zn and Co, at low metallicity (McWilliam
et al. 1995; Ryan, Norris & Beers 1996; Norris, Ryan & Beers 2001; Cayrel et al. 2004;
Chen, Nissen & Zhao 2004). These cannot be understood from core-collapse supernovae
models with explosion energy of about 1051 erg. Umeda & Nomoto (2002, 2005) showed
that more energetic supernovae (hypernovae) are responsible for the overabundances of Zn
and Co. This is supported by Chieffi & Limongi (2002). Heger & Woosley (2010) argued
that overabundances of Zn can be explained without involving hypernovae. However, Izutani & Umeda (2010) showed that it is necessary to include hypernovae in order to explain
both Co and Zn observations.
N-capture elements (A
65) can provide independent probes for Galactic chemical
evolution. There is not yet a consistent scenario to explain all observations of n-capture
elements. Physically, the n-capture processes are divided into s- and r-processes. In the
r-process the neutron flux is intense and the time-scale of n-capture is much shorter than
that of the β-decay. This causes the seed nucleus to grab many neutrons before it β-decays
to the valley of stability. The observed abundance patterns of r-process elements show
1
By definition, [X/Y] ≡ log10 (NX /NY )star − log10 (NX /NY )⊙ , where NX and NY are the abundances of
elements X and element Y, respectively.
17
18
Chemical evolution processes
very small star-to-star variation, and are in excellent agreement with the scaled solar rprocess curve, at least for elements 56 < Z < 72 (e.g. Sneden et al. 1996; Westin et al.
2000; Cowan et al. 2002, 2005; Hill et al. 2002). This suggests the universality of the
r-process nucleosynthesis. However, the site(s) of the r-process remain uncertain. The
requirements on the physical conditions are neutron rich (i.e. low electron fraction Ye ),
high entropy and short dynamic time-scales (Wanajo & Ishimaru 2006); but see caveat
from Freiburghaus et al. (1999a). A possible site is the neutrino-driven neutron-wind
during the formation of neutron stars in core-collapse supernovae (e.g. Woosley et al.
1994). Various scenarios of this possibility have been studied, including association with
low-mass supernovae (e.g. Wanajo et al. 2009) or massive supernovae (Truran et al. 2002;
Wanajo & Ishimaru 2006), such as the ν-driven He-shell mechanism (Banerjee, Haxton &
Qian 2011). Another alternative site is neutron star mergers (Freiburghaus, Rosswog &
Thielemann 1999b; Rosswog et al. 1999). It has been argued that the stringent mass range
might be responsible for the large scatter that has been observed for n-capture elements
(Wanajo & Ishimaru 2006). The homogenizing effect of n-capture element evolution is
less apparent than for the α-elements that are produced by the whole mass range of corecollapse supernovae.
In contrast, for the s-process, the neutron flux is not so intense and the n-capture
rate is comparable to the β-decay rate. The major sites for the s-process are believed to
be low-mass (1.5–3 M⊙ ) AGB stars (for a review, see Busso, Gallino & Wasserburg 1999;
Herwig 2005; K¨
appeler et al. 2011) with the input of the 13 C pocket (Iben & Renzini 1982;
Hollowell & Iben 1988). However, the progenitor mass range, metallicity dependency and
the impact of rotation (Langer et al. 1999; Meynet & Maeder 2002) are still uncertain. In
the s-process, the major proposed neutron sources are from 13 C(α, n)16 O (e.g. K¨
appeler
et al. 1990; Stancliffe & Jeffery 2007; Cristallo et al. 2009). More massive stars (> 4 M⊙ )
achieve higher temperatures and another neutron source 22 Ne(α, n)25 Mg could be dominant (Iben 1975; Truran & Iben 1977). Stars in the mass range of 8–12 M⊙ might evolve
into super AGB phase (Siess 2006, 2007, 2010). However, the s-process in super AGB
phase is still yet to be understood. S-process also operates in massive stars that do not go
through AGB/super AGB phase. This weak s-process can produce elements significantly
up to Sr (e.g. Prantzos, Hashimoto & Nomoto 1990; Pignatari et al. 2010). Because of the
long time-scales of low-mass AGB stars, it is believed that AGB stars will not contribute
significantly below metallicity [Fe/H] = −2 (e.g. Roederer et al. 2010; Kobayashi, Karakas
& Umeda 2011b). However, the contribution of AGB stars can appear even at low metallicity in the form of some classes of carbon-enhanced metal-poor (CEMP) stars through
binary mass transfer (McClure 1984; Johnson & Bolte 2002b, 2004; Lucatello et al. 2003;
Sivarani et al. 2004; Goswami et al. 2006; Aoki et al. 2007, 2008; Masseron et al. 2010).
The AGB star ejecta is transferred to the companion star and causes them to be enriched
in carbon and s-process elements (see models from Stancliffe & Glebbeek 2008; Bisterzo et
al. 2009; Stancliffe 2009). In addition to n-capture element production from the s-process,
low-mass stars also produce a small amount of Mg and O in the dredge-up (Marigo 2001;
Karakas & Lattanzio 2003), and might pollute the interstellar medium (ISM) with lighter
elements due to the mass loss from the outer envelope (e.g. Reimers 1977; Vassiliadis &
Wood 1993). However, these contributions to the ISM are marginal, especially at high
metallicity (e.g. Kobayashi et al. 2006; Karakas 2010).
For the elements at A ≃ 90 including Sr, Y and Zr, the origin is even more problematic
(e.g. Honda et al. 2004b; Aoki et al. 2005; Cowan et al. 2005). The observed abundance
ratios of n-capture elements suggest an overproduction of these elements. Travaglio et
19
al. (2004) showed that this overproduction cannot be explained by the weak s-process
alone and named it as the lighter element primary process (LEPP). It has been shown
that these elements could be produced by the collapse of rotating massive stars, i.e. collapsars (Pruet, Thompson & Hoffman 2004) or the weak r-process with slightly low Ye
matter that is naturally expected in core-collapse supernovae (Izutani, Umeda & Tominaga 2009). Qian & Wasserburg (2007, 2008) pointed out that these elements might be
formed through charged particle reaction (CPR). More recently, Boyd et al. (2012) suggested that this anomaly could be explained by truncated r-process for massive stars, in
which the produced heavier r-process elements are consumed by the collapse of a neutron
star to a black hole.
Light elements (Li, C, N, O, Na) will be depleted or internally mixed during their
red giant branch (RGB)/AGB phase either through the CNO cycle, the NeNa cycle (e.g.
Andrievsky et al. 2007) or the hot bottom burning process (e.g. Karakas & Lattanzio 2003).
For instance, Li in giants will be depleted (Norris et al. 1997; Spite et al. 2005; Bonifacio
et al. 2007; Sbordone et al. 2010), whereas N will be enhanced at the expense of C and O.
To avoid complication due to internal mixing and to better study the evolutionary state
of the ISM when the stars were formed, we will leave the discussion of Li, C, N, O, and
Na to a later paper.
We will also study the C-space properties for some dwarf galaxies, because dwarf
galaxies are often proposed as building blocks for larger galaxies like the Milky Way (for a
general review on Local Group dwarf galaxies, see Mateo 1998). The chemical properties of
the dwarf galaxies that are orbiting the Milky Way, such as Sculptor, Fornax, Sagittarius,
Sextans and the LMC2 (Shetrone, Cˆ
ot´e & Sargent 2001; Shetrone et al. 2003; Geisler
et al. 2005; Sbordone et al. 2007) reveal that the present-day dwarfs are chemically too
dissimilar to the Milky Way to be realistic building blocks (but see Frebel, Kirby & Simon
2010b). However the ultrafaint dSph galaxies such as Coma Berenices, Hercules, Leo IV,
Leo T, Ursa Major I and II have abundance patterns more like the pattern of the Galactic
metal-poor halo and appear to be plausible building blocks for the halo (Kirby et al. 2008;
Koch et al. 2008; Frebel et al. 2010a), although their baryonic masses are very small.
We briefly summarize the difference in abundance patterns between the brighter dwarf
galaxies and the Milky Way; for a more complete discussion, see Venn et al. (2004);
Venn & Hill (2008); Tolstoy et al. (2009). Some dwarf galaxies show lower [α/Fe] at
−2 [Fe/H] −1 than the metal-poor stars in the solar neighbourhood, but reach the
same metal-poor plateau ([α/Fe] = 0.3 – 0.5) at [Fe/H] −2. This is often explained by
the slower SFH of the dwarf galaxies, so SNe Ia and AGB stars that have longer timescales can contribute more to the chemical evolution at lower metallicity than they do for
the nearby metal-poor stars. This produces a ‘knee’ in the [α/Fe]–[Fe/H] diagram but at
lower [Fe/H]. However, Kobayashi & Nomoto (2009) argued that if this is due to the SNe
Ia contribution, [Mn/Fe] should also show an increasing trend at the same [Fe/H], while
[Mn/Fe] ratios in dwarf galaxies are as low as in the Galactic halo stars (McWilliam, Rich
& Smecker-Hane 2003). They claimed that the low [α/Fe] and low [Mn/Fe] abundances
patterns in the dwarfs are more consistent with the lack of massive star contribution, or
perhaps both the slower SFH and the lack of massive stars play a role in explaining the
chemical profile of the dwarf galaxies.
The slow SFH also coincides with the observed overabundances of hs elements such as
2
Some exclude LMC from the dwarf galaxies category (e.g. Mateo 1998). However, for simplicity, we
do not distinguish fainter satellite galaxies and dwarf galaxies in this project.
20
Chemical evolution processes
Ba and La relative to their Galactic counterparts at [Fe/H]
−1.5, since there is more
time for the hs elements to be produced by the s-process. On the other hand, at low
metallicity [Fe/H]
−2.5, Aoki et al. (2009) and Tafelmeyer et al. (2010) found that
dwarf galaxies do not show overabundances of [hs/Fe] and tend to follow the Galactic halo
trend. They argued that, at this metallicity, all of the n-capture elements are produced by
the r-process. The ls elements such as Sr, Y and Zr do not however show overabundances
for dwarf galaxies at [Fe/H] −1.5, and are sometimes underabundant, similar to [α/Fe].
This is not unexpected. Although the s-process in Galactic low-mass AGB stars produces
both ls and hs elements (Herwig 2005; K¨
appeler et al. 2011), it has been proposed that
the relative underabundances of the ls elements could be explained by the metallicity
dependence of the s-process (Tolstoy et al. 2009; K¨
appeler et al. 2011). Because of the
primary nature (i.e. independent of metallicity) of the 13 C pocket as the major neutron
source, theoretical studies suggest that metal-poor AGB stars will preferentially produce
heavier s-process elements due to the high neutron-to-seed ratio at low metallicity (Gallino
et al. 1998; Busso et al. 2001; Cristallo et al. 2009; Bisterzo et al. 2010).
Chapter 3
Data selection
Different mechanisms contribute to different metallicity intervals. For example, mechanisms that are associated with more massive progenitors will preferentially contribute at
lower [Fe/H] due to the short evolution time, whereas the s-process in low-mass AGB
stars will only contribute at higher [Fe/H] due to their longer evolution time. The C-space
dimensionality and its interpretation may then be different in different metallicity ranges.
Therefore we separate our discussion according to two major metallicity intervals: −3.5
[Fe/H] −2 and −1 [Fe/H] 0. These correspond roughly to the low-metallicity halo
and the high-metallicity (thick + thin) discs of the Galaxy. In some cases we will also
study the intermediate interval of −2.5 [Fe/H] −1. These metallicity ranges are just
a rough guide and depend on the samples that we adopt from the literature.
There are many observational studies of elemental abundances in the literature (Edvardsson et al. 1993; McWilliam & Rich 1994; Nissen & Schuster 1997, 2010; Hanson et al.
1998; McWilliam 1998; Prochaska et al. 2000; Israelian et al. 2001; Carretta et al. 2002;
Chen et al. 2002, 2003; Johnson & Bolte 2002a; Nissen et al. 2002, 2004, 2007a,b; Stephens
& Boesgaard 2002; Bensby, Feltzing & Lundstr¨
om 2003; Gratton et al. 2003a,b; Akerman
et al. 2004; Arnone et al. 2005; Asplund et al. 2005a, 2006; Bensby et al. 2005; Caffau et
al. 2005b; Jonsell et al. 2005; Allende Prieto et al. 2006; Garc´ıa P´erez et al. 2006; Preston
et al. 2006; Fulbright, McWilliam, & Rich 2007; Lai et al. 2007, 2008; Ruchti et al. 2010;
Fuhrmann 2011), but the analyzing models, solar abundances and the sources of stellar
parameters vary from author to author. This may cause systematic differences in elemental abundances, and produce spurious dimensions in the PCA analysis. Therefore, where
possible we do not use compilations of abundances from multiple sources. Many surveys
are relatively restricted in the number of elements measured or the number of stars (< 50)
observed. Some surveys are strongly biased to specific classes of metal-poor stars, such
as CEMP stars (e.g. Cohen et al. 2006) and r-enhanced stars, or are related to planet
hunting studies (e.g. Sousa et al. 2008; Neves et al. 2009). They are not suitable for our
study, because our goal is to measure the overall dimensionality of the C-space. For each
metallicity range, we focus on a few relatively unbiased, large samples of homogeneous
data, and adopted their abundances directly from the original papers. For the open and
globular clusters, we had no alternative but to use compilations.
3.1
Low metallicity
For the solar neighbourhood low-metallicity halo stars in this study, we use the observational data from Barklem et al. (2005) and the First Stars Survey (Cayrel et al. 2004;
Fran¸cois et al. 2007; Bonifacio et al. 2009). From Barklem et al. (2005), we consider only
stars in the range −3.5 < [Fe/H] < −1.5. We exclude CEMP stars and blue stragglers as
21
Data selection
22
discussed below. In total, after culling, we have 231 stars from Barklem et al. (2005) and
50 stars from First Stars Survey.
Blue stragglers (Preston & Sneden 2000) and some classes of CEMP stars are believed
to have suffered binary mass transfer (cf. Chapter 2) and therefore might not reflect the
abundances profile of the ISM from which they formed. We exclude known blue stragglers
and CEMP stars with [C/Fe] > 1: this criterion is from Beers & Christlieb (2005). Having
made this exclusion, the dimensionality of C-space derived by our PCA method should be
regarded as a lower limit, in case the carbon enhancement of some CEMP stars is not due
to binary mass transfer (e.g. Aoki et al. 2002; Depagne et al. 2002), but to some distinctive
astrophysical origins such as faint supernovae (Tsujimoto & Shigeyama 2003; Umeda &
Nomoto 2003; Karlsson 2006; Kobayashi, Tominaga & Nomoto 2011a) or massive rotating
stars (Meynet, Ekstr¨
om & Maeder 2006).
As the metallicity decreases, departures from local thermodynamic equilibrium (LTE)
are expected to become more pronounced (for a review, see Asplund 2005), and therefore
non-LTE (NLTE) calculation is needed (e.g. Baum¨
ueller, Butler & Gehren 1998; Gratton
et al. 1999; Mashonkina & Gehren 2001; Korn, Shi & Gehren 2003; Takeda et al. 2003;
Andrievsky et al. 2009, 2010, 2011; Bergemann, Pickering & Gehren 2010). However, note
that Barklem et al. (2011) cautioned that estimating the inelastic hydrogen atom collisions
with Drawin’s formula in these studies might not be appropriate. As a large homogeneous
NLTE-corrected sample is not yet available, and combining heterogeneous samples will give
spurious dimensions in the PCA analysis due to the systematic differences, we decided to
use available homogeneous 1D-LTE abundances. All the chemical abundances from 1DLTE models are taken directly from the original papers, with the exception of the element
Al.
We include Al in our analysis because, unlike Na and O, Al abundances do not suffer
from significant internal mixing in Galactic stars (Andrievsky et al. 2008; Bonifacio et
al. 2009). However, Al abundances are affected by NLTE effects at low metallicity. We
adopted a +0.6 NLTE correction for [Al/Fe] as suggested by Baum¨
ueller & Gehren (1997)
and Cohen et al. (2004). Our results would not alter if we were to exclude Al. Al is the
only NLTE-corrected abundance in this study. Our results should be reviewed once a large
homogenized NLTE-corrected sample is available.
3.2
Intermediate, high metallicity
For solar neighbourhood intermediate-metallicity stars, we chose to use the Burris et
al. (2000) sample (70 stars) and Fulbright (2000, 2002) sample (178 stars). For highmetallicity disc stars, we use the Reddy et al. (2003) and Reddy, Lambert & Allende
Prieto (2006) samples (357 stars). These samples are adopted without further modification
beyond culling obvious outliers (e.g. [Al/Fe] > 1, [V/Fe] > 0.8, [Co/Fe] > 0.7, [Nd/Fe]
> 5, [Eu/Fe] > 5).
3.3
Dwarf galaxies
To compare the state of chemical evolution in the Milky Way and fainter satellite galaxies,
we study the Fornax dSph galaxy using the Letarte et al. (2010) sample (80 stars). We
exclude the star B058 because it is a metallicity outlier ([Fe/H] = −2.58) for this sample
(−1.2 < [Fe/H] < −0.6). We also studied the LMC, using the homogeneous sample (57
§3.4
Globular and open clusters
23
stars) from Pompeia et al. (2008). For dwarf galaxies, to our knowledge, these are the
only publicly available data sets with large (> 50 stars) homogeneous samples and with
elemental abundances measured at high resolution.
3.4
Globular and open clusters
The halo/disc star samples are mostly in the solar neighbourhood with 7.5
rG
8.5
kpc, where rG is the distance from the Galactic Centre. We would like to know whether
stars over a larger Galactic volume would give us more inhomogeneity and therefore more
independent dimensions in the C-space. To probe wider regions, globular clusters (Searle
& Zinn 1978), moving groups (e.g. De Silva et al. 2007; Bubar & King 2010) and open
clusters (e.g. Yong, Carney & Teixera de Almeida 2005; Friel, Jacobson & Pilachowski
2010; Pancino et al. 2010; Andreuzzi et al. 2011; Jacobson, Friel & Pilachowski 2011) are
suitable objects.
No large homogeneous survey of globular clusters including a wide variety of elements is
available to date (but see Carretta et al. 2009, for a homogeneous survey with a restricted
number of elements). We have to use the compilation of Pritzl, Venn & Irwin (2005) from
different authors. In this compilation, mean abundances for each globular cluster were
derived. Since we do not study light elements like C, N, O, Na that have been shown to
have star-to-star dispersion within a cluster, other elements should have small star-to-star
dispersion within a cluster and therefore it is justified to take mean abundances for most
of the elements in this study. However, we are aware that recently Roederer & Sneden
(2011) have shown star-to-star dispersion in heavy n-capture elements (like La, Eu) and
therefore taking mean abundances of each globular cluster will only give a lower limit of
the C-space dimensionality. We exclude objects identified with a dwarf spheroidal galaxy
debris stream, such as Rup106, Pal12, Ter7 (e.g. Caffau et al. 2005a), and M68. Metallicity
outliers are excluded by restricting [Fe/H] to the range −2.5 to −1. This leaves us with a
total of 33 clusters.
We also study a recent open clusters compilation from Carrera & Pancino (2011)
(private communication). We exclude those open clusters that have only [Fe/H] measurements. For clusters with multiple measurements, we take the mean abundance for
each element. The sample then contains a total of 78 clusters, with Galactocentric radii
6.4 ≤ rG ≤ 20.8 kpc and −0.57 ≤ [Fe/H] ≤ 0.41. For this compilation, we found that
different model parameters lead to systematic differences of up to about 0.1 dex. Other
sources of systematics such as differences in model atmospheres and methodology (e.g.
equivalent width versus spectrum synthesis), are difficult to quantify but are likely to be
smaller. Thus we estimate that the systematic differences can be up to 0.2 dex depending
on the elements.
Since we will not perform PCA combining multiple samples other than globular clusters
and open clusters, and the solar abundance differences for elements heavier than Na are
usually small (e.g. Anders & Grevesse 1989; Grevesse & Sauval 1998; Asplund, Grevesse
& Sauval 2005b; Asplund et al. 2009; Lodders, Palme & Gail 2009), we do not homogenize
the solar abundances adopted by different authors. The metallicity distribution of each
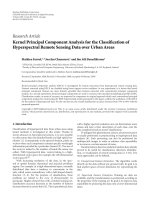
sample is shown in Fig. 3.1 and we summarize our adopted samples in Table 3.1.
24
Data selection
Figure 3.1: The metallicity distribution of each sample that we have adopted. For solar neighbourhood stars,
we have low-metallicity stars from Barklem et al. (2005) and First Stars Survey; intermediate-metallicity stars
from Burris et al. (2000) and Fulbright (2000, 2002); and high-metallicity stars from Reddy et al. (2003, 2006).
We also have the Fornax dSph galaxy sample from Letarte et al. (2010), the LMC sample from Pompeia et
al. (2008), MW globular cluster compilation from Pritzl et al. (2005) and MW open cluster compilation from
Carrera & Pancino (2011). The dashed lines show the median abundance of each sample.
§3.4
Globular and open clusters
25
Table 3.1: Summary of adopted samples in this study.
a
b
c
References
Categories
Counta
The Milky Way solar neighbourhood
Barklem et al. (2005)
First Stars Surveyb
Reddy et al. (2003, 2006)
Fulbright (2000, 2002)
Burris et al. (2000)
Metal-poor halo stars
Metal-poor halo stars
Metal-rich thin+thick disc stars
Intermediate-metallicity stars
Intermediate-metallicity stars
231
50
357
178
70
Others
Pritzl et al. (2005)
Carrera & Pancino (2011)
Letarte et al. (2010)
Pompeia et al. (2008)
The Milky Way globular clusters
The Milky Way open clusters
Fornax dwarf spheroidal galaxy
The Large Magellanic Cloud
33c
78c
80
57
After restricting metallicity range, culling outliers, CEMP and blue stranglers
Cayrel et al. (2004), Bonifacio et al. (2007) and Fran¸cois et al. (2007)
Number of clusters