Understanding the cost of green buildings evidence from singapore
Bạn đang xem bản rút gọn của tài liệu. Xem và tải ngay bản đầy đủ của tài liệu tại đây (2.94 MB, 172 trang )
UNDERSTANDING THE COST OF GREEN BUILDINGS:
EVIDENCE FROM SINGAPORE
JIANG YUXI
NATIONAL UNIVERSITY OF SINGAPORE
2010
UNDERSTANDING THE COST OF GREEN
BUILDINGS:
EVIDENCE FROM SINGAPORE
JIANG YUXI
(B.Sc., Tongji University)
A THESIS SUBMITTED
FOR THE DEGREE OF MASTER OF SCIENCE
DEPARTMENT OF REAL ESTATE
NATIONAL UNIVERSITY OF SINGAPORE
2010
i
Acknowledgements
This thesis would not have been possible without the help of many people. I
would like to express my deepest gratitude and appreciation to the following
persons who have contributed to this thesis.
First and foremost, I would like to express my sincere gratitude to my
supervisor, Associate Professor Yu Shi Ming, Head of Department of Real
Estate, School of Design and Environment, NUS, for his unceasingly useful
advice and comments, and his invaluable guidance and encouragement
throughout this work and in the writing process of this thesis.
I cannot fully express my appreciation to Lee Min Xian, Research Assistant of
Department of Real Estate, for her kind help and beneficial discussions. Also
my eternal appreciation goes to Associate Professor Tu Yong, for her kind
guidance and suggestions especially in the beginning of this research.
I would like to thank developer firms, City Development Limited and Keppel
Land, for providing generous access to all the necessary data employed in this
research, as well as for the beneficial advices.
Many thanks go to staffs in Building and Construction Authority, especially
my friend Wang Yuan, Mr Yock Keng Leow and Ms Jocelyn Chua for sharing
their invaluable knowledge and assistance.
My grateful appreciation also goes to all friends in SDE, for their suggestions
and encouragements. Without you my friends, this work could have never
been done.
ii
And finally, my sincere thank go to my Mother and Father, my boyfriend, who
have always inspired me to continue my studies, and who have given me so
much of their love and support for the many years of education.
iii
Table of Contents
List of Tables ....................................................................................................... v
List of Figures ................................................................................................... vii
List of Tables in Appendices ............................................................................ viii
Summary ............................................................................................................ ix
1 Introduction .................................................................................................. 1
1.1 Background....................................................................................... 1
1.2 Research Problem ............................................................................. 7
1.3 Research Objectives ......................................................................... 9
1.4 Significance of the Study ................................................................ 10
1.5 Organization of the Study ............................................................... 13
2 Literature Review....................................................................................... 15
2.1 Introduction .................................................................................... 15
2.2 Construction Cost of Green Buildings............................................ 15
2.2.1 Definition of Construction Cost and Green Cost .................. 15
2.2.2 An Overview of “Green Cost” Issues ................................... 16
2.2.3 Discussion ............................................................................. 20
2.3 Cost Considerations of Green Buildings ........................................ 21
2.3.1 Conventional Building Attributes ......................................... 22
2.3.2 Green Attributes .................................................................... 24
2.3.3 Other Attributes..................................................................... 28
2.4 Summary......................................................................................... 33
3 Green Building: A Solution for Energy Problem ....................................... 34
3.1 Introduction .................................................................................... 34
3.2 Energy Intensity in Singapore and Related Measures to Achieve
Energy Efficiency ..................................................................................... 34
3.3 BCA Green Mark Scheme .............................................................. 37
3.4 Summary......................................................................................... 40
4 Research Methodology .............................................................................. 42
4.1 Introduction .................................................................................... 42
4.2 Measurement of Construction Cost ................................................ 43
4.2.1 Introduction ........................................................................... 43
4.2.2 Cost Estimation- Practical Method ....................................... 46
4.2.3 Cost Estimation- Theoretical Model ..................................... 50
4.3 Measurement of Green Cost ........................................................... 53
4.4 Summary......................................................................................... 55
5 Sample Selection and Data Description ..................................................... 56
5.1 Introduction .................................................................................... 56
5.2 Data Collection ............................................................................... 56
5.3 Definition of Variables.................................................................... 61
5.4 Descriptive Statistics ...................................................................... 63
5.4.1 Dependent Variables ............................................................. 64
5.4.2 Building Attributes ................................................................ 67
5.4.3 Green Attributes .................................................................... 68
5.5 Summary......................................................................................... 72
6 Empirical Findings ..................................................................................... 73
6.1 Introduction .................................................................................... 73
iv
6.2 Determinants of Construction Cost ................................................ 75
6.3 Determinants of Green Cost ........................................................... 81
6.4 Determinants of Green Cost Percentage ......................................... 83
6.5 Summary......................................................................................... 86
7 Trend, Development and Implications ....................................................... 88
7.1 Introduction .................................................................................... 88
7.2 Development of Green Mark Scheme ............................................ 88
7.2.1 Category Changes ................................................................. 90
7.2.2 Changes of Points Allocation ................................................ 90
7.2.3 Sub-category Changes .......................................................... 95
7.2.4 Green Mark Score-Rating Changes ...................................... 97
7.2.5 Discussion ............................................................................. 98
7.3 Selection of Green Features.......................................................... 101
7.3.1 Number of Features Considered by Developers ................. 101
7.3.2 Number of Features Incorporated in Projects ..................... 104
7.3.3 Green Features with High Adoption Rate ........................... 107
7.4 Cost-Benefit Analysis of Green Features ..................................... 109
7.4.1 Cost Analysis of Green Features ......................................... 109
7.4.2 Benefits Analysis of Green Features ................................... 112
7.4.3 Discussion ........................................................................... 115
7.5 Trend of Construction Cost and Green Cost................................. 116
7.6 Summary....................................................................................... 120
8 Conclusion ............................................................................................... 122
8.1 Main Findings ............................................................................... 122
8.2 Limitations of the Study ............................................................... 125
8.3 Recommendations for Future Work.............................................. 126
References ....................................................................................................... 128
Appendices...................................................................................................... 137
v
List of Tables
Table 2- 1 Extra costs to go green vary by region ........................................... 19
Table 2- 2 Latest rate of Prescribed Green Premium with effect from 1
September 2009 ............................................................................................... 19
Table 2- 3 Average green cost and payback times for Green Mark
developments ................................................................................................... 20
Table 2- 4 Range of green cost and payback periods by Green Mark rating ... 20
Table 2- 5 Code Frame Type ............................................................................ 23
Table 2- 6 The demand for Basic Construction Materials in 2008 and 2009 .. 30
Table 2- 7 Market price for Basic Construction Materials in 2007 and 2008.. 30
Table 2- 8 Mean values of Building Tender Price Index by year..................... 32
Table 4- 1 Building cost estimates comparison ............................................... 49
Table 5- 1 Data description .............................................................................. 57
Table 5- 2 Variables and definitions ................................................................. 62
Table 5- 3 Award Year of sample projects........................................................ 63
Table 5- 4 Descriptive statistics of overall sample .......................................... 64
Table 5- 5 Statistical results of green cost percentage by Green Mark rating . 66
Table 5- 6 Comparison results on average green cost percentages between
previous literature and our results .................................................................... 67
Table 5- 7 Comparison results on green cost percentages between BCA report
and ours ............................................................................................................ 67
Table 5- 8 Required Score for each Green Mark rating in version 3 ............... 70
Table 5- 9 Descriptive Statistics- Green Performance by type ........................ 71
Table 6- 1 Estimated relationships between dependent and independent
variables ........................................................................................................... 73
Table 6- 2 Summary statistics on selected variables ........................................ 75
Table 6- 3 OLS regression estimation of Construction cost ............................ 79
Table 6- 4 OLS regression estimation of Green cost ....................................... 82
Table 6- 5 OLS regression estimation of Green Cost percentage .................... 84
Table 7- 1 Different versions of assessment criteria and their effective date .. 88
Table 7- 2 Award Year and Award criterion ..................................................... 90
Table 7- 3 Point allocations changes from Version 1 to Version 3................... 92
Table 7- 4 Point allocations in Version 3 ......................................................... 93
Table 7- 5 Sub-category Changes from Version 1 to Version 2 ....................... 96
Table 7- 6 Sub-category Changes from Version 2 to Version 3 for residential
buildings........................................................................................................... 96
Table 7- 7 Sub-category Changes from Version 2 to Version 3 for nonresidential buildings ......................................................................................... 97
Table 7- 8 Point-Scoring Rating Criteria ......................................................... 98
vi
Table 7- 9 Comparison between COMPANY X given list and Checklist ..... 102
Table 7- 10 Project information ..................................................................... 104
Table 7- 11 Statistics on green features incorporated .................................... 105
Table 7- 12 Statistics on adoption rates of green features.............................. 107
Table 7- 13 Summary of Green features with a high adoption rate ............... 108
Table 7- 14 Costs comparison between green features and basic building
requirements ................................................................................................... 110
Table 7- 15 Green Cost distributions by category ......................................... 112
vii
List of Figures
Figure 1- 1 Worldwide Green building rating systems ...................................... 4
Figure 1- 2 Statistics on BCA Green Mark awards (from 2005 till 2009) ......... 4
Figure 1- 3 Date and type of the publications (until March 2009) .................. 11
Figure 1- 4 Three main rating systems in literature - BREEAM, LEED, Energy
Star ................................................................................................................... 12
Figure 2- 1 Extra costs to become LEED certified as of 2007 excluding
Certification fees .............................................................................................. 19
Figure 2- 2 Trend in incremental cost for meeting LEED Silver in Seattle over
4 years (data not available for 2002)................................................................ 26
Figure 2- 3 Metal Price Movements ................................................................ 30
Figure 2- 4 Building Tender Price Index (Year 2005=100) ............................. 32
Figure 3- 1 Energy consumption in Singapore (2005)..................................... 36
Figure 3- 2 Five key criteria in BCA Green Mark and their percentage in total
score ................................................................................................................. 38
Figure 3- 3 BCA Green Mark - In Singapore .................................................. 40
Figure 3- 4 BCA Green Mark- Beyond Singapore .......................................... 40
Figure 4- 1 Project Life Cycle Estimates ......................................................... 45
Figure 5- 1 Green Mark Structure .................................................................... 60
Figure 5- 2 Construction prices (per square meter) by Green Mark rating ..... 65
Figure 5- 3 Green cost percentage by property type ........................................ 65
Figure 5- 4 Statistics on Green Buildings awards in 2009 (by category) ........ 69
Figure 5- 5 Number of buildings by Green Mark rating .................................. 70
Figure 7- 1 Point allocations by Green Mark version ...................................... 93
Figure 7- 2 Motivations for energy efficiency investments in 2007 and 2008 99
Figure 7- 3 The impact when we go less green to more ................................ 119
viii
List of Tables in Appendices
Appendix Table 1 Summary of Policies and Measures in E2 Singapore ....... 137
Appendix Table 2 Summary of Green building Schemes .............................. 138
Appendix Table 3 Green Mark for Existing Buildings (Version 1) ............... 140
Appendix Table 4 Green Mark for New Buildings (Version 1) ..................... 141
Appendix Table 5 Green Mark for Air-Conditioned Buildings (Version 2.0)142
Appendix Table 6 Green Mark for Residential Buildings (Version 2) .......... 143
Appendix Table 7 Green Mark for Non-Residential building (Version 2) .... 144
Appendix Table 8 Green Mark for Non-Residential Existing Building (Version
2.1) ................................................................................................................. 145
Appendix Table 9 Green Mark for Residential Buildings (Version RB/3.0) . 146
Appendix Table 10 Green Mark for Non-Residential Buildings (Version
NRB/3.0) ........................................................................................................ 147
Appendix Table 11 Checklist of green features and description.................... 148
Appendix Table 12 Summary of green features by category ......................... 151
ix
Summary
Sustainability has become a wide-ranging concept that can be applied to
almost every aspect of life. A range of new techniques have arisen to help
measure and implement sustainability, especially in the field of green
buildings which are designed to minimize environmental impact and resource
use. However, the response of real estate market has been slow and the often
quoted reason is a narrow understanding on the benefits of sustainable
buildings. Another reason is due to the perception that building green implies
higher construction cost early in the project. The “green cost” issue, which
refers to the idea that green building costs significantly more than
conventional construction, has recently become one of the most common
objections to this type of development.
This systematic study addresses questions on the construction cost of
investments in environmental friendly design, and tries to identify whether
there exists a cost premium between green and non-green buildings. This
study confirms the existence of green cost premium. The average green cost
premium for each rating is 2.45% for Platinum, 1.23% for Goldplus, 1.21% for
Gold. Green costs make up 1.6% of total construction costs valued at $2.81
million on average and it increases with the Green Mark rating.
Moreover, this study evaluates the impact of BCA Green Mark scheme and its
ratings on the construction cost and green cost of building projects. A hedonic
regression model is provided that considers three groups of attributes
including (1) conventional building features; (2) green features; and (3) market
x
attributes. These factors include number of building storeys, number of units,
total area, property type, familiarity of green design and technology, Green
Mark rating, estimated energy and water savings, version of Green Mark
assessment criteria, and Building Tender Price Index. It was found that among
green attributes, Green Mark rating, especially whether the building is
awarded Platinum rating or not, is the most consistently significant variable
affecting green cost. Green cost percentages increase with Green Mark rating,
but negatively relate to total building area (in terms of GFA). Energy
efficiency is an integral part of Green Mark Scheme and also the main focus of
developers, at the same time the energy performance is positively and
significantly related to green cost. Unfortunately, because of the limited
sample, the study did not conclusively evaluate the significance of the
variables as expected. Besides, the findings reveal a wide potential for
buildings to get greener since only a small portion (36%) of green features
have been adopted in the building projects.
The purpose of this study is to shed more light on estimations of the potential
costs and provide valuable insight to end users, professionals, research
institutions, industry and government with empirical evidence. The results do
contribute to the growing knowledge on green building developments and help
accelerate the response of the real estate market to the concept of sustainability.
Chapter One - Introduction
1
1
Introduction
1.1 Background
Sustainability is a broad concept that can be applied to various contexts, from
local to a global scale, from human to other living systems. It is recognized as
seeking balance between environmental, social and economic demands or - the
"three pillars" of sustainability which challenge conventional economic
wisdom. Its wider acceptance maybe trace back to the publication of Our
Common Future (Bruntland, 1987) in which the United Nation's World
Commission on Environment and Development proposed that sustainable
development is required to meet human needs without increasing
environmental problems. Since then, sustainability has become a top priority
for both government and industry (Sturge, 2007; Tesh, 1993).
In dealing with sustainability, governments in different countries implement a
series of legislative measures, such as planning and establishing judicial and
social regulations. Firms seek to orient themselves as responsible and
responsive to environment and society, as well as to consider corporate social
responsibility (CSR) in their decision making. CSR has become a normative
standard in evaluating firms’ choices about inputs (e.g., the source of raw
materials), internal processes (e.g., the treatment of employees), and outputs
(e.g., community relations) (Waddock & Graves, 1997). Business begins to
embrace responsibility for the impact of their activities on the environment,
consumers, employees, communities, stakeholders and all other members of
the public sphere.
Chapter One - Introduction
2
In the 21st Century, sustainability is reinforced due to the threat posed by
global warming. The Intergovernmental Panel on Climate Change (IPCC)
(Metz et al., 2007) reported that most of the observed temperature increase
dating from the middle of the 20th century was caused by increasing
concentrations of the human-induced greenhouse gases (GHGs). On February
20, 2007, the Global Roundtable on Climate Change launched "The Path to
Climate Sustainability: A Joint Statement by the Global Roundtable on
Climate Change", which called on governments to set targets for GHGs and
carbon dioxide emissions reduction. More recently, the surging public
awareness of sustainability has resulted in a more sustainable lifestyle, which
refers to the adoption of recycling and renewable energies. To support
measuring and implementing sustainability, various new techniques have
arisen such as Life Cycle Assessment, the Ecological Footprint Analysis, and
sustainable building approaches (Blewitt, 2008).
In general, the building sector has a dominating impact on the environment,
which contributes up to 50% of CO 2 emissions, 40% of energy consumption,
16% of water usage, 40% of solid landfill waste, 50% of raw materials and
71% of electricity demand (Newell, 2008). Therefore, green buildings, which
are designed to help reduce environmental impact and resource consumption
(Kingsley, 2008), have gained considerable attention since its first appearing
on the theoretical stage. It is defined as “the practice of 1) increasing the
efficiency with which buildings and their sites use energy, water, and materials,
and 2) reducing building impacts on human health and the environment,
through better sitting, design, construction, operation, maintenance, and
removal” (Cassidy, 2003; Kibert, 2003)—the complete building life cycle, and
Chapter One - Introduction
3
provide occupants with an environment as healthy as possible. In other words,
green buildings provide considerable benefits such as less disruption of local
ecosystems and habitats, resource conservation, decreased air, water and noise
pollution, superior indoor air quality, increased employee productivity and
reduced absenteeism (Larson et al.). In a study by Fisk (2000), green buildings
were found to add $20 to $160 billion in increased worker productivity per
year. Kats(2003) estimates productivity benefits are ten times the energy
savings from green efforts. Of course, such claims of higher productivity
require further verification to rule out the possibility of just short term
phenomenon or the effect of new environments (Miller et al., 2008).
As a result of these benefits, governments in many countries have attached
high importance to green buildings, and announced many legislation and
subsidies to promote the movement of voluntary environmental certification
systems for new buildings and refurbishments (Kingsley, 2008). Up to now,
more than 10 countries have adopted different rating systems for green
buildings such as U.S., U.K., Canada, Australia, Italy, Japan and Singapore
(see Figure 1- 1). Among them, the most widely used rating system is LEED
(Leadership in Energy and Environmental Design). Since its inception in 1998,
LEED has rated over 14,000 projects in 50 U.S. states and 30 countries
covering 98.7 km² of development area. In Singapore, through active
promotion and intense educational efforts, the Green Mark Scheme has
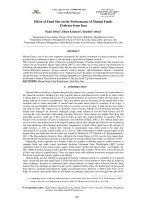
certified 215 buildings (250 projects in total) from 2005 to 2009(see Figure 12), including 31 Platinum Awards, 20 Goldplus Awards, 93 Gold Awards and 78
Certified Awards. In 2009, there are three newly launched schemes, namely,
Green Mark for Infrastructure, Green Mark for Office Interior, and Green
Chapter One - Introduction
4
Mark for Landed Houses.
Figure 1- 1 Worldwide Green building rating systems
Source: Philip Yu, Green Building and LEED, Taiwan Energy Service Seminar
(2007-6-14, Pg16)
40
35
30
25
Certified
20
Gold
15
Goldplus
10
Platinum
5
0
2005
2006
2007
2008
2009
Figure 1- 2 Statistics on BCA Green Mark awards (from 2005 till 2009)
Although many buildings have used BCA Green Mark scheme as a design
protocol and measuring standard and then obtained certification, the number
of certified buildings began to dramatically increase only since 2008, as shown
in Figure 1- 2. In fact, until 2007, only 45 buildings in Singapore have attained
the BCA Green Mark award, which only account for a small percentage of the
total number of buildings, and merely constitute an insignificant portion of the
Chapter One - Introduction
5
total built-up area. In New York City, of the nearly 5,000 new construction
projects issued in 2007, only 4% registered for LEED certification. Although
this study and figures are based in the U.S., a similar situation is mirrored in
Singapore. Nevertheless, the response of real estate market is slow. The
possible reasons are as follows:
The frequently quoted reason for this phenomenon is a narrow understanding
of the benefits of sustainable buildings (Bennett, 2006). Among the benefits
mentioned before, the most concerned ones are the perceived higher annual
savings, increased rental fee and sales price. These benefits have been
confirmed by recent studies, although still call for more empirical verification.
Values of green buildings are expected to increase roughly 7.5%, the ROI (rate
on investment) by 6.6%, occupancy ratios by 3.3% and the rent ratio by 3%
(Green Building Smartmarket report, 2006). Furthermore, a group of studies
(Fuerst & McAllister, 2009; Eichholtz et al., 2008; Miller et al., 2008 and a
forthcoming paper by Wiley et al., 2008) focused on the effect of
environmental certification on sale prices and rents respectively, and they all
confirmed that there is sales premium and rental premium when comparing
green buildings (LEED and energy star) with similar conventional buildings,
although with a wide range from 3% to 35%. The most widely quoted paper
among these was conducted by Miller et al.(2008), which provided a general
comparison and tentative analysis of these series of papers while all similar
studies are still preliminary and some are still in working paper form.
A further reason for this slow reaction is probably due to the lingering
perception that building green implies higher construction cost in the early
Chapter One - Introduction
6
phrase (Wiley et al., 2008), thus leaving less financial profits after
compensating the extra expense(Sayce et al., 2009). A study carried out by
global construction consultants Davis Langdon and the Urban Green Council
found out that this sluggish adoption of sustainable building practices in New
York City was stemmed from the perception that building green is expensive.
It was found “78 percent of architectural, engineering, and construction
respondents to Building Design & Construction 2007 survey believed that
going green adds significantly to first costs and in CoreNet Global/Jones Lang
LaSalle’s January 2008 survey, 30 percent of respondents believed that new
green buildings cost 5 to 10 percent more than conventional buildings, and 22
percent believed that green costs more than 10 percent over the cost of
conventional buildings” (Lockwood, 2008, Pg5). In fact, these costs have been
overestimated as a result of the general deficiency of published data. Green
costs are overestimated by 300% according to a recent survey by the World
Business Council for Sustainable Development (2007).
Builders, developers and other industrial sectors have already acknowledged
the perceived higher annual savings, increased rental fee and sales price.
However, when confronting the slightly higher construction cost, they are still
hard to be convinced that green buildings worth the investment. It seems
sometimes that their doubts are reasonable. Firstly, the potential annual
savings are quite uncertain as they depend a lot on the vacancy rate, daily
usage and the facilities performance in the long run. Some researchers have
found that the quantities could differ by over than 100%. Therefore, such
perceived annual savings are perceived with high risk. Secondly, the annual
savings are enjoyed by the occupants and tenants, while builders and
Chapter One - Introduction
7
developers are generally concerned with the capital cost of constructing green
building, and would have little interest in operational cost savings (Intrachooto
& Horayangkura, 2007; Larson & Lotspeich). These “split incentives” (Fuerst
& McAllister, 2008) hamper the probability of building green. But if the
building they are constructing is for their own use, builders and developers
will consider the operational cost (Intrachooto & Horayangkura, 2007; Larson
& Lotspeich). Even if they concern the operational cost, they will still be
worried about whether the increased cost can be compensated by such
operation savings, especially how long it will take. This suggests a need to
discuss or study more on payback time as it remains a concern of those
builders and developers.
1.2 Research Problem
Given energy consumption can cause many environmental problems, and
buildings consume most of the energy, there has been a growing interest in
green buildings, which are designed to limit resource use as well as
environmental impact on the entire life of a building, from resource extraction
to disposal, and provide occupants with an environment as healthy as possible.
Many countries such as U.S., U.K., Canada, has adopted green building as a
design protocol and measuring standard for a building’s environment
performance. In academia, large numbers of outstanding papers with regard to
green buildings have emerged from different areas like architecture and
building, especially since 2006. These papers are concentrated in describing
the advantages of green buildings through the comparison with conventional
buildings, such as lower depreciation, lower risk, the possible change to
Chapter One - Introduction
8
capital value and rental price, duration to sell or lease, refurbishment costs and
other topics. However, the disadvantages of green buildings are also
frequently mentioned by different sectors in industry, especially builders and
developers. The “green cost” issue, which refers to the idea that green
buildings cost significantly more than conventional ones, has recently become
one of the most common objections to the green building development.
The literature review (see Chapter 2) found that:
(1) Previous papers have yet to provide a clear opinion about whether
sustainability adds to the construction cost of building projects, and if so,
by how much.
(2) Even if the cost premium of green buildings projects has been proven by a
few studies carried out in foreign context, more studies still need to be
developed in the local market since the cost premium tends to vary in
different local markets. However, there is a lack of sufficient published
data on the building projects in Singapore.
(3) Among the different approaches for estimating the construction cost, the
method that applying descriptive design features instead of quantities,
such as size, shape, frame, and location, has been studied in academia for
many years, but never been widely applied in construction industry. The
method requires little data, and is convenient to use and straightforward to
show the individual variable’s effect on cost.
(4) Previous studies compare the construction cost per square meter between
green and non-green buildings. However, they fail to consider the impact
of other possible factors on construction cost as well, such as the market
Chapter One - Introduction
9
condition, despite attempts to exclude the impact of different building
features by selecting similar samples to compare with.
Based on these, the research problems are:
(1) There is a need to identify the green cost of building projects in Singapore,
and evaluate the impact of BCA Green Mark ratings on construction cost
and green cost, and by how much.
(2) There is a need to develop a method that considers both descriptive design
features and other possible factors in the model, to apply in both
theoretical and empirical analysis.
Therefore, the research problems can be summarized in the following
statement:
Is there a cost premium between green and non-green buildings? If yes, how
can BCA Green Mark scheme and its ratings affect the construction cost and
green cost of building projects in Singapore, and by how much? In what way
this impact can be represented in a model for use in theoretical and empirical
analysis?
1.3 Research Objectives
The development of green buildings has become a favorite topic in recent
years. When designing such buildings, the developers require possessing a
comprehensive understanding of assessment criteria and scoring system. To
make a more accurate estimation on the potential costs and adjust their design
at the early stage, it would thus be of interest to know the factors affecting the
Chapter One - Introduction
10
construction cost of green building. Therefore, this study addresses questions
on the development of green building, examine the green cost and its possible
determinants, and essentially focus on the extent of the impact of BCA Green
Mark ratings and green performance on construction costs. The objectives of
this study are as follows:
(1)To study the Green Mark scheme and Green Mark rating
(2)To identify whether there exists a construction cost premium between
green and non-green buildings;
(3)To analyze the impact of Green Mark ratings and green performance
on construction costs;
(4)To adjust the conventional cost estimation method to estimate the
construction cost of green building.
1.4 Significance of the Study
Due to the growing awareness of sustainability issues, a large number of
papers regarding sustainability have emerged in these years, especially after
2006(see Figure 1- 3), which is slower than the demand of developing green
buildings.
Chapter One - Introduction
00 01 02 03 04
11
05 06 07 08 09
Figure 1- 3 Date and type of the publications (until March 2009)
Source: Sayce et al., 2009, Pg 8
Up to 2009, most publications with respect to green buildings appear in U.S.,
U.K. and Australia. Of the articles studied by Sayce et al.(2009), only some
(18%) did not derive from these countries. Moreover, the rating system
discussed in the literature concentrated on LEED, Energy Star and BREEAM
(Building Research Establishment Environmental Assessment Method) (Figure
1- 4), while for others, “the evidence is not yet there” (Sayce et al., 2009).
Therefore, it is not clear whether these research findings can be extended to
other countries, or other rating systems, thus suggesting a need to investigate
other rating system like BCA Green Mark scheme as it exists in Singapore.
Few papers are written on BCA Green Mark Scheme since it was only
introduced in 2005. The only evidence available is some general percentage
findings from Building Construction Authority (BCA) to indicate that building
green is less expensive than many developers think, although it may still cost
more than the conventional buildings (based on several buildings’ experience).
However, they did not provide the detailed information about the buildings
sampled or the methodology used to validate their findings.
Chapter One - Introduction
12
Rating Systems
23%
36%
LEED
BREEAM
5%
Energy Star
None Given
36%
Figure 1- 4 Three main rating systems in literature - BREEAM, LEED, Energy Star
Source: Sayce et al., 2009, Pg 16
Although many studies on construction costs of green buildings have been
carried out, the “green cost” issue is unclear or indefinite. The reasons partly
lie in that most of these studies are case studies. The conclusions are derived
from statistical results with comparing the construction cost per square meter
between green buildings and non-green ones, and thus have much local
variation that adds to or reduces the marginal costs of going green. They fail to
consider the impact of other possible factors on construction cost as well, such
as the market condition, despite attempts to exclude the impact of different
building features by selecting similar samples to compare with. This study,
therefore, goes well beyond case studies and uses a hedonic model to
empirically prove the factors affecting the construction cost and the extent of
their impacts.
This study aims to provide useful insight to academia, government, and
private sector with empirical evidence, help developers and other participants
in the property market make more accurate estimations of the potential costs.
It is hoped to contribute significantly to the growing knowledge on green
Chapter One - Introduction
13
building development and help accelerate the response of real estate market to
the concept of sustainability.
1.5 Organization of the Study
For the purpose and focus of this study, the research is limited to the building
and construction industry in Singapore. This study is organized as follows.
Chapter 1 contains a brief overview of the research background and
research problem, research objectives. It also introduces the significance of
this study.
Chapter 2 presents the literature review conducted on past research works
with regard to green cost issues, summarizes the possible determinants of
construction cost and green cost.
Chapter 3 provides complimentary information on the implementation
necessary of green building in Singapore.
Chapter 4 describes various measurements of construction cost and green
cost in practice and theory.
Chapter 5 provides details on the procedure of data collection, definitions
of the study variables, sources of the data, and the descriptive statistics for
empirical samples.
Chapter 6 presents empirical findings of the study. The determinants of
construction cost, green cost and green cost percentage are tested
separately by conducting several linear regressions.
Chapter 7 further discusses the development of green buildings and BCA
Green Mark Scheme in recent years, and the trend of construction cost and