Molecular characterization and developmental expression patterns of the zebrafish twist gene family
Bạn đang xem bản rút gọn của tài liệu. Xem và tải ngay bản đầy đủ của tài liệu tại đây (1.25 MB, 115 trang )
Molecular Characterization and Developmental Expression
Patterns of the Zebrafish twist Gene Family
Yeo Gare Hoon
(B.Sci, University of Melbourne)
A THESIS SUBMITTED
FOR THE DEGREE OF MASTER OF SCIENCE
YOOG LOO LIN SCHOOL OF MEDICINE
(DEPARTMENT OF PAEDIATRICS)
NATIONAL UNIVERSITY OF SINGAPORE
2009
Table of Contents
_____________________________________________________________
Acknowledgements
v
List of Tables
vi
List of Figures
vii
Abbreviation
ix
Summary
x
Abstract
xiii
________________________________________________________________________
Chapter 1:
Introduction
1
1.1
TWIST gene family
1
1.1.1
TWIST1 gene
1
1.1.2
TWIST2 gene
5
1.1.3
Twist3 gene
6
1.2
Why zebrafish is used as an animal model in this study?
7
1.3
Phylogenetics
8
1.3.1
DNA or protein sequences
9
1.4
Gene duplication
10
1.4.1
Evolutionary fates of duplicate genes
12
Chapter 2:
Materials and Methods
16
2.1
Animal stocks and maintenance
16
2.2
Isolation of genomic DNA and total RNA
16
2.2.1
Isolation of genomic DNA
16
2.2.2
Isolation of total RNA
17
2.3
Full-length cDNA sequence
17
2.3.1
Rapid amplification of complementary DNA ends
2.3.2
(RACE) of zebrafish twist1b
17
Assembly of zebrafish twist1b full-length cDNA
20
ii
2.4
Genomic sequence of zebrafish twist1b
21
2.5
RT-PCR
22
2.6
Synthesis of RNA probes for in situ hybridization
analysis
2.6.1
Identification of unique 3’UTR sequences of the zebrafish
twist gene family
2.6.2
23
23
Isolation of unique 3’UTR sequences of zebrafish twist
gene family
23
2.6.3
Linearization of plasmid DNA
28
2.6.4
RNA labeling with Digoxenin / Fluorescein RNA
labeling kits (SP6/T7/T3)(Roche)
29
2.6.5
Purification of RNA probe
29
2.7
Whole mount in situ hybridization
30
2.8
Cryosection
34
2.9
Image processing
35
2.10
Phylogenetic analysis
35
2.10.1
Alignment and phylogenetic tree
35
2.10.2
Calculation of genetic distances
36
2.10.3
Comparative synteny analysis
37
Chapter 3:
Results
38
3.1
Characterization of zebrafish full-length cDNA of
twist1b
38
3.2
Genomic organization of zebrafish twist1b
39
3.3
Alignment of TWIST family peptides
41
3.4
Comparison and alignment of zebrafish twist gene
family
3.5
41
Identification and confirmation of the true orthologs
of zebrafish twist genes
47
3.5.1
Comparison of zebrafish twist gene family with other species
47
3.5.2
Phylogenetic analysis
48
iii
3.5.3
Calculation of genetic distances
50
3.5.4
Comparative synteny analysis
51
3.6
Embryonic expression patterns of the zebrafish twist
gene family
58
3.6.1
RTPCR analysis
58
3.6.2
In situ hybridization analysis
60
Chapter 4:
Discussion
76
4.1
The zebrafish twist gene family
76
4.2
Phylogenetic relationships of the twist genes in fish
77
4.3
Genetic distance analysis of twist1a and twist1b among
the fishes
78
4.4
Comparative synteny analyses
79
4.5
Comparison of zebrafish twist family expression pattern
with other species.
83
4.5.1
Zebrafish twist1a and twist1b genes
83
4.5.2
Zebrafish twist2
85
4.5.3
Zebrafish twist3
86
4.6
Shared and unique expression sites of the zebrafish
twist genes
86
4.6.1
Importance of using unique 3’UTR sequences as riboprobes
86
4.6.2
Comparison of zebrafish twist genes expression sites
with other publications
86
4.7
Evolutionary fates of the zebrafish twist gene family
91
Chapter 5:
Conclusions
94
Chapter 6:
References
95
iv
Acknowledgement
________________________________________________________________________
Firstly, I thank God for the strength and perseverance that have sustained me through
this research project. Thank God for His wisdom and for directing my path.
My utmost gratitude goes to my supervisor, Assoc Prof Samuel Chong for giving me the
opportunity to further my studies in his lab. Thank you for your kind understanding,
encouragement and patient supervision to me.
Special thanks to Assoc Prof Christoph Winkler for your constructive advice, for sharing
with me your invaluable knowledge. Your help is very much appreciated.
Thank you Prof Byrappa Venkatesh for your enormous help in phylogenetic analyses, for
enlightening me on the topics of evolution and phylogeny, an area which I am very green.
To Assoc Prof Vladimir Korzh, thank you for your precious recommendation and time.
Your insightful advice has been most helpful. Thank you too, for the gifts of pax2.1 and
wt1 plasmids.
To Dr Karuna Sampath, I am very grateful for both your helpful technical advice and
your patient guidance.
Special thanks to Felicia and Ben Jin, for your words of encouragement and support and
for sharing with me your laboratory expertise and personal experiences on time
management as a part-time student.
Big thanks to Haibo, Shanta and Xiaoyu for helping with the care and maintenance of the
fish system. Without your meticulous care, I wouldn’t have healthy embryos and fish for
my project.
To Arnold, Wang Wen, Weijun, Chia Yee, Pooi Eng, Clara, Yvonne, Jack, Siew Hoon and
Victor thanks for the words of encouragement, your friendship and moral support along
the way.
Thanks to Monte Westerfield and Andrew D. Sharrocks for their gifts of dlx2a and fli1a
(pAS160) plasmids respectively.
And last but not least, thanks to my parents, my sisters and Patrick for giving me the love
and support to press on.
v
List of Tables
________________________________________________________________________
Table 1 :
The synthesis of RNA probes and in situ hybridization conditions
Table 2:
Nucleotide identity of the coding region, bHLH domain, and WR domain
of the zebrafish twist genes
Table 3:
Comparison of zebrafish twist gene sequences with TWIST sequences
from other species
Table 4:
Comparative synteny analysis of chromosomal regions around zebrafish
twist1a and twist1b and human TWIST1
Table 5:
Comparative synteny analysis of chromosomal regions around zebrafish
twist1a and medaka twist1a and twist1b
Table 6:
Comparative synteny analysis of chromosomal regions around zebrafish
twist1b and medaka twist1a and twist1b
Table 7:
Comparative synteny analysis of chromosomal regions around twist2 from
zebrafish, human and medaka
Table 8:
Comparative synteny analysis of chromosomal regions around zebrafish
twist3 and medaka twist3a and twist3b
Table 9:
Expression domains of the four zebrafish twist genes
Table 10 :
Twist expression sites in selected species
vi
List of Figures
________________________________________________________________________
Figure 1.1:
Terminologies used to classify homologs
Figure 1.2:
The model of synfunctionalization: a mechanism for gene loss or function
shuffling.
Figure 2.1:
The incomplete cDNA sequence of zebrafish twist1 gene
Figure 2.2:
Agarose gel electrophoresis of 5’ and 3’ RACE experiment
Figure 2.3:
5’ UTR sequences of the zebrafish twist1 (twist1b) gene obtained from
5’RACE experiment.
Figure 2.4:
3’ UTR sequences of the zebrafish twist1 (twist1b) gene obtained from
3’RACE experiment.
Figure 2.5:
The complete full-length cDNA sequence of the zebrafish twist1 gene.
Figure 2.6:
cDNA sequence of zebrafish twist1a
Figure 2.7:
cDNA sequence of zebrafish twist1b
Figure 2.8:
cDNA sequence of zebrafish twist2
Figure 2.9:
cDNA sequence of zebrafish twist3
Figure 3.1:
Full-length cDNA sequence of zebrafish twist1 (twist1b) and its
deduced amino acid sequence.
Figure 3.2:
Genomic DNA sequence of zebrafish twist1 (twist1b).
Figure 3.3:
Alignment of predicted Twist proteins
Figure 3.4:
Alignment of zebrafish full-length cDNAs
Figure 3.5:
Cladogram and unrooted radial tree of Twist proteins generated by the
neighbor-joining method
Figure 3.6:
Gene structure of twist1a, twist1b, twist2 and twist3
Figure 3.7:
RT-PCR of zebrafish twist genes
Figure 3.8:
Expression of zebrafish twist genesexpression during the cleavage period
vii
Figure 3.9:
Expression of zebrafish twist genesexpression during the gastrula period
Figure 3.10:
Expression of zebrafish twist genesexpression during the early
segmentation period
Figure 3.11:
Expression of zebrafish twist genes during mid-somitogenesis
Figure 3.12:
Zebrafish twist expression along the trunk
Figure 3.13:
Zebrafish twist1b and twist3 expression during somitogenesis
Figure 3.14:
Zebrafish twist1b expression in the somites
Figure 3.15:
Expression of zebrafish twist genesexpression during the prim-5 stage
Figure 3.16:
Expression of zebrafish twist genesexpression during the long-pec stage
Figure 3.17:
Expression of zebrafish twist genesexpression during the hatching period
Figure 4.1:
A model for the evolutionary history of twist genes.
viii
Abbreviations
________________________________________________________________________
cDNA
complementary DNA
dNTP
Deoxyribonucleotide triphosphate
UTR
Untranslated Region
PCR
Polymerase Chain Reaction
hpf
hours post fertilization
dpf
days post fertilization
DEPC
diethylpyrocarbonate
SDS
sodium dodecyl sulfate
RACE
Rapid amplification of complementary DNA ends
bHLH
basic Helix-Loop-Helix
WR
tryptophan-arginine
RT
Reverse Transcription
SCS
Saethre-Chotzen Syndrome
ORF
Open reading frame
LG
Linkage Group
ix
Summary
________________________________________________________________________
The Twist gene is essential for development and survival, and is present in
animals ranging from Drosophila to humans, either in single copy or as a gene family of
two to five members. In 2007, a paralog of twist1 was identified by Gitelman, who
renamed the genes according to their relationships with those of other species (Gitelman,
2007).
This study aims to characterize the zebrafish twist family of genes, their
phylogenetic and evolutionary relationships, and their developmental expression profiles.
I performed a comprehensive alignment, phylogenetic and comparative synteny analysis
to determine the relationship of these genes to each other and to those of other species.
Phylogenetic analysis showed that the Twist peptides were clustered into three
clades, with Twist1, Twist2 and Twist3 peptides in each clade. Interestingly, the Twist1b
peptides of the Acanthopterygii (medaka, fugu, spotted green pufferfish and stickleback)
were clustered together with the Twist3 peptides instead of Twist1 peptides whereas
zebrafish twist1a and twist1b peptides were clustered with the Twist1 peptides.
Comparative
nucleotide
substitution
analyses
revealed
a
faster
nucleotide
mutation/substitution in the acanthopterygian twist1b compared to the zebrafish twist1b,
thus explaining the anomalous clustering of the former group of Twist1b peptides.
x
Comparative synteny analysis of the chromosomal regions flanking the zebrafish,
medaka, and human twist genes showed that the zebrafish twist1a and twist1b are coparalogs and co-orthologs of human TWIST1. Furthermore, zebrafish twist1a and twist1b
are orthologous to medaka twist1a and twist1b, respectively, despite the different
phylogenetic clusterings of zebrafish and medaka twist1b. The orthology of zebrafish
twist2 to human and medaka TWIST2/twist2, was also confirmed. Finally, zebrafish
twist3 showed greater chromosomal synteny to medaka twist3b than to the medaka
twist3a. Based on these results, a model for the evolutionary history of the twist genes
has been reconstructed.
I also performed a comprehensive developmental expression analysis of all four
twist genes. All four genes were expressed in the pharyngeal arches. Zebrafish twist1a
and twist1b were expressed in the sclerotome and twist3 in the somite during the
segmentation period. Zebrafish twist1b and twist3 were found to be present as maternal
transcript. Many expression sites were unique. Transcripts of twist1a were detected
specifically in the premigratory neural crest cells during early somitogenesis and in the
heart valve at the hatching period. Zebrafish twist1b was expressed in the intermediate
mesoderm during segmentation period and in the olfactory placode at the hatching period.
Zebrafish twist2 expression was observed in the organizer at the shield stage,
presumptive vasculature during the segmentation period, and in the hypochord and dorsal
aorta during the prim-5 stage. Zebrafish twist1a and twist3 were expressed in the fin bud,
with twist3 expression concentrated in the endochondral disc and twist1a expression
xi
strongest in the actinotrichs. Minimal expression overlap was observed among the four
twist genes using unique 3’UTR sequences for riboprobes.
The contents of this thesis have been published in two paper, “Zebrafish twist1 is
expressed in craniofacial, vertebral, and renal precursors
(Yeo et al., 2007) and
“Phylogenetic and evolutionary relationships and developmental expression patterns of
the zebrafish twist gene family” (reference in press).
xii
Abstract
_____________________________________________________________
Four members of the twist gene family (twist1a, 1b, 2 and 3) are found in the
zebrafish, and they are thought to have arisen through three rounds of gene duplication,
two of which occurred prior to the tetrapod-fish split. Phylogenetic analysis groups most
of the vertebrate Twist1 peptides into clade I, except for the Twist1b proteins of the
acanthopterygian fish (medaka, pufferfish, stickleback), which clustered within clade III.
Paralogies and orthologies among the zebrafish, medaka, and human twist genes were
determined using comparative synteny analysis of the chromosomal regions flanking
these genes. Comparative nucleotide substitution analyses also revealed a faster rate of
nucleotide mutation/substitution in the acanthopterygian twist1b compared to the
zebrafish twist1b, thus accounting for their anomalous phylogenetic clustering. Based on
these analyses, a model for the evolutionary history of the twist genes has been
reconstructed. I observed minimal expression overlap among the four twist genes using
unique 3’UTR sequences for riboprobes, suggesting that despite their significant peptide
similarity, their regulatory controls have diverged considerably, with minimal functional
redundancy between them.
xiii
Chapter 1: Introduction
_____________________________________________________________
1.1
The TWIST gene family
The TWIST genes are a group of transcription factor genes whose peptides contain
two highly conserved domains, the basic helix-loop-helix (bHLH) domain and the
tryptophan-arginine (WR) domain (Atchley and Fitch, 1997; Spring et al., 2000). The
bHLH domain can be found in a number of other proteins and is involved in growth
regulation, myogenesis and neurogenesis (Jan and Jan, 1993). The function of the WR
motif is unclear although it has been suggested to be required either for TWIST activity,
for the stability of its mRNA or for normal protein folding (Gripp et al., 2000; Castanon
and Baylies, 2002).
Twist was first isolated in Drosophila as a zygotic gene involved in the
establishment of dorso-ventral patterning, mesoderm specification and myogenesis
(Thisse et al., 1987; Thisse et al., 1988; Baylies and Bate, 1996). At gastrulation,
homozygous twist mutant embryos were abnormal and failed to differentiate their
mesoderm (Simpson, 1983; Thisse et al., 1987).
Since this initial discovery, Twist
orthologs and paralogs have been identified in many other animal species.
1.1.1 TWIST1
The TWIST1 gene is located on human chromosome 7p21.2 and has been reported
to be the causative gene for Saethre-Chotzen Syndrome. Twist1 has been the most
intensively studied gene among the TWIST gene family and its expression profile has
1
been reported in many species including the mouse (Wolf et al., 1991; Fuchtbauer, 1995;
Stoetzel et al., 1995), rat (Bloch-Zupan et al., 2001), Xenopus (Hopwood et al., 1989;
Stoetzel et al., 1998), chick (Tavares et al., 2001), medaka (Yasutake et al., 2004) and
zebrafish (Rauch, 2003; Germanguz et al., 2007; Yeo et al., 2007).
In the mouse, maternal transcript of Twist1 was first detected in the extraembryonic tissue and embryonic ectodermal cells of the primitive streak (Stoetzel et al.,
1995). As the embryo develops, Twist1 is expressed in the head region, trunk and limbs.
In the head region, transcripts of Twist1 is found in the vicinity of the neural structures,
including the forebrain and area of the nasal placodes, the diencephalon and the optical
vesicles, the rhombencephalon and around the otic vesicles. Furthermore, a high level of
expression was observed in the branchial arches. In the trunk, Twist1 expression is
detected in the sclerotome and somatopleura. In addition, Twist1 expression is also found
in the posterior limb buds and tail, the mesenchyme cells forming the internal ear, face,
lingua and the skin (Wolf et al., 1991; Fuchtbauer, 1995; Stoetzel et al., 1995).
In Xenopus, twist1 is also present as a maternal transcript (Stoetzel et al., 1998).
Expression of twist1 is also detected in head, body and tail region. In the head, twist1
transcript accumulates in the internal mesoderm. In the trunk region, expression of twist1
is detected in the notochord, neural crest, lateral mesoderm and somites (Hopwood et al.,
1989).
2
Expression of Twist1 has also been described in other species including rat
(Bloch-Zupan et al., 2001), chick (Tavares et al., 2001), medaka (Yasutake et al., 2004)
and zebrafish (Tavares et al., 2001; Yasutake et al., 2004; Germanguz et al., 2007; Yeo et
al., 2007).
The functions of Twist1 have been reported in many species. In mouse, Twist1
protein is known to be involved in myogenesis. Mouse Twist1 proteins can interfere with
the activity of myogenic transcription factor MyoD (myogenic determination) and MEF2
(myocyte-enhancing factor 2) by preventing the formation of functional MyoD-E proteins
heterodimers and inhibiting MEF2-mediated transactivation process (Spicer et al., 1996).
In addition, a study done in a metastatic breast cancer mouse model showed that Twist1
is necessary for the onset of metastasis (Yang et al., 2004).
Twist1 is also known to participate in transcription regulation.
It has been
reported that TWIST1 functions as a prometastic oncogene. TWIST1 protein can interact
directly with two independent HAT (histone acetyltransferases) domains of p300 and
PCAF (p300/CBP-associated factor) acetyltransferases via its N-terminus. The binding
of Twist inhibits the acetyltransferase activities of p300 and PCAF, thereby preventing
subsequent histone acetylation process that is essential for unwinding the densely packed
chromatin to allow the access of transcriptional machinery during transcription process
(Hamamori et al., 1999; Massari and Murre, 2000).
3
TWIST1 also plays a role in human osteoblast metabolism. The level of TWIST1
protein can influence osteogenic gene expression and it may act as a master switch in
initiating bone cell differentiation by regulating the osteogenic cell lineages (Lee et al.,
1999).
Twist1 has also been reported to induce epithelial to mesenchymal transition
(EMT) by repression of E-cadherin and induction and regulation of N-cadherin (Yang et
al., 2004; Alexander et al., 2006). Additionally, overexpression of Twist1 has been
described to induce angiogenesis and chromosomal instability (Mironchik et al., 2005).
In knockout mice, the Twist1-/- null mice died at embryonic day 11.5, exhibiting a
failure of neural tube closure specifically in the cranial region. They also had defects in
head mesenchyme, branchial arches, somites, and limb buds, suggesting that Twist1 is
involved in regulating the cellular phenotype and behavior of head mesenchymal cells
that are essential for the morphogenesis of cranial neural tube (Chen and Behringer,
1995). Further studies show that absence of Twist activity in the cranial mesenchyme
region causes improper closure of the cephalic neural tube and this subsequently leads to
a malfunction of the branchial arches in Twist1-/- null mice. The authors later found that
Twist1 activity is required in both the cranial mesenchyme for directing neural crest cells
migration as well as the neural crest cells within the first branchial arch to ensure correct
localization of the progenitor cells. Furthermore, Twist1 is also required for the proper
differentiation of the first branchial arch tissues into bone, muscle, and teeth (Soo et al.,
2002).
4
In medaka twist knockdown morphants, the neural arches were absent.
Subsequent experiments performed suggest that twist is involved in the differentiation
process of sclerotomal cells into neural arch-forming osteoblasts (Yasutake et al., 2004).
1.1.2 TWIST2
Twist2 (previously known as Dermo1) is another family member that is found in
human (Lee et al., 2000), mouse (Li et al., 1995), rat (Maestro et al., 1999), chick (Scaal
et al., 2001), medaka (Gitelman, 2007), Fugu (Gitelman, 2007) and zebrafish
(NM_001005956). Its expression profile has been described in mouse (Li et al., 1995),
chick (Scaal et al., 2001) and zebrafish (Thisse and Thisse, 2004; Germanguz et al.,
2007).
In mouse, Twist2 is expressed in both the sclerotome and dermatome of the
somite, the cranial mesenchymal cells around the nose, pharyngeal arches and tongue,
whiskers, somites, limb and branchial arches (Li et al., 1995). In chick, Twist2 is
expressed in the somites, head mesenchyme, limbs, branchial arches and mesenchyme of
the feather buds (Scaal et al., 2001).
Twist 2 is involved in transcriptional regulation and is a transcriptional repressor
of p65 (an NF-kB subunit) and myocyte enhancer factor 2 (MEF2) (Gong and Li, 2002;
Sosic et al., 2003). A study showed that Twist2 protein bound the E-box consensus
sequence in the presence of E12. Furthermore, Twist2 act as a repressor in Myo-D
mediated transactivation via its C-terminal and HLH domains and has been suggested to
5
regulate gene expression in a subset of mesenchymal cell lineages including developing
dermis (Li et al., 1995; Gong and Li, 2002). Furthermore, Twist2 interacted directly with
MEF2 and selectively repressed MEF2 transactivation domain (Gong and Li, 2002; Sosic
et al., 2003). Additionally, Twist2 has been identified to be an interacting protein with
adipocyte determination and differentiation dependent factor 1 (ADD1)/sterol regulatory
element binding protein isoform (SREBP1c). ADD1/SREBP1c is a transcription factor in
fatty acid metabolism and insulin dependent gene expression. Overexpression of Twist2
specifically suppresses the transcriptional activity of ADD1/SREBP1c by interfering with
ADD1/SREBP1c binding to its target DNA and histone deacetylation (Lee et al., 2003).
Twist2 is also suggested to function as an oncoprotein, antagonizing the activation
of p53-dependent apoptosis in response to DNA damage (Maestro et al., 1999). It is
found that Twist2 is expressed in osteoblastic cells and it possibly act as a negative
regulator of the differentiation of osteoblast (Tamura and Noda, 1999).
1.1.3 Twist 3
A third family member Twist3 is absent in mammals but found in Xenopus, chick,
medaka, stickleback and zebrafish (Gitelman, 2007). In contrast to Twist1 and Twist2,
little is known about the role of Twist3.
6
1.2
Why zebrafish is used as an animal model in this study?
The laboratory mouse Mus musculus has become the predominant model
organism used to study human development, however, the zebrafish Danio rerio has
emerged
as
a
promising
complement
for
embryological,
genetic/genomic,
cellular/biochemical and other functional studies.
The zebrafish was first introduced by George Streisinger as a system for genetic
analysis of vertebrate development (Streisinger et al., 1981; Walker and Streisinger,
1983). Its increased use in research is attributed to the many advantages of the zebrafish.
Firstly, the zebrafish is small in size (up to 6 cm) and thus can be economically
maintained with relative ease in the laboratory compared to mouse and Xenopus.
Secondly, it has a short generation time of about 3 months. Thirdly, zebrafish eggs are
fertilized externally and each mating can generate approximately 100 eggs. In addition,
zebrafish embryos are transparent and develop rapidly. Rudimentary organs such as
eyes, ears, brain and heart can be observed one day after fertilization.
Moreover,
zebrafish form essentially all of the same skeletal and muscle tissue types as their higher
vertebrate counterparts, but in much more simple spatial patterns composed of smaller
numbers of cells and this is achieved within a short period of time (Schilling, 2002).
Furthermore, many of the features that govern craniofacial development in higher
vertebrates are conserved and zebrafish contain craniofacial elements similar to those of
higher vertebrates (Schilling, 2002; Yelick and Schilling, 2002).
7
1.3
Phylogenetics
Phylogenetics is the study of evolutionary history in which the nucleotide
characters in DNA or protein sequences are compared among different species. This is
based on the assumption that closely related organisms have sequences that are similar
and more distantly related organisms have sequences that differs greatly.
These
sequences are known as homologs and they are believed to be inherited from a common
ancestor.
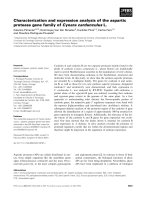
Other terminologies are used to classify homologs. Homologs that are produced
by speciation are known as orthologs. They represent genes that were derived from a
common ancestor that diverged because of divergence of the organism. Orthologs may or
may not have the same functions. Homologs that are produced by gene duplication are
known as paralogs. They represent genes that were derived from a common ancestral
gene that duplicated within an organism and diverged. Paralogs are believed to have
different functions (Figure 1.1). Phylogenetics reconstructs the evolutionary relationship
between species and allows the estimation of the time of divergence between two
organisms since they last shared a common ancestor.
8
Early globin gene
GENE
DUPLICATION
α chain gene
Frog α
Chick α
β chain gene
Mouse β
Mouse α
PARALOG
Chick β
Frog β
PARALOGS
ORTHOLOG
ORTHOLOG
HOMOLOG
Figure 1.1:
Terminologies used to classify homologs. An example of the globin gene.
(Adapted from: />
There are generally two classes of phylogenetic trees, namely, the rooted and
unrooted tree. A rooted tree has a particular node (root), representing a common ancestor
from which a unique path leads to any other nodes. An unrooted tree only specifies the
relationship among species, without identifying a common ancestor or evolutionary path.
1.3.1 DNA or protein sequences?
Both nucleotide characters in DNA and protein sequences are used for
constructing phylogenetic trees, in estimating phylogenetic relationships and times of
divergence among taxa. In general, DNA sequences are used for relatively recent events,
for example, in closely related species such as human and chimpanzee. This is because
the protein sequences between human and chimpanzee are too conserved to be useful
9
(Hedges, 2002). Both the coding and non-coding regions of the DNA sequence can be
used. The rate of mutation is assumed to be the same in both coding and non-coding
regions; however, there is a difference in the substitution rate. It is important to note that
non-coding DNA regions have more substitutions than coding regions.
Proteins are much more conserved since they “need” to conserve their function.
Hence, protein sequences are more useful for more ancient events – for example, in
human and fish – when DNA sequences are usually too divergent to make accurate
estimates on the basis of nucleotide substitutions of DNA (Hedges, 2002).
However, there is a limitation of using either nucleotide or protein sequences
because unequal base or amino acid composition among the genomes of different species
is common. In addition, sequence length is a limiting factor, in that the average gene
(coding) or protein sequence (~1,000 nucleotides, ~350 amino acids) is usually not long
enough to yield a robust phylogeny or time estimate, and therefore many genes and
proteins must be used (Hedges, 2002).
1.4
Gene Duplication
In 1936, Bridges observed gene duplication in a mutant of the fruit fly Drosophila
melanogaster, where the doubling of a chromosomal band results in extreme reduction in
eye size (Bridges, 1936; Zhang, 2003).
Gene duplication is a key mechanism in
evolution. Duplicated genes contribute genetic raw material for the emergence of new
functions through natural selection. Lynch and Conery (2000) reported that there are
10
around 15% of genes in the human genome there are found to be duplicated. The average
rate of duplication of a eukaryotic gene is estimated to be on the order of
0.01/gene/million years, which is of the same order of magnitude as the mutation rate per
nucleotide site (Lynch and Conery, 2003).
A number of mechanisms have been described to attribute gene duplication.
These are unequal crossing over, retroposition, gene conversion and chromosomal (or
genome) duplication (Ohta, 2000; Zhang, 2003; Hurles, 2004). However, depending on
the mode of duplication different outcomes are generated.
Unequal crossing over usually results in tandem gene duplication in which the
duplicated genes are linked in a chromosome. The duplicated region can contain a
portion of a gene, the entire gene or several genes, depending on the exact position of
crossing over (Zhang, 2003).
Retroposition is the integration of reverse transcribed mature RNAs at random
sites in a genome. The resultant duplicated genes, known as retrogenes, usually display
several molecular features such as lack of introns and regulatory sequences, the presence
of poly-A tails and presence of flanking short direct repeats (Zhang, 2003; Hurles, 2004).
In addition, a duplicated gene generated by retroposition is usually unlinked to the
original gene as the insertion of cDNA process is random (Zhang, 2003; Hurles, 2004).
11
Chromosomal (or genome) duplication occurs probably by a lack of disjunction
among daughter chromosomes after DNA replication (Zhang, 2003). Many of these
duplicated segments are located in regions that are hot spots of chromosomal and/or
evolutionary instability (Samonte and Eichler, 2002).
In the TWIST gene family, gene duplication is observed. TWIST1 and TWIST3
genes are found to be duplicated in some species. Duplication of this Twist1 gene
(twist1a and twist1b) has been observed specifically in Actinopterygii (ray-fined fishes)
(Gitelman, 2007). In stickleback and medaka, there are also two copies of the twist3 gene
(Gitelman, 2007).
1.4.1
Evolutionary fates of duplicate genes
The consequences of gene duplication play a key mechanism of evolution as it is
the survival and fitness of the organism harboring the newly duplicated gene/genome that
determine whether either copy of the gene persists or not. Different mechanisms/models
have been described to contribute to different evolutionary fates of duplicate genes.
The nonfunctionalization model explains how one copy of the duplicate genes is
assumed to be redundant and acquires degenerative mutations that eventually eliminate
its function (silenced). The non-functional copy is referred to as pseudogene (Woollard,
2005; Sjodin et al., 2007). Pseudogenes can be classified into processed and unprocessed
pseudogenes.
Processed pseudogenes are generated by the integration of reverse
transcription products of processed mRNA transcript into the genome whereas
12