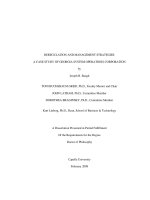
Assessment of technology transfer capability and rd capability the case study of vietnamese food enterprises
Bạn đang xem bản rút gọn của tài liệu. Xem và tải ngay bản đầy đủ của tài liệu tại đây (2.41 MB, 111 trang )
ASSESSMENT OF TECHNOLOGY TRANSFER
CAPABILITY AND R&D CAPABILITY
THE CASE STUDY OF VIETNAMESE
FOOD ENTERPRISES
In Partial Fulfillment of the Requirements of the Degree of
MASTER OF BUSINESS ADMINISTRATION
In INTERNATIONAL BUSINESS
By
Student’s name: Mr: TRAN TAN HOANG VU (MBA03042)
Advisor: PhD. NGUYEN QUYNH MAI
International University - Vietnam National University HCMC
Ho Chi Minh, Viet Nam
September 2012
i
Research_Thesis _HoangVu_03042
ASSESSMENT OF TECHNOLOGY TRANSFER
CAPABILITY AND R&D CAPABILITY
THE CASE STUDY OF VIETNAMESE
FOOD AND ENTERPRISES
Under the guidance and approval of the committee, and approved by all its members,
this thesis has been accepted in partial fulfillment of the requirements for the degree.
Approved:
--------------------------------------------------Chairperson
---------------------------------------
--------------------------------------------------Committee member
---------------------------------------
--------------------------------------------------Committee member
---------------------------------------
Advisor’s signature
Committee member
Committee member
ii
Research_Thesis _HoangVu_03042
iii
Research_Thesis _HoangVu_03042
Acknowledge
To complete this thesis, I have been benefited from the following people:
First of all, I would like to express deep gratitude to my advisor, Dr. Nguyen Quynh
Mai, School of Business, International University, Ho Chi Minh City. As the
research leader, she gave me a chance to join the research project group, and also
gave me great support as effective academic advisory.
I would like to thanks Ms. An, former BA student, who gave me the foundation and a
lot of useful knowledge.
I would like to thank Dr. Tung, Dr. Phuong, Dr. Tuan, Mr. Quang, Ms. An, Mr. Vu,
the research group members in this phase. Without teamworking, I could not get the
chance to interact with many people and learn new knowledge.
I also thank to the Dr. Nguyen Ngoc Hanh, vice president of Chemistry institute; Dr
Le Van Viet Man, Food department of University of Technology; Mr. Dang Van
Lam, R&D Manager from Cautre; Mr. Nguyen Huu Thuy, Technical Manager from
ThienHuong JSC; Dr. Nguyen Tien Hung, General Director of Vimedimex; Mr.
Nguyen Anh Linh, R&D expert from Masan Corporation; Mr. Kha, R&D Manager
of Bibica. These experts gave research group a lot of feedback during our interview.
I would like to express my thanks to Mr. Toan from Bach Khoa University, Ms. Thu
from Business Magazine for supporting research group to collect data.
Last but not least, thank my family, my parents, my wife who give me
encouragement and financial support through the whole course. They have supported
me with all the love and patient.
iv
Research_Thesis _HoangVu_03042
Plagiarism Statements
I would like to declare that, apart from the acknowledged references, this
thesis either does not use language, ideas, or other original material from anyone; or
has not been previously submitted to any other educational and research programs or
institutions. I fully understand that any writings in this thesis contradicted to the
above statement will automatically lead to the rejection from the MBA program at
the International University – Vietnam National University Hochiminh City.
v
Research_Thesis _HoangVu_03042
Copyright Statement
This copy of the thesis has been supplied on condition that anyone who
consults it is understood to recognize that its copyright rests with its author and that
no quotation from the thesis and no information derived from it may be published
without the author’s prior consent.
© Tran Tan Hoang Vu/ MBA03042/2010-2012
vi
Research_Thesis _HoangVu_03042
CONTENTS
List of Table ................................................................................................................ix
List of Figures .............................................................................................................x
Abbreviation ..............................................................................................................xii
Abstract .....................................................................................................................xiii
Chapter One - INTRODUCTION ............................................................................ 1
1. Introduction .......................................................................................................... 1
1.1. Current situation of Vietnamese Technology Competitiveness .................... 1
1.2. Vietnamese food industry ............................................................................. 3
2. Research problem ................................................................................................. 6
3. Research objectives .............................................................................................. 7
4. Scope and limitation............................................................................................. 7
5. Implication ........................................................................................................... 8
6. Organization of the study ..................................................................................... 8
Chapter Two - Literature review ............................................................................. 9
1. Introduction .......................................................................................................... 9
2. Definition ............................................................................................................. 9
2.1. Technology:................................................................................................... 9
2.2. Technology Transfer ..................................................................................... 9
2.3. Technology Transfer Capability ................................................................. 10
2.4. R&D Capability .......................................................................................... 10
3. Role of Technology and Technology Transfer .................................................. 10
4. Components of Technological Capability.......................................................... 12
5. R&D Capabilities ............................................................................................... 15
6. Environmental factors ........................................................................................ 17
7. Effectiveness of Technology Improvement ....................................................... 18
Chapter Three - Research methodology ................................................................ 20
1. Research process ................................................................................................ 20
2. Research model .................................................................................................. 21
3. Measurement design........................................................................................... 22
3.1. TTC factor measurements ........................................................................... 22
3.2. RDC factor measurement ............................................................................ 23
3.3. Innovation Environment factor measurement ............................................. 24
3.4. Effectiveness of Technology Improvement measurements ........................ 25
4. Questionnaire design .......................................................................................... 26
vii
Research_Thesis _HoangVu_03042
4.1. Semi-structure interview design:................................................................. 26
4.2. Questionnaire design ................................................................................... 26
5. Sample size and data collection method ............................................................ 27
5.1. Population & Sample size ........................................................................... 27
5.2. Collection method ....................................................................................... 27
6. Data analysis method ......................................................................................... 28
Chapter Four - Data analysis .................................................................................. 29
1. Sample demongraphic ........................................................................................ 29
2. R&D strategy ..................................................................................................... 31
3. Reliability test .................................................................................................... 34
4. TT Capabilitity description ................................................................................ 34
4.1. Ability to Recognize ................................................................................... 35
4.2. Ability to Acquire ....................................................................................... 36
4.3. Ability to Assimilate ................................................................................... 37
4.4. Ability to Apply and Adapt ......................................................................... 38
5. R&D Capabilities description ............................................................................ 39
5.1. Ability to Innovate ...................................................................................... 39
5.2. Facility capabilities ..................................................................................... 40
5.3. HR Capabilities ........................................................................................... 41
6. Performance description..................................................................................... 42
7. Innovation environment description .................................................................. 44
7.1. Internal environment ................................................................................... 44
7.2. External environment .................................................................................. 45
8. Cluster and Scatter chart .................................................................................... 47
8.1. Method to define weight: ............................................................................ 47
8.2. Trend analysis ............................................................................................. 48
8.3. Cluster analysis ........................................................................................... 51
8.4. Radar charts ................................................................................................. 53
Chapter Five - Conclusion, limitation and Recommendation.............................. 56
1. Conclusion ......................................................................................................... 56
2. Limitation & recommendation for further study ................................................ 57
LIST OF REFERENCES ...........................................................................................58
APPENDIX ………………........................................................................................62
viii
Research_Thesis _HoangVu_03042
List of Tables
Table. 1:
Table. 2:
Table. 3:
Table. 4:
Table. 5:
Table. 6:
Table. 7:
Table. 8:
Table. 9:
Table. 10:
Table. 11:
Table. 12:
Table. 13:
Table. 14:
Table. 15:
Table. 16:
Table. 17:
Table. 18:
Table. 19:
Table. 20:
Table. 21:
Table. 22:
Table. 23:
Table. 24:
Table. 25:
Table. 26:
Table. 27:
Technology Transfer Revenue ................................................................... 2
Food CPI - Data & Forecast ...................................................................... 5
Ability to Recognize ................................................................................ 22
Ability to Acquire .................................................................................... 22
Ability to Assimilate ................................................................................ 23
Ability to Apply and Adapt ..................................................................... 23
Ability to Innovate ................................................................................... 23
Facility Capabilities ................................................................................. 24
Human resource capabilities .................................................................... 24
Internal environment ............................................................................ 25
External environment ........................................................................... 25
TT and R&D investment Performance ................................................ 25
Business number of employees ............................................................ 29
Investment reasons descriptive statistic ............................................... 32
Reliability statistic of measurement factors ......................................... 34
Ability to Recognize descriptive statistic ............................................. 35
Ability to Acquire descriptive statistic................................................. 36
Questionnaire response on Ability to Acquire ..................................... 36
Ability to Assimilate descriptive statistic ............................................ 37
Ability to Apply and Adapt descriptive statistic .................................. 38
Ability to Innovate descriptive statistic................................................ 39
Facility Capabilities descriptive statistic.............................................. 40
HR Capabilities descriptive statistic .................................................... 41
Performance of Technology Improvement descriptive statistic........... 42
Internal Environment descriptive statistic ............................................ 44
Questionnaire response on Internal Environment ................................ 44
External Environment descriptive statistic........................................... 45
ix
Research_Thesis _HoangVu_03042
List of Figures
Fig. 1: The Technology Transfer Effects .................................................................. 1
Fig. 2: Gross production of Food Processing Industry in Vietnam compare to 1994
price (source General Statistic Office, 2010) ............................................................... 5
Fig. 3: Gross production of Food Processing Industry in HCM compare to 1994
price (source General Statistic Office, 2010) ............................................................... 6
Fig. 4: Customer Value Creation through Technological Capability ..................... 11
Fig. 5: Technological progress trajectory (Source: Guan et al. 2006) .................... 12
Fig. 6: New mechanism for transferring technology to China – TDAID (Source:
Wang and Zhou, 1999) ............................................................................................... 12
Fig. 7: Element divisions as part of the supply chain (Source: Martin L. Jackson
and Andy Sloane 2007) .............................................................................................. 13
Fig. 8: Components of absorption capacity (Source: Whangthomkum, 2006) ...... 14
Fig. 9: R&D as a processing system ....................................................................... 16
Fig. 10: Research process ...................................................................................... 20
Fig. 11: Hypothesis Model .................................................................................... 21
Fig. 12: Business ownership types chart ............................................................... 29
Fig. 13: Business number of employees chart....................................................... 30
Fig. 14: R&D/revenue expenditure chart .............................................................. 31
Fig. 15: Technical transfer plan chart.................................................................... 32
Fig. 16: Investment objective – sort by mean ...................................................... 33
Fig. 17: Questionnaire response on investment objective ..................................... 33
Fig. 18: Questionnaire response on Ability to Recognize ..................................... 35
Fig. 19: Ability to Recognize – sort by mean ....................................................... 35
Fig. 20: Ability to Acquire – sort by mean ........................................................... 36
Fig. 21: Questionnaire response on Ability to Assimilate .................................... 37
Fig. 22: Ability to Assimilate – sort by mean ....................................................... 37
Fig. 23: Questionnaire response on Ability to Apply and Adapt .......................... 38
Fig. 24: Ability to Apply and Adapt – sort by mean ............................................. 38
Fig. 25: Questionnaire response on Ability to Innovate........................................ 39
Fig. 26: Ability to Innovate – sort by mean .......................................................... 39
Fig. 27: Questionnaire response on Facility Capabilities ...................................... 40
Fig. 28: Facility Capabilites sort by mean............................................................. 40
Fig. 29: Questionnaire response on HR Capabilities ............................................ 41
Fig. 30: HR Capabilities – sort by mean ............................................................... 42
Fig. 31: Questionnaire response on Performance of Technology Improvement... 43
Fig. 32: TT and R&D Investment Performance sort by mean .............................. 43
Fig. 33: Internal Environment – sort by mean ...................................................... 44
Fig. 34: Questionnaire response on External Environment................................... 46
Fig. 35: External Environment – sort by mean ..................................................... 46
Fig. 36: TTC vs RDC ............................................................................................ 48
Fig. 37: TTC vs Performance ................................................................................ 49
Fig. 38: RDC vs Performance ............................................................................... 50
Fig. 39: TTC vs RDC Cluster chart....................................................................... 51
Fig. 40: TTC vs Performance Cluster chart .......................................................... 52
Fig. 41: RDC vs Performance Cluster chart .......................................................... 53
Fig. 42: TTC vs. business ownership .................................................................... 53
Fig. 43: TTC vs. business size............................................................................... 54
Fig. 44: RDC vs. business ownership ................................................................... 54
x
Research_Thesis _HoangVu_03042
Fig. 45:
RDC vs. business size .............................................................................. 55
xi
Research_Thesis _HoangVu_03042
Abbreviations
ANOVA: Analysis of Variance
BMI: Business Monitor International
EFA: Exploratory Factor Analysis
FFA: Food & Foodstuff Association
FPI: Food Processing Industry
FDI: Foreign Direct Investment
GSO: General Statistic Office
GCR: Global Competitiveness Report
GDP: Gross Domestic Product
HR: Human Resource
IE: Innovation Environment
R&D: Research & Development
RDC: Research & Development Capability
SME: Small and Medium Enterprises
SEM : Structural equation modeling
TT: Technology Transfer
TTC: Technology Transfer Capability
TTE: Technology Transfer Effectiveness, Effectiveness of Technology Improvement
TDAID: Transfer - Digestion - Absorption - Innovation - Dissemination
WEF: World Economic Forum
WTO: World Trade Organization
xii
Research_Thesis _HoangVu_03042
Abstract
Nowaday, Technology Improvement through TT and R&D activities is condition
for enterprises in Food Processing Industry (FPI) to compete in open market. If
enterprises can access their own capability, they can find the suitable strategy to
develop and compete in this fierce market.
The research result indicates that Technology Transfer Capability and R&D
Capability have positive relationship and contributing to Performance of Technology
Improvement. This research also shows the method to assess Technology Transfer
Capability, R&D Capability and Innovation Environment of Vietnamese Food
Processing Enterprises in HCM City. From these results, Vietnamese enterprises
have a lot of missions to improve their Technology level.
xiii
Research_Thesis _HoangVu_03042
CHAPTER ONE - INTRODUCTION
1. Introduction
1.1. Current situation of Vietnamese Technology Competitiveness
According to Global Competitiveness Report (GCR) of World Economic
Forum (WEF) (2011), technology has increasingly become an important element for
the firm to compete and prosper. Whether the technology used has or has not been
developed within national borders, it is irrelevant for its ability to enhance
productivity.
In general, technology can be gained in three ways (Jon-Chau Hong, 1994):
-
Purchasing production techniques;
-
Transferring production techniques;
-
Developing one’s own techniques.
And the Technology Transfer (TT) effect is as below figure:
Fig. 1:
The Technology Transfer Effects
From this study, TT cost more, but it takes shortest time. On the other hand,
purchasing techniques will do little good for industrial upgrading. In short, TT is the
right strategy for developing Technology Capability in term of time and money.
The needs of small and mid-size enterprises (SMEs) in the agricultural and
food sectors are continually changing in the global marketplace. TT is one means of
advancing SMEs to be more competitive in the global marketplace and to embrace
1
Research_Thesis _HoangVu_03042
changes that are critical to their survival. (Michael T. Morrissey, Sergio Almonacid,
2004)
GCR (2011) also points out that Vietnam is lowly ranked in the
Technological Readiness and Innovation index. Particularly, Vietnam is ranked 102
in Availability of latest Technology, 60 in Firm level technology Absorption.
Considering Innovation Index, Vietnam is ranked 62 in University-industry
collaboration in R&D, 87 in Utility patents per million population, and 66 in
Availability of scientists and engineers.
According to the annual report of Vietnam National University – HCM city,
the TT revenue:
Year
2001
2002
2003
2004
2005
2006
2007
2008
2009
2010
2011
Revenue
(bil VND)
46.6
54.7
53.4
57.3
63.1
68.3
69.7
99.5
76.3
86.3
84.3
Source: Vietnam National University – HCM city
Table. 1: Technology Transfer Revenue
This has pointed out that the need in TT (or in a broader view is R&D) is
supreme for the manufacturing enterprises. Especially, we have joined WTO, and if
enterprises cannot compete with foreign products in either cost, quality or model our
businesses will be dead and our economy will be doom in the future.
These are the reasons that many Vietnamese manufacturing enterprises
started to pay attention to investment into TT and R&D. Though they have been
facing with the problem that there is no previous study on which factors would effect
on the effectiveness of TT and R&D activities in Vietnamese environment so many
enterprises are investing unsystematically and ineffectively.
From 1998 to 9/2003, there have been 4800 FDI projects approved, registered
capital of 52.5 bil USD, and there are still 4100 projects with effective capital of
39.87 bil USD. 2170 projects have been operated, and 700 under basic construction.
Among them, about 70% of the projects related to TT or manufacturing new type of
product, but only about 4% Contracted Technology Transfer projects were approved
by law through Ministry of Science and Technology. These approved Contracted
Technology Transfer Project, about 63% are industry project, 26% are Food
Processing project and 11% are in cosmetic. (Hoang Van Cuong, Le Danh Ton)
2
Research_Thesis _HoangVu_03042
Le Net (2006) showed that when buying a new technology, enterprises did
not have enough information, such as which technology was good, bad or backward.
For instance, a plastic company wanted to import a new device. A Hong Kong
company sold that device at two million USD, but then a Korean company sold the
same device at six hundred thousand USD. How could this plastic company find the
precise information in order to buy the device at a good price?
1.2. Vietnamese food industry
Vietnam's FPI is booming. After 20 years of renovation, the socio-economic
development achievements of the country positively impact on people's daily life. The
FPI has tremendous opportunities on the market. At home, people's demand for
processed food is increasing largely and diversely. Currently, the food processing
industry, seen as priority for development, is competitive advantage, market value,
export and resolves labor intensive. From 1995 to date, FPI has accounted for the largest
in the industry, delivered more profit and contribution to the national GDP. The
development of the FPI has also influenced other ancillary and supported other
industries’ development such as: packaging printing industry, packaging industry, frozen
industry, food preservation, animal packaging materials industry, and plastic processing
industry slaughter by-products. In addition, the development of the FPI also supports
growth of agriculture (crops, livestock), transportation, mechanical manufacturing, and
trade and services (distributors such as supermarkets, shops, etc.).
FPI’s products include raw food, processed food and refined food. In
particular, refined FPI benefits and contributes to the economy more. In Vietnam,
due to the level of technology is limited, refined food is still in small number, mainly
used for domestic demand. Exporting to the world market in majority is the crude
product.
According to Foodtexvietnam, Vietnam's FPI comprises around 260 seafoodprocessing plants (the country is a major exporter), with an annual production
capacity of 250,000 tons, 24 slaughter houses and meat-processing plants, 160
beverage plants, 65 fruit- and vegetable-processing plants, manufacturing instant
noodles and 23 confectionery manufacturers. Despite a significant proportion of
processed food being imported, consumption of imported produce remains fairly low
in the country – although it has increased in the main population centers of Ho Chi
Minh City and Hanoi.
3
Research_Thesis _HoangVu_03042
In recent data, Vietnam is an agricultural country with abundant agricultural
raw materials but equipment, agro-processing technologies are capable of
manufacturing exports. This food industry brings high economic effectiveness
because it has the biggest proportion in gross output of industry, for example, the
proportion of food industry in 2010 is 14.17% (Tran Sinh, 2011). Moreover, the
development of this industry helps to develop agriculture. Therefore, FPI is the
priority industry in the growth of Vietnam economy.
According to the Organization of Business Monitor International (BMI), total
food consumption in the Vietnamese market in the period 2009-2014 will increase
67.3%. Especially in 2014, this consumption estimated at 426,997 billion. Average
per capita consumption is estimated at 56.4% (equivalent to 4,537,628) in 2014.
BMI has studied the food consumption data of Vietnam in the second quarter
of 2008, along with data on the expenditure of households of the General Statistics
Office (GSO). These figures reflect spending on food and drinks; however, BMI is
also wary on forecasts by reporting data may have eliminated the low figures
reported by several groups of consumer’s capacity in rural areas. BMI will continue
to check the comparison made by the GSO data with other sources of information to
be the most accurate assessment of the prospects of food consumption in Vietnam
during the period from 2005 to 2014.
05
06
07
08
09e
10f
11f
12f
13f
14f
9,93
11,23
12,75
14,6
14,35
14,68
16,75
19,13
21,75
24,75
119,3
133,1
148,9
168,3
163,1
164,6
185,3
208,8
234,3
263,1
14,61
13,12
13,49
14,58
6,36
7,74
14,19
11,16
10,62
10,58
Food
consumption
(billion USD)
Food
consumption per
capita (USD)
Total food
consumption
growth (annual)
4
Research_Thesis _HoangVu_03042
Growth of per
capita food
13,00
11,51
11,9
13
4,92
6,29
12,66
9,68
9,17
9,09
19,44
18,94
18,31
16,23
15,51
14,92
15,14
15,1
14,91
14,8
consumption
(annual)
Food
consumption (%
of GDP)
Excluding drink expense
*: forecasting value – Source: General Statistics Office of Vietnam, BMI
Table. 2: Food CPI - Data & Forecast
Gross production of FPI increases steadily in recent years, and accounting for
around 24% gross production of Processing Industry (Figure 2). Even the percentage
contribution by FPI is declined, it still accounts for nearly 25% gross production of
Processing Industry. This means FPI still plays important role in Vietnam economic.
1000.0
25.00%
826.68
723.95
Thoundsand Billion
800.0
600.0
400.0
200.0
417.81
351.68
497.62
573.68
24.50%
620.34
24.00%
23.50%
86.2
102.1
140.7
121.3
150.8
169.9
198.7
0.0
22.50%
Processing industry
Fig. 2:
23.00%
Food processing industry
Contributed weight of FPI
Gross production of Food Processing Industry in Vietnam compare to
1994 price (source General Statistic Office, 2010)
In HCM City, gross production of FDI also increases in value but the
contribution to Processing Industry has been declined from 17.48% (2005) to 16.25%
(2010) (Figure 3). Market for the majority of the industry's products (except seafood
processing industry) mainly domestic, export markets have not been developed,
present only in the form of the potential. The markets of Southeast Asia, Northeast
Asia is the market that the business involved more than any other export markets.
Participation in the European market, America is not significant due to food products
5
Research_Thesis _HoangVu_03042
of Vietnam do not fully meet the strict regulations on quality, hygiene and food
Thoundsand billion
safety of these countries.
206.05
220
166.68
180
180.23
148.17
140
129.90
114.12
100
60
22.70
21.36
28.03
24.60
30.47
33.49
20
-20
2005
2006
2007
2008
Processing industry
Fig. 3:
2009
2010
Food industry
Gross production of Food Processing Industry in HCM compare to
1994 price (source General Statistic Office, 2010)
2. Research problem
There are many theoretical frameworks all over the world that measure the
Technology Transfer Effectiveness (TTE) and each of them focuses different factors.
There are also journals and a few of research about TT and R&D in Vietnam.
However, none of them study about the acquiring Technology Transfer
Capability (TTC) of small and medium enterprise and R&D performance in Vietnam
food industry. That means there is no research about how transferee’s technology
capability or effectiveness improves after TT, which factors affect their improvement
and the relationship between TTC and RDC.
In previous research phase, TTC was defined as Ability to Recognize, Ability
to Acquire, Ability to Assimilate, Ability to Apply and Adapt, Ability to Innovate.
R&D Capability (RDC) was defined as Facility Capability, Human Resource
Capability, and Investment Capability. However, Technology Capability and RDC
have the relationship and overlapped.
Also from this study, the assessment of TTC and RDC, food enterprises are
willingness to adopt new technology. These enterprises agreed TT is the quickest
way to expand their business.
6
Research_Thesis _HoangVu_03042
However, previous research has not found out how TTC, RDC effect on
Business performance. It has not analyzed the Environment (or the Throughput in
some other research) factor either. More important, on each factor, it has not
developed the measurement scale for each factor.
So that, the purpose of this research is to assess TTC and RDC of Vietnamese
food enterprises. If they can measure their capabilities, they can improve it.
3. Research objectives
For these reason, the objectives of this research are:
-
Develop measurements for TTC, RDC, and Innovation Environment
(IE) factors, Effectiveness of Technology Improvement (TTE).
-
Use these measurements to evaluate TTC, RDC and TTE of Food
companies in HCM, and Vietnamese IE.
-
Explore the relationship between TTC; RDC and TTE.
-
Suggest the solutions for Vietnamese food Enterprise so they can
improve the TTE.
4. Scope and limitation
This research is conducted from July 2012 to January 2012, in Ho Chi Minh
City. This research will only focus on Effectiveness of TT and R&D in Food
industries enterprises. The enterprises ownership modes include state own, joint
venture, joint stock, private, limited liability SMEs.
The acquired sample population is small compare to the number of question
due to the number of business operating in this industry in this region, the time to
collect data (the period business focusing in manufacturing for new year occasion)
and the respondent’s requirement. The list of Vietnamese food enterprises in HCM
city only consists of around 200, and many of them were shut down due to the
economic crisis. That makes the effective list is only around 160.
Besides, many enterprises consider technology as sensitive topic, and they
refused to take part in the survey. These make sample size small, and many statistic
techniques cannot be used to assess the relationship between factors. Instead, this
research will use descriptive statistic to explore these relationships.
7
Research_Thesis _HoangVu_03042
In addition, the questionnaire design uses Likert-scale, and the study is quite
new for respondent, so the respond may be bias.
5. Implication
Firstly, it is expected to find out which factors will be influenced on the TTE
from this research. By exploring these factors, the research can be used for academic
purpose or providing suggestions to the enterprises, which want to invest more into
TT and R&D.
Secondly, from this research, enterprises can assess their TTC and RDC.
Combining their business strategic and these value, they can have they can have the
plan to improve their capabilities.
Thirdly, the finding may provide a good method to evaluate TTE. Vietnamese
businesses can use these to build a KPI system to assess their investment, and do the
research on their own companies to improve based on their environment.
Lastly, by exploring the difficulties of IE, enterprises can work together to
suggest the change in government policy to make us more competitive on our home
ground and supply the domestic demand.
6. Organization of the study
This research is structured and organized in five (5) chapters as follows:
Chapter 1 – Introduction: Introduce the thesis topic and a brief background
about it, followed by the rationale, problem statement, research objectives, research
scope and limitations, significance of the research.
Chapter 2 – Literature Review: presenting the related secondary literature
concerning the TTC, RDC, IE, and the TTE.
Chapter 3 – Research methodology provides detail instrument of the
research process such as Measurement and Question design, Sample, Collecting data
method, Data analysis method: Design the framework; and the procedure and method
for collecting the data used to conduct the research.
Chapter 4 – Discussions and Findings: Analyze collected data and interpret
into initial findings of the research
Chapter 5 – Draw out conclusion and make recommendation, suggestion for
academic and enterprises.
8
Research_Thesis _HoangVu_03042
CHAPTER TWO - LITERATURE REVIEW
1. Introduction
It is important to understand the crucial role of Technology, TT and R&D in
businesses. The investment into TT and R&D will result as the performance of
business. This review is based on relevant published researches on Technology,
Technology Capability and RDC; IE; and the method to evaluate TTE.
2. Definition
2.1. Technology:
Technology: is the application of science or knowledge to commerce and
industry. Technology is, simply, the application of knowledge to solve the problem
or invent useful tools.
Generally speaking, technology can be gained in three ways
(1) Purchasing production techniques;
(2) Transferring production techniques;
(3) Developing one’s own techniques.
2.2. Technology Transfer
Technology transfer: According to business dictionary, technology transfer is: (1)
the assignment of technological intellectual property, developed and generated in one
place, to another through legal means such as technology licensing or franchising; (2)
the process of converting scientific and technological advance into marketable goods
or service.
TT can also be defined as a process of transferring skills, knowledge,
technologies, method of manufacturing, samples of manufacturing and facilities
among identities to ensure scientific and technological developments are accessible
to a wider range of users who can then further develop and exploit the technology
into product, processes, applications, materials or services.
TT implies the movement of physical structure, knowledge, skills, organization,
values, and capital from the site of generation to the receiving site (Mittleman &
Pasha, 1997).
9
Research_Thesis _HoangVu_03042
2.3. Technology Transfer Capability
According to enterprise-architecture’s definition: Technology capabilities are
Conceptual View that defines WHAT technology can do. These often have quite
abstract names but it is important that they do not imply any particular class of
technology or products.
Technology Capability is one of the sources of company competitive advantage.
In paper “The Role of Technological Capabilities in Determining Performance: The
Case of the Upstream Petroleum Industry”, technological capabilities are defined
here as the knowledge and skills required to identify, appraise, utilize and develop
technologies and techniques relevant.
2.4. R&D Capability
RDC is the set of organizing processes and principles that a firm uses to deploy
its resources to develop new products and improve manufacturing processes in
response to the change in external environment (Kogut and Zander, 1992; Grant,
2002)
3. Role of Technology and Technology Transfer
Technology plays a crucial role in economic development. According to Garfield
(1988), in the late 1950s, Robert Solow, the 1987 Nobel Prize in Economic Sciences,
formulated theory of economic growth that emphasized the importance of
technology. He stated that technology-broadly defined as the application of new
knowledge to the production process-is chiefly responsible for expanding an
economy over the long term, even more so than increases in capital or labor.
Technological knowledge is the understanding of the best ways to produce goods and
services (Mankiw, 2003)
The concept of TT has gained much attention and been variously defined by
many scholars and researchers. In 2000, Tarek Khalil defined TT as a process which
permits the flow of technology from a source to a receiver. It means that the source is
the owner or holder of the knowledge, while the recipient is the beneficiary of such
knowledge. TT also mean the transfer of technology know how and expertise.
10
Research_Thesis _HoangVu_03042
Transferring technology is important to economic transformation because it turns
the intellectual value of knowledge into commercial value. Firms can then exploit his
– commercial value and produce high value-added outputs (Ministry of Research
Science and Technology of New Zealand, 2001).
TT is indicated as “the activity leading to the adoption of a new-to-the-user
product or procedure by any user or group of users” by Harder and Benke (2005).
New-to-the-user means any improvement over existing technologies or processes and
not only a recent invention of research result.
Ramanathan (2001) mentioned that all enterprises whether they are large or
SMEs can compete effectively only on the basis of “customer value creation”. His
framework has implied how a firm acquires and deploys technology to create
customer value. The effectiveness of these activities would be determined by the firm
core technological and supportive capability (Panda and Ramanathan, 1997, 1998;
Ramanathan, 1998, 2001)
Fig. 4:
Customer Value Creation through Technological Capability
In this framework, these capabilities are generic and supportive to other
capabilities:
11
Research_Thesis _HoangVu_03042
Capability to plan and manage TT (specify, identify, assess, negotiate,
and finalize the purchase or sale of product, process, and peripheral
technologies from global technology suppliers)
Capability to continuously develop and refine human skills (human
resources development – HRD)
4. Components of Technological Capability
Guan et al. (2006) presented a technological progress trajectory for the catch-up
countries from imitation to innovation that is comprised of acquisition, assimilation
and improvement of technology. Wang and Zhou (1999) considered the role of
foreign enterprises and created a model of “transfer-digestion-absorption-innovationdissemination” (TDAID) in China’s perspective for increasing involvement in
international production and trade activities within a global market.
Acquisition
Fig. 5:
Transfer
Fig. 6:
Assimilation
Improvement
Technological progress trajectory (Source: Guan et al. 2006)
Digestion
Absorption
Innovation
Dissemination
New mechanism for transferring technology to China – TDAID
(Source: Wang and Zhou, 1999)
Martin L. Jackson and Andy Sloane (2007) in research “A model for analyzing
the success of adopting new technologies focuses on electronic commerce”, the four
key elements which are vital to any successful adoption are: process, management,
human resource, and organizational culture. A model were created, showing how
these four elements are totally interactive with one another and in themselves
construct organization, which in turn is part of supply chain as below figure:
12