Changes of temperature data for energy studies over time and their impact on energy consumption and CO2 emissions. The case of Athens and Thessaloniki – Greece
Bạn đang xem bản rút gọn của tài liệu. Xem và tải ngay bản đầy đủ của tài liệu tại đây (460.03 KB, 14 trang )
INTERNATIONAL JOURNAL OF
ENERGY AND ENVIRONMENT
Volume 4, Issue 1, 2013 pp.59-72
Journal homepage: www.IJEE.IEEFoundation.org
Changes of temperature data for energy studies over time
and their impact on energy consumption and CO2 emissions.
The case of Athens and Thessaloniki – Greece
K. T. Papakostas1, A. Michopoulos1, T. Mavromatis2, N. Kyriakis1
1
Process Equipment Design Laboratory, Mechanical Engineering Department, Energy Division,
Aristotle University of Thessaloniki - 54124 Thessaloniki - Greece.
2
Department of Meteorology-Climatology, School of Geology, Faculty of Sciences, Aristotle University
of Thessaloniki - 54124 Thessaloniki - Greece.
Abstract
In steady-state methods for estimating energy consumption of buildings, the commonly used data include
the monthly average dry bulb temperatures, the heating and cooling degree-days and the dry bulb
temperature bin data. This work presents average values of these data for the 1983-1992 and 1993-2002
decades, calculated for Athens and Thessaloniki, determined from hourly dry bulb temperature records of
meteorological stations (National Observatory of Athens and Aristotle University of Thessaloniki). The
results show that the monthly average dry bulb temperatures and the annual average cooling degree-days
of the 1993-2002 decade are increased, compared to those of the 1983-1992 decade, while the
corresponding annual average heating degree-days are reduced. Also, the low temperature bins frequency
results decreased in the 1993-2002 decade while the high temperature ones increased, compared to the
1983-1992 decade. The effect of temperature data variations on the energy consumption and on CO2
emissions of buildings was examined by calculating the energy demands for heating and cooling and the
CO2 emissions from diesel-oil and electricity use of a typical residential building-model. From the study
it is concluded that the heating energy requirements during the decade 1993-2002 were decreased, as
compared to the energy demands of the decade 1983-1992, while the cooling energy requirements were
increased. The variations of CO2 emissions from diesel oil and electricity use were analog to the energy
requirements alterations. The results indicate a warming trend, at least for the two regions examined,
which affect the estimation of heating and cooling demands of buildings. It, therefore, seems obvious
that periodic adaptation of the temperature data used for building energy studies is required.
Copyright © 2013 International Energy and Environment Foundation - All rights reserved.
Keywords: Climate change; Cooling; CO2 emissions; Degree-days; Energy consumption in buildings;
Heating; Steady-state methods; Temperature data.
1. Introduction
A climate change seems to be in progress and there is strong evidence that it will continue in the
forthcoming decades. Obviously, this change affects the temperature data used both in designing HVAC
systems and for estimating the energy behavior of buildings.
The temperature data commonly used for simulating the energy behavior of buildings under steady-state
conditions are the monthly average temperatures, according to the ISO 13790 method [1], or the heating
ISSN 2076-2895 (Print), ISSN 2076-2909 (Online) ©2013 International Energy & Environment Foundation. All rights reserved.
60
International Journal of Energy and Environment (IJEE), Volume 4, Issue 1, 2013, pp.59-72
and cooling degree-days at various base temperatures, according to the variable-base degree-days method
[2, 3, 5-7] or, finally, the ambient temperature occurrence frequency according to the bin method [4, 7].
In the present study, these data were determined for the 1983-1992 and 1993-2002 decades and for the
two major cities of Greece. The determination is based on statistical evaluation of hourly measurements
of ambient air dry-bulb temperature over the period 1983 – 2002. The raw data were obtained from the
meteorological stations of the National Observatory of Athens (NOA) [8] and of the Aristotle University
of Thessaloniki (AUTh) [9]. The results for the two decades are compared and the existing differences
are discussed.
2. Temperature data analysis
2.1 Air temperature
Average temperature is a prime climate indicator and the basis for calculations of heating and cooling
energy demand [1] or for estimating bin data and heating and cooling degree-days at any base [2, 10, 11].
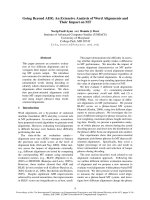
Table 1 shows the monthly and yearly average ambient dry-bulb temperatures for the two cities and for
the two decades, as well as for the twenty year period of 1983-2002. The values of the two decades for
the two cities are plotted in Figure 1. As it can be clearly seen, the values of the 1993-2002 decade are
increased, compared to the corresponding values of the 1983-1993 decade, in both cities.
During summer, the increase ranges from 0.66 K (2.82%) in September to 1.92 K (7.85%) in June for
Athens and from 0.61 K (2.36%) in July to 0.91 K (3.91%) in June for Thessaloniki. Only in
Thessaloniki in September the average temperature is reduced by 0.23 K (1.04%).
During winter, the increase ranges from 0.29 K (3.08%) in January to 1.17 K (12.52%) in February for
Athens and from 0.21 K (3.43%) in January to 0.98 K (14.21%) in February for Thessaloniki. Only in
April and for both cities, a slight decrease of the average temperature is observed (0.02 K or 0.15% in
Athens and 0.41 K or 2.84% in Thessaloniki).
The summer time temperature increase in the second decade is supported by the warming trends in the
daily temperature data of these two stations reported in previous research [12]. The warming trends
initiated in 1996 in Thessaloniki and 1998 in Helliniko (Athens). This study linked the observed positive
trends during summer in Greece to a significant positive pressure trend in the eastern and south-eastern
parts of the Mediterranean, indicating a less frequent expansion of the low pressure over the area and
therefore a weakening of the Etesian winds and a subsequent summer temperature rise.
Between the two decades, the annual average temperature of the two cities results increased by 1 K
(5.4%) in Athens and by 0.6 K (3.1%) in Thessaloniki (Table 1).
The above findings clearly suggest a climate change trend, the last decade being characterized by milder
winters and hotter summers, already reported elsewhere [13, 23]. Although these results are consistent
with general warming of the world climate system, there are also other effects that undoubtedly
contribute, such as increased urbanization of large cities. In the present analysis it is not attempted to
determine the reasons for the changes.
Table 1. Mean monthly ambient temperature for Athens and Thessaloniki
Period
Jan.
Feb.
Mar.
Apr.
May
Jun.
Jul.
Aug.
Sep.
Oct.
Nov.
Dec.
Annual
1983-1992
9.44
9.32
11.47
15.77
19.93
24.42
27.13
26.77
23.50
18.32
13.88
10.13
17.50
Athens
1993-2002
9.73
10.48
11.97
15.74
21.34
26.34
28.79
28.30
24.16
19.43
14.64
11.18
18.50
1983-2002
9.58
9.90
11.72
15.75
20.63
25.38
27.96
27.53
23.83
18.87
14.26
10.65
18.00
1983-1992
6.13
6.86
9.83
14.58
18.86
23.31
25.93
25.53
21.92
16.16
10.91
6.60
15.55
Thessaloniki
1993-2002
6.34
7.84
10.06
14.17
19.62
24.22
26.54
26.17
21.69
16.85
11.58
7.47
16.05
1983-2002
6.23
7.35
9.95
14.38
19.24
23.76
26.23
25.85
21.80
16.50
11.24
7.03
15.80
ISSN 2076-2895 (Print), ISSN 2076-2909 (Online) ©2013 International Energy & Environment Foundation. All rights reserved.
International Journal of Energy and Environment (IJEE), Volume 4, Issue 1, 2013, pp.59-72
61
30
THE '83-'92
ATH '83-'92
28
THE '93-'02
ATH '93-'02
Ambient Temperature [°C]
26
24
22
20
18
16
14
12
10
8
6
4
Jan
Feb
Mar
Apr
May
Jun
Jul
Aug
Sep
Oct
Nov
Dec
Month
Figure 1. Mean average temperature of 1983-1992 and 1993-2002 decades for Athens and Thessaloniki
It is reminded at this point that the results of this work are based on actual continuous temperature
measurements over the last 20 years in both cities, a period sufficiently long to ensure representativeness,
including also the recent changes in climate and/or local conditions. It can therefore safely be suggested
that the average temperature values of the twenty-year period 1983-2002 should be used for energy
studies in the two cities.
2.2 Degree-days
Using outdoor air temperature hourly average values to, h
( )
of the 1983÷2002 period, the heating
(October to April) and cooling (June to September) degree-days (HDD and CDD, respectively) were
calculated (base temperatures 10÷20°C and 20÷28°C, respectively) for both cities.
The total number of heating degree-days for a month was calculated as:
HDD( t bal
1 HR
)=
∑( t bal - t o ,h )+
24 i =1
(1)
where HR is the number of hours of the month and tbal the base temperature. The “+” sign indicates that
only positive values are summed.
Respectively the total number of cooling degree-days for a month was calculated as:
CDD( t bal
1 HR
)=
∑( t o ,h - t bal )+
24 i =1
(2)
The yearly HDD and CDD were calculated by summing the monthly values.
Indicatively, and for base temperatures 15°C for heating and 24°C for cooling (the usual balance
temperatures of buildings with average internal and solar thermal gains, insulated according to Greek
Regulation for Building Insulation), the results are plotted in Figures 2 (for Athens) and 3 (for
Thessaloniki).
As it can be clearly seen in Figures 2 & 3, there is a marked reduction trend of HDD and increase trend
of CDD, especially after the year 1996. From 1996 onwards, the annual HDD systematically result lower
and the CDD higher than the respective 20-year average.
ISSN 2076-2895 (Print), ISSN 2076-2909 (Online) ©2013 International Energy & Environment Foundation. All rights reserved.
62
International Journal of Energy and Environment (IJEE), Volume 4, Issue 1, 2013, pp.59-72
In Tables 2 and 3 the monthly HDD for Athens and Thessaloniki respectively are given, while Tables 4
and 5 show the monthly CDD for the two cities.
Each Table contains data of the two decades, namely 1983-2002 and 1993-2002, and of the twenty year
period 1983-2002 as well. It is clearly seen that the monthly as well as the yearly values of HDD were
reduced in the second decade, while the monthly and yearly values of CDD were increased. The
reduction in the yearly values of HDD was in the range of 9.5 to 22% in Athens, and in the range of 5 to
9% in Thessaloniki, depending on the base temperature, with the highest changes observed at the lowest
base temperatures. The increase of the yearly values of CDD was in the range of 25 to 53% in Athens,
and in the range of 10 to 16% in Thessaloniki, depending on the base temperature, with the highest
changes observed at the highest base temperatures. The above results confirm the aforementioned
indication of climate change towards milder winters and hotter summers, in line with the general
reduction of HDD and increase of CDD reported by the Norwegian Meteorological Institute for Europe,
based on data of 63 measuring locations [14]. As in the case of average temperatures, it is recommended
to use the average HDD and CDD values of the twenty-year period 1983-2002, for energy studies in the
two cities.
900
Heating Degree Days - Tbal 15°C
Cooling Degree Days - Tbal 24°C
800
Heating av. 1983 - 2002
Degree Days [Kdays]
700
600
500
400
Cooling av. 1983 - 2002
300
200
100
2002
2001
2000
1999
1998
1997
1996
1995
1994
1993
1992
1991
1990
1989
1988
1987
1986
1985
1984
1983
0
Year
Figure 2. Heating and cooling degree days during 1983-2002 for Athens
1400
Heating Degree Days - Tbal 15°C
Cooling Degree Days - Tbal 24°C
1200
Degree Days [Kdays]
Heating av. 1983 - 2002
1000
800
600
400
200
Cooling av. 1983 - 2002
2002
2001
2000
1999
1998
1997
1996
1995
1994
1993
1992
1991
1990
1989
1988
1987
1986
1985
1984
1983
0
Year
Figure 3. Heating and cooling degree days during 1983-2002 for Thessaloniki
ISSN 2076-2895 (Print), ISSN 2076-2909 (Online) ©2013 International Energy & Environment Foundation. All rights reserved.
International Journal of Energy and Environment (IJEE), Volume 4, Issue 1, 2013, pp.59-72
63
Table 2. Monthly heating degree days to various temperature bases – Athens, Greece.
Month
Oct.
Nov.
Dec.
Jan.
Feb.
Mar.
Apr.
Total
Base
Temperature
18
16
14
12
10
18
16
14
12
10
18
16
14
12
10
18
16
14
12
10
18
16
14
12
10
18
16
14
12
10
18
16
14
12
10
18
16
14
12
10
1983 – 1992
47
22
9
2
0
131
84
46
21
7
244
184
128
80
44
266
204
146
95
54
243
189
137
92
56
206
150
100
60
32
90
50
23
8
2
1227
883
589
358
195
Period
1993 – 2002
31
14
5
1
0
114
70
38
18
7
212
153
100
59
31
257
195
138
87
48
213
159
110
67
36
193
139
92
54
28
91
52
25
10
3
1111
782
508
296
153
1983 – 2002
39
18
7
2
0
122
77
42
20
7
228
168
114
70
37
261
200
142
91
51
229
175
124
80
46
199
145
96
57
30
90
51
24
9
3
1168
834
549
329
174
These changes in degree-days obviously affect directly the energy consumption of the buildings by
increasing the cooling and decreasing the heating energy demands calculated, changes already reported
in the relevant literature [15-28]. Other critical parameters influenced by the above mentioned climate
change are the temperature design conditions, the design loads and obviously the size and capacity of the
HVAC equipment [29, 30].
ISSN 2076-2895 (Print), ISSN 2076-2909 (Online) ©2013 International Energy & Environment Foundation. All rights reserved.
64
International Journal of Energy and Environment (IJEE), Volume 4, Issue 1, 2013, pp.59-72
Table 3. Monthly heating degree days to various temperature bases - Thessaloniki Greece.
Month
Oct.
Nov.
Dec.
Jan.
Feb.
Mar.
Apr.
Total
Base
Temperature
18
16
14
12
10
18
16
14
12
10
18
16
14
12
10
18
16
14
12
10
18
16
14
12
10
18
16
14
12
10
18
16
14
12
10
18
16
14
12
10
1983 – 1992
90
53
28
12
4
215
159
108
67
37
354
292
231
171
117
368
306
245
186
130
312
257
203
152
106
256
198
143
95
57
118
74
39
16
5
1713
1339
997
699
456
Period
1993 – 2002
74
42
22
10
4
196
143
96
59
33
327
266
207
151
102
362
300
239
180
125
287
232
179
130
86
249
191
138
91
55
130
85
49
24
10
1625
1259
930
645
415
1983 – 2002
82
48
25
11
4
206
151
102
63
35
340
279
219
161
109
365
303
242
183
128
301
246
192
142
97
252
194
141
93
56
124
79
44
20
7
1670
1300
965
673
436
In the framework of this study, the dry-bulb temperature design conditions for the cold and warm season
were calculated in the two cities, using the same period of recordings, namely the years from 1983 to
2002. The annual dry-bulb design conditions are listed in Table 6. These are [2]:
- The dry-bulb temperature corresponding to 99.6 and 99.0% annual cumulative frequency of occurrence
(cold conditions), ºC.
- The dry-bulb temperature corresponding to 0.4, 1.0 and 2.0% annual cumulative frequency of
occurrence (warm conditions), ºC.
- The daily temperature range for hottest month, ºC (defined as mean of the difference between daily
maximum and daily minimum dry-bulb temperatures for hottest month).
ISSN 2076-2895 (Print), ISSN 2076-2909 (Online) ©2013 International Energy & Environment Foundation. All rights reserved.
International Journal of Energy and Environment (IJEE), Volume 4, Issue 1, 2013, pp.59-72
65
Table 4. Monthly cooling degree days to various temperature bases - Athens Greece
Month
Jun.
Jul.
Aug.
Sep.
Total
Base
Temperature
20
22
24
26
20
22
24
26
20
22
24
26
20
22
24
26
20
22
24
26
1983 – 1992
139
91
55
29
222
162
110
69
210
151
100
61
113
71
41
21
684
475
306
180
Period
1993 – 2002
192
138
92
56
272
211
153
103
257
196
139
91
131
83
48
25
852
628
432
275
1983 – 2002
165
114
73
43
247
187
132
86
234
174
119
76
122
77
44
23
768
552
368
228
Table 5. Monthly cooling degree days to various temperature bases - Thessaloniki Greece
Month
Jun.
Jul.
Aug.
Sep.
Total
Base
Temperature
20
22
24
26
20
22
24
26
20
22
24
26
20
22
24
26
20
22
24
26
1983 – 1992
114
74
43
23
186
132
87
53
174
121
79
47
84
51
28
13
558
378
237
136
Period
1993 – 2002
137
92
56
30
205
149
100
62
193
136
90
54
79
48
25
12
614
425
271
158
1983 – 2002
125
83
50
26
196
140
94
58
184
129
84
50
82
49
27
12
587
401
255
146
Values of ambient dry-bulb temperature corresponding to the various annual percentiles, represent the
value that is exceeded on average by the indicated percentage of the total number of hours in a year
(8760). The 0.4, 1.0, and 2.0% values are exceeded on average 35, 88, and 175 h per year, respectively,
for the period of record. The design values occur more frequently than the corresponding nominal
percentile in some years and less frequently in others. The 99.0 and 99.6% (cold season) values are
ISSN 2076-2895 (Print), ISSN 2076-2909 (Online) ©2013 International Energy & Environment Foundation. All rights reserved.
66
International Journal of Energy and Environment (IJEE), Volume 4, Issue 1, 2013, pp.59-72
similarly defined but they are usually viewed as the values for which the corresponding temperature is
lower than the design condition for 88 and 35 h, respectively. Simple design conditions were obtained by
binning hourly data into frequency vectors, then deriving from the binned data the design condition
having the probability of being exceeded a certain period of time. Coincident temperature ranges were
also obtained by double binning daily temperature ranges (daily maximum minus daily minimum) versus
maximum daily temperature.
It is worth to be mentioned that these design data from the meteorological stations of NOA and AUTh
are not included neither in the climate data of ASHRAE [2] nor of the Hellenic Regulation on Energy
Efficiency of Buildings (KENAK) [31].
Table 6. Annual dry-bulb design conditions for Athens (NOA) and Thessaloniki (AUTh)
City
Latitude
Longitude
Elevation [m]
Heating DB [ºC]
99.6%
99%
Cooling DB [ºC]
0.4% 1%
2%
Daily
range[ºC]
Athens
37º58’
22º57’
107
1.5
3.1
36.2
34.6
33.3
9.5
Thessaloniki
40º37’
23º43’
31
-2.5
-1.0
34.3
32.9
31.7
10.4
2.3 Temperature bins
The cumulative results for the frequency of occurrence (in h) of 2.8 K (5°F)-wide temperature bins per
period (summer, winter and intermediate) are shown in Figures 4-6 for Athens and 7-9 for Thessaloniki
for the two decades.
The winter period, during which the buildings need heating, includes the months November to April.
Similarly, the summer period, during which cooling is required, consists of the months June to
September, the remaining months (May and October) forming the intermediate period, during which
neither heating nor cooling is needed. It can be clearly seen that, for both cities and for all periods, a
reduction of the low and an increase of the high temperature bins is observed between the 1983-1992 and
1993-2002 decades.
Based on the data presented in Figures 4-9, considering the median temperature as representative of the
bin temperature range and by neglecting bin values lower than 100 h, the percentage change of the
frequency of occurrence of each temperature range between the two decades for both cities and for the
energy consuming periods is calculated. The results are shown in Figure 10.
It can be clearly seen that there is a fairly good linear correlation of occurrence frequency change with
temperature. All four regression lines have positive slopes, meaning that the increase of occurrence
frequency in the 1993-2002 decade, compared to that of 1983-1992, increases with the temperature level.
For the same period (winter or summer), the slopes for Athens are steeper than those for Thessaloniki, an
observation confirming this conclusion, since Athens is located southern and evidently the temperatures
observed are higher.
This conclusion is further confirmed by the comparison of winter and summer slopes of the same city,
the latter, which obviously corresponds to significantly higher temperatures, being notably steeper.
1200
Decade 1983-1992
Decade 1993-2002
Hours of Occurence
1000
800
600
400
200
8.
0
5.
2
.2
/2
25
2.
4
.4
/2
22
9.
6
.6
/2
19
6.
8
.8
/1
16
4.
0
.0
/1
14
1.
2
.2
/1
11
5.
6
2.
8
8.
4
4/
1
8.
5.
6/
2.
8/
0.
0/
-2
.8
/
0.
0
0
Temperature Bin [°C]
Figure 4. Temperature bins hours of occurrence. Decades 1983-1992 and 1993-2002. Athens – Heating
period (November to April)
ISSN 2076-2895 (Print), ISSN 2076-2909 (Online) ©2013 International Energy & Environment Foundation. All rights reserved.
International Journal of Energy and Environment (IJEE), Volume 4, Issue 1, 2013, pp.59-72
800
Decade 1983-1992
Decade 1993-2002
700
Hours of Occurence
67
600
500
400
300
200
100
42
.0
.2
39
.2
/
4/
36
.
.6
39
/3
6.
4
6
33
28
.0
30
.8
/3
/3
3.
0.
8
0
28
.
5.
2
22
.4
25
.2
/
/2
22
.4
19
.6
/
8/
16
.
14
.0
/
16
.8
19
.6
0
Temperature Bin [°C]
Figure 5. Temperature bins hours of occurrence. Decades 1983-1992 and 1993-2002. Athens – Cooling
period (June to September)
400
Decade 1983-1992
Decade 1993-2002
Hours of Occurence
350
300
250
200
150
100
50
0.
3.
6
8
0
8.
28
30
.8
.0
/3
/3
/2
.2
25
16
19
22
.4
.6
/2
/2
5.
2.
2
4
6
9.
.8
/1
14
.0
11
/1
6.
4.
.2
/1
11
4/
8.
8
0
.2
0
Temperature Bin [°C]
Figure 6. Temperature bins hours of occurrence. Decades 1983-1992 and 1993-2002. Athens –
Intermediate period (May and October)
1000
Decade 1983-1992
Decade 1993-2002
900
Hours of Occurence
800
700
600
500
400
300
200
100
5.
22
.4
/2
/2
.6
19
.8
16
2
4
2.
6
/1
6.
/1
14
.0
/1
.2
11
9.
8
0
4.
11
.2
4/
8.
.4
5.
6
/8
.6
/5
2.
8
/2
.8
0.
0
.8
/0
-2
-5
.
6/
-2
.
8
.0
0
Temperature Bin [°C]
Figure 7. Temperature bins hours of occurrence. Decades 1983-1992 and 1993-2002. Thessaloniki –
Heating period (November to April)
ISSN 2076-2895 (Print), ISSN 2076-2909 (Online) ©2013 International Energy & Environment Foundation. All rights reserved.
68
International Journal of Energy and Environment (IJEE), Volume 4, Issue 1, 2013, pp.59-72
800
Decade 1983-1992
Decade 1993-2002
Hours of Occurence
700
600
500
400
300
200
100
36
.4
/3
9.
2
33
.6
/3
6.
4
30
.8
/3
3.
6
28
.0
/3
0.
8
25
.2
/2
8.
0
22
.4
/2
5.
2
19
.6
/2
2.
4
16
.8
/1
9.
6
14
.0
/1
6.
8
0
Temperature Bin [°C]
Figure 8. Temperature bins hours of occurrence. Decades 1983-1992 and 1993-2002. Thessaloniki –
Cooling period (June to September)
400
Decade 1983-1992
Decade 1993-2002
Hours of Occurence
350
300
250
200
150
100
50
28
.0
/
30
.
28
.
25
.2
/
.4
/
22
8
0
2
25
.
4
.6
/
19
16
.8
/
19
.
16
.
.0
/
22
.
6
8
0
14
11
.2
/
14
.
2
/1
1.
8.
4
5.
6/
8
.4
0
Temperature Bin [°C]
Figure 9. Temperature bins hours of occurrence. Decades 1983-1992 and 1993-2002. Thessaloniki –
Intermediate period (May and October)
50
WINTER Athens
40
WINTER Thessaloniki
30
SUMMER Athens
SUMMER Thessaloniki
Difference [%]
20
10
0
‐10
‐20
‐30
‐40
‐50
0
5
10
15
20
Temperature [°C]
25
30
35
Figure 10. Percentage differences between the 1983-1992 and the 1993-2002 decades of the temperature
occurrence frequency in both cities. Energy consuming periods
ISSN 2076-2895 (Print), ISSN 2076-2909 (Online) ©2013 International Energy & Environment Foundation. All rights reserved.
International Journal of Energy and Environment (IJEE), Volume 4, Issue 1, 2013, pp.59-72
69
3. Impact of degree-day data change on the energy consumption for heating and cooling and on
CO2 emissions
In order to reach conclusions regarding the effect of temperature data changes on the energy
consumption of buildings, the energy demands of a typical residential building-model were estimated for
heating and cooling. The method used was that of variable base degree-days [2, 3, 5, 6].
The building is a two–story apartment building, with a flat roof, pilotis and two 88 m2 apartments per
floor. The height of every story is 3 m. The openings are distributed on the northern and southern sides of
the building and represent 13% and 33% of the exterior surface respectively. The building sides facing
east and west were considered in touch with open air but without any openings, in the case that adjacent
buildings will be built in the future.
The building insulation is of typical insulating materials available to the Greek market, and the heat
transfer coefficients of the building elements are as close to the Greek Insulation Code as possible.
The interior temperature of the building θint was set constant during all day and equal to 20ºC for the
winter period and 26ºC for the summer period. The rate of the ventilation was assumed equal to 0.5 ach
except for the WC-bathrooms, where it was considered equal to 1.5 ach. The overall heat transfer
coefficient of the building H, as the sum of the transmission heat loss coefficient HT and the ventilation
heat loss coefficient HV, according to EN 12831 [32], was calculated equal to 730 W/K.
The overall efficiency of the heating system assuming an oil-fired boiler was considered equal to 0.85
and the performance factor of the cooling system (A/C units) equal to 2.8. The heat gains from people,
lights and appliances as well as the solar heat gains were calculated according to the Greek regulations
[33, 34].
The energy calculations were performed for all the winter and summer months for the two cities, and the
energy requirements of the building were calculated for heating and cooling with temperature data of the
decade 1983-1992 as well as of the 1993-2002 decade. The total results for the two cities are presented in
Tables 7 and 8. The thermal energy for heating Qht was estimated based on the winter energy
requirements and the overall efficiency of the heating system. Respectively, the electric energy
estimation for cooling Qce was based on the summer energy demand and on the performance factor of the
cooling system. The primary energy for heating Qhp and cooling Qcp were determined from the thermal
Qht and the electric Qce energy, using the conversion factors of 1.1 and 2.9 respectively, according to
[31]. Obviously, the total primary energy Qtot is the sum of Qhp and Qcp.
From the results presented in Tables 7 and 8, it is concluded that for the 1993-2002 decade heating
period, a decrease of the energy requirements of the building is observed in both cities as compared to
the 1983-1992 decade. The percent reduction of energy requirements for heating is 11.3% for Athens and
6.1% for Thessaloniki. On the contrary, for the cooling period of the 1993-2002 decade, an increase of
the energy demands of the building for both cities is observed compared to the 1983-1992 decade. For
Athens the increase in cooling demands is 28.5% and for Thessaloniki 13.2%. Obviously, directly
proportional to the energy demand for heating and cooling is the fuel (diesel oil) and electricity
consumption and hence the CO2 emissions, presented in Tables 9 and 10, for Athens and Thessaloniki
respectively. As it can be seen, the total CO2 emissions were increased (1.8%) in Athens, while in
Thessaloniki were decreased by 2.1%.
Table 7. Energy requirements (kWh) of the model residential building for Athens, calculated with
degree-day data of the 1983-1992 and 1993-2002 decades
Period
Thermal
energy, Qht
[kWhtherm]
Electric
energy, Qce
[kWhel]
Primary energy
for heating, Qhp
[kWh]
Primary energy
for cooling, Qcp
[kWh]
Total primary
energy, Qtot
[kWh]
1983-1992
1993-2002
18239
16176
2407
3093
20063
17794
6981
8970
27044
26764
ISSN 2076-2895 (Print), ISSN 2076-2909 (Online) ©2013 International Energy & Environment Foundation. All rights reserved.
International Journal of Energy and Environment (IJEE), Volume 4, Issue 1, 2013, pp.59-72
70
Table 8. Energy requirements (kWh) of the model residential building for Thessaloniki, calculated with
degree-day data of the 1983-1992 and 1993-2002 decades
Period
Thermal
energy, Qht
[kWhtherm]
Electric
energy, Qce
[kWhel]
Primary energy
for heating, Qhp
[kWh]
Primary energy
for cooling, Qcp
[kWh]
Total primary
energy, Qtot
[kWh]
1983-1992
1993-2002
27651
25961
1894
2144
30416
28557
5492
6218
35908
34775
Table 9. CO2 emissions (kg) of the model residential building for Athens, by the use of diesel oil for
heating and electricity for cooling demands
Period
Oil
[kgCO2]
Electricity
[kgCO2]
Total (Oil+Electricity)
[kgCO2]
1983 – 1992
1993 – 2002
4815
4270
2380
3059
7195
7329
Table 10. CO2 emissions (kg) of the model residential building for Thessaloniki, by the use of diesel oil
for heating and electricity for cooling demands
Period
Oil
Electricity
Total (Οil+Electricity)
[kgCO2]
[kgCO2]
[kgCO2]
1983 – 1992
7300
1873
9173
1993 – 2002
6855
2120
8975
4. Conclusion
The 1983-1992 and 1993-2002 decades temperature data comparison of Athens and Thessaloniki reveals
an increasing trend of the monthly average values, resulting in reduction of the average heating and in
increase of the average cooling degree-days, in reduction of the lower and in increase of higher
temperature bins, all suggesting a climate change towards milder winters and hotter summers. The
increase of the higher temperature bins results to be directly related to the temperature level.
The consequence of the reported trend towards milder winters and hotter summers is the reduction of
energy consumption for heating and the increase of energy consumption for cooling. Analog results are
observed for the CO2 emissions by the use of diesel oil and electricity for heating and cooling. The total
CO2 emissions were slightly increased (1.8%) in Athens, during the 1993-2002 decade, as compared to
the 1983-1992 period, while in Thessaloniki were decreased by 2.1%.
These trends however should be treated with caution and need further investigation, since the decade
time horizon is relative short for drawing solid conclusions regarding the climate and consequently the
estimation of energy demands and CO2 emissions.
In the case the above mentioned trends are confirmed, the climate input data used in energy behavior
calculations and for designing the HVAC systems of buildings, either for winter or for summer
conditions, must be periodically re-examined and reviewed.
References
[1] ISO, International Standard 13790: Energy performance of buildings – Calculation of energy Use
for space heating and cooling, International Organization for Standardization, 2008.
[2] ASHRAE Handbook of Fundamentals, American Society of Heating, Refrigerating and AirConditioning Engineers, Atlanta, USA, 2009.
[3] Papakostas K.T. Estimation of heating energy requirements of residences with the variable-base
degree-day method. Proceedings of 6th National Conference on Renewable Energy Sources,
Volume A. Volos, Greece, Institute of Solar Technology, 1982 (in Greek).
[4] Knebel D. Simplified energy analysis using the modified bin method, Atlanta, USA, ASHRAE,
1983.
ISSN 2076-2895 (Print), ISSN 2076-2909 (Online) ©2013 International Energy & Environment Foundation. All rights reserved.
International Journal of Energy and Environment (IJEE), Volume 4, Issue 1, 2013, pp.59-72
[5]
[6]
[7]
[8]
[9]
[10]
[11]
[12]
[13]
[14]
[15]
[16]
[17]
[18]
[19]
[20]
[21]
[22]
[23]
[24]
[25]
[26]
[27]
71
Claridge D.E., Bida M., Krarti M., Jeon H.S., Hamzawi E., Zwack W., Weiss I. A validation study
of variable-base degree-day heating calculations. ASHRAE Transactions 1987, 93(2), 57-89.
Claridge DE, Krarti M, Bida M. Avalidation study of variable-base degree-day cooling
calculations. ASHRAE Transactions 1987, 93(2), 90-104.
Papakostas K.T. Contribution to the assessment of energy consumption on heating and cooling
systems in Greece, using single and multiple measurement methods. PhD Thesis, Department of
Mechanical Engineering, Aristotle University of Thessaloniki, Thessaloniki, Greece, 2001 (in
Greek).
National Observatory of Athens, Climatological Bulletin. Institute of Meteorology and Physics of
the Atmospheric Environment, 1983-2002.
Meteorological observations of Thessaloniki station, Aristotle University of Thessaloniki, Annual
edition (51-71) of the Department of Meteorology and Climatology, 1982-2002.
Erbs D.G., Klein S.A., Beckman W.A. Estimation of Degree-Days and Ambient Temperature Bin
Data from Monthly-Average Temperatures. ASHRAE J 1983, 25(6), 60-5.
Papakostas K., Bentoulis A., Bakas V., Kyriakis N. Estimation of ambient temperature bin data
from monthly average temperatures and solar clearness index. Validation of the methodology in
two Greek cities. Renewable Energy 2007, 32, 991–1005.
Feidas H., Makrogiannis T., Bora-Senta E. Trend analysis of air temperature time series in Greece
and their relationship with circulation using surface and satellite data: 1950-2001. Theor. Appl.
Climatol. 2004, 79, 185-208.
Founda D., Papadopoulos K.H., Petrakis M., Giannakopoulos C., Good P. Analysis of mean,
maximum, and minimum temperature in Athens from 1897 to 2001 with emphasis on the last
decade: trends, warm events, and cold events. Glob. Planet Change 2004, 44, 27-38.
Benestad R.E., 2008. Heating degree days, cooling degree days and precipitation in Europe.
Norwegian
Meteorological
Institute
report
no.
4/2008
Available
at:
/>Perez-Lombard L., Ortiz J., Pout C. A review on buildings energy consumption information.
Energy and Buildings 2008, 40, 394-8.
Jenkins D., Liu Y., Peacock A.D. Climatic and internal factors affecting future UK office heating
and cooling energy consumptions. Energy and Buildings 2008, 40, 874-81.
Kwok A.G., Rajkovich N.B. Addressing climate change in comfort standards. Building and
Environonment 2010, 45, 18-22.
Papakostas K., Mavromatis T., Kyriakis N. Impact of the ambient temperature rise on the energy
consumption for heating and cooling in residential buildings of Greece. Renewable Energy 2010,
35, 1376-79.
Wang X., Chen D., Ren Z. Assessment of climate change impact on residential building heating
and cooling energy requirement in Australia. Building and Environonment 2010, 45, 1663–82.
Christenson M., Manz H., Gyalistras D. Climate warming impact on degree-days and building
energy demand in Switzerland. Energy Conversion and Management 2006, 47, 671-86.
Gaterell M.R., McEvoy M.E. The impact of climate change uncertainties on the performance of
energy efficiency measures applied to dwellings. Energy and Buildings 200, 37, 982-95.
Frank Th. Climate change impacts on building heating and cooling energy demand in Switzerland.
Energy and Buildings 2005, 37, 1175-85.
Cartalis C., Synodinou A., Proedrou M., Tsangrassoulis A., Santamouris M. Modifications in
energy demand in urban areas as a result of climate changes: an assessment for the southeast
Mediterranean region. Energy Conversion and Management 2001, 42, 1647-56.
Lebassi B., Gonzalez J.E., Fabris D., Bornstein R. Impacts of Climate Change in Degree Days and
Energy Demand in Coastal California. Journal of Solar Energy Engineering 2010, 13, 03100510310059.
Lam J.C., Wan K.K.W., Cheung K.L. An analysis of climatic influences on chiller plant electricity
consumption. Applied Energy 2009, 87, 933-40.
Lam T.N.T., Wan K.K.W., Wong S.L., Lam J.C. Impact of climate change on commercial sector
air conditioning energy consumption in subtropical Hong Kong, Applied Energy 2010, 87, 232127.
Mourshed M., The impact of the projected changes in temperature on heating and cooling
requirements in buildings in Dhaka, Bangladesh. Applied Energy 2011, 88, 3737-46.
ISSN 2076-2895 (Print), ISSN 2076-2909 (Online) ©2013 International Energy & Environment Foundation. All rights reserved.
72
International Journal of Energy and Environment (IJEE), Volume 4, Issue 1, 2013, pp.59-72
[28] Wan K.K.W., Li D.H.W., Pan W., Lam J.C. Impact of climate change on building energy use in
different climate zones and mitigation and adaptation implications. Applied Energy 2012, 97, 274282.
[29] Coley D, Kershaw T. Changes in internal temperatures within the built environment as a response
to a changing climate. Building and Environment 2010, 45, 89-93.
[30] Pilli-Sihvola K., Aatola P., Ollikainen M., Tuomenvirta H. Climate change and electricity
consumption-Witnessing increasing or decreasing use and costs? Energy Policy 2010, 38, 240919.
[31] Joined Minister Decision N. D6/B/oik5825, Government Gazette Issue Β’ 407/9-4-2010.
Regulation on the Energy Efficiency of Buildings. (in Greek).
[32] European Standard EN12831: Heating systems in buildings – Method for calculation of the design
heat load, European Committee for Standardization, 2003.
[33] Technical Directive of the Hellenic Engineers Chamber (TDHEC) 20701-1/2010: HEC, National
analytical values for the calculation of the energy efficiency of buildings and for issuing the energy
efficiency certificate, HEC, 2010 (in Greek)
[34] Technical Directive of the Hellenic Engineers Chamber (TDHEC) 20701-3/2010: Climatic data of
Greek regions, HEC, 2010 (in Greek)
Konstantinos Papakostas received the Mechanical Engineering Diploma in 1981 and the Ph.D in
HVAC Systems Energy Analysis in 2001, both from the Aristotle University of Thessaloniki, Greece.
In 1982 he joined the Mechanical Engineering Department of the Aristotle University of Thessaloniki
where he is currently Assistant Professor. He published numerous papers in National and International
Scientific Journals and has various presentations in National and International Conferences with
published proceedings. His main field of interest is the analysis of energy systems, the design of HVAC
systems and the energy conservation. Dr Papakostas is member of ASHRAE and member of the Greek
Institute of Solar Technology.
E-mail address:
Apostolos Michopoulos obtained his Diploma (M.Sc.) in Mechanical Engineering from the Aristotle
University of Thessaloniki (A.U.Th.) in 2003 and then conducted his Ph.D. research on Ground Source
Heat Pump Systems, which was completed in 2008. His research interests are focused on the study of
vertical ground heat exchangers and ground source heat pumps, energy systems analysis, and energy
efficiency of equipment and processes. He has 12 scientific journal publications in international
journals, 11 contributions in national and international conferences and 15 articles published in
specialized national technical magazines. Dr. Michopoulos has been elected as a Member of American
Society of Heating, Refrigerating, and Air-Conditioning Engineers (ASHRAE), and of the European
Technology Platform on Renewable Heating & Cooling, (RHC-Platform) on Geothermal Technology
Panel. He is also elected as a Junior Member of the International Institute of Refrigeration (IIR), and he is participating in many
technical societies and scientific institutes in Greece.
E-mail address:
Theodoros Mavromatis’ research activities focus on the study of crop–climate relationships, using
data from climate models, in combination with crop modeling and drought indices, under baseline
climate and future projected climate change scenarios. He received his PhD from the University of East
Anglia in 1997. As of 2004 he has been teaching and conducting his research at the department of
Meteorology and Climatology, AUTH, as Assistant Professor. He has published almost 50 papers, 25 of
which on international journals (with an H-factor of 12). His publications have received more than 350
citations from other authors.
E-mail address:
Nikolas Kyriakis is the Director of the Process Equipment Design Laboratory and President of the
Mechanical Engineering Department – Aristotle University of Thessaloniki, Greece. He is also
Chairman of the Greek Institute of Solar Technology. His interests include energy systems analysis,
thermal and physical processes and equipment, internal combustion engines, utilization of renewable
energy sources and de-pollution systems and technology for industrial and mobile applications. He
received his MSc in Mechanical Engineering in 1977 and his PhD in 1985, both from the Mechanical
Engineering Department of the Aristotle University of Thessaloniki – Greece. Prof. Kyriakis has more
than 80 publications in international journals and congresses in the mentioned fields.
E-mail address:
ISSN 2076-2895 (Print), ISSN 2076-2909 (Online) ©2013 International Energy & Environment Foundation. All rights reserved.