Factors affecting the level of cash holding of companies listed in vietnam stock market
Bạn đang xem bản rút gọn của tài liệu. Xem và tải ngay bản đầy đủ của tài liệu tại đây (2.02 MB, 120 trang )
FACTORS AFFECTING THE LEVEL OF CASH HOLDING OF
COMPANIES LISTED IN VIETNAM STOCK MARKET
In Partial Fulfillment of the Requirements of the Degree of
MASTER OF BUSINESS ADMINISTRATION
In FINANCE
By
Mr. Nguyen Nhat Anh
ID: MBA02002
International University - Vietnam National University HCMC
Sep 2014
I
INTERNATIONAL UNIVERSITY
SCHOOL OF BUSINESS
SOCIALIST REPUBLIC OF VIETNAM
Independence - Freedom - Happiness
ASSURANCE QUALIFIED THESIS
Student’s Name:
Nguyen Nhat Anh
Student ID:
MBA02002
Title of Thesis:
Factors affecting the level of cash holding of companies listed in Vietnam
stock market
Advisor: PhD. Duong Nhu Hung
I assure that the content of this thesis has been qualified all requirements for a research paper and
able to participate in the final thesis defense.
Approved by
(Signed)
PhD. Duong Nhu Hung
II
FACTORS AFFECTING THE LEVEL OF CASH HOLDING OF COMPANIES LISTED
IN VIETNAM STOCK MARKET
In Partial Fulfillment of the Requirements of the Degree of
MASTER OF BUSINESS ADMINISTRATION
In Finance
By
Mr. Nguyen Nhat Anh
ID: MBA02002
International University - Vietnam National University HCMC
Sep 2014
Under the guidance and approval of the committee, and approved by all its members, this thesis
has been accepted in partial fulfillment of the requirements for the degree.
Approved:
---------------------------------------------Chairperson
---------------------------------------------Committee member
---------------------------------------------Committee member
--------------------------------------------Committee member
--------------------------------------------Committee member
--------------------------------------------Committee member
III
Acknowledge
First and foremost, I would like to give sincere thanks to my advisor of this thesis, PhD.
Duong Nhu Hung, Lecturer of International University, Vietnam National University, Ho Chi
Minh City (VNU-HCM) for the valuable guidance and advice in such a long way for successful
completion of my thesis within the time frame. He inspired me greatly to work in this thesis with
his initial orientation. His willingness, faith and patience in my abilities always boost my
confidence and motivate me contributed tremendously to this thesis. I highly appreciate when
each time he correct each minor error. Without instructions from PhD. Duong Nhu Hung, I could
neither stick right way to the topic nor find the direction to complete the research.
Secondly, my gratitude goes to all lecturers of the School of Business of International
University, Vietnam National University, Ho Chi Minh City (VNU-HCM), who has made me
familiar, understand and passion on the concepts and knowledge of all courses under MBA
program. Especially, Mr. Lai Tran Thanh Son, Ms. Pham Thi Anh Tho and Mr. Nguyen Hoang
Phu – please receive my thanks for your kind supports when I get stuff with papers.
Finally, I am forever indebted to my parents for their understanding, endless patience and
encouragement when it was most required. I am also grateful to Mr. Ho Huu Tien and Mr. Le
Minh Giac - my classmate in MBA program. My classmates have followed up and supported so
much on quality of thesis. Last but not latest, I want to say thanks to my close friends, Ms. Pham
Mai Tram, Mr. Nguyen Chi Thanh, Ms. Nguyen Phuong Trang, Mr. Nguyen Tran Phuong, and
Ms. La Y Yen for their spirit support. I cannot fulfil this thesis without encourage, and
sometimes criticisms to helps me stand up after failures. Without helps of the particular that
mentioned above, I would face many difficulties while doing this thesis.
IV
Plagiarism Statements
I would like to declare that, apart from the acknowledged references, this thesis either
does not use language, ideas, or other original material from anyone; or has not been previously
submitted to any other educational and research programs or institutions. I fully understand that
any writings in this thesis contradicted to the above statement will automatically lead to the
rejection from the MBA program at the International University - Vietnam National University –
Ho Chi Minh City (VNU-HCM).
V
Copyright Statement
This copy of the thesis has been supplied on condition that anyone who consults it is
understood to recognize that its copyright rests with its author and that no quotation from the
thesis and no information derived from it may be published without the author’s prior consent.
© Nguyen Nhat Anh/ MBA02002/ 2010–2014
VI
Table of content
Acknowledge ........................................................................................................................... IV
Plagiarism Statements ............................................................................................................... V
Copyright Statement ................................................................................................................. VI
Table of content....................................................................................................................... VII
List of tables .............................................................................................................................. X
List of Figures .......................................................................................................................... XI
List of Abbreviations ............................................................................................................... XII
Abstract ................................................................................................................................. XIII
Chapter 1.
Introduction ....................................................................................................... 1
1.1.
Problem Statement .................................................................................................... 1
1.2.
Research Objectives .................................................................................................. 3
1.3.
Research Questions ................................................................................................... 4
1.4.
Research Scope ......................................................................................................... 4
1.6.
Theoretical Framework ............................................................................................. 5
1.7.
Contribution and Implication of Thesis to Business and Society................................ 5
1.8.
Structure of the Thesis .............................................................................................. 6
Chapter 2.
2.1.
Literature Review .............................................................................................. 7
Definitions, Time Value and Reasons for Cash Holding ............................................ 7
2.1.1.
Cash Definitions............................................................................................. 7
2.1.2.
Time Value of Cash........................................................................................ 7
2.1.3.
Reasons for Cash Holding .............................................................................. 8
2.2.
Information Asymmetry Theory and Related Theories .............................................. 9
2.3.
Factors Affecting Cash Holding from Related Theories .......................................... 12
2.3.1.
Size of Business ........................................................................................... 13
2.3.2.
Financial Leverage ....................................................................................... 14
2.3.3.
Liquid Assets Substitutes ............................................................................. 16
2.3.4.
Cash Flow .................................................................................................... 16
VII
2.3.5.
Cash Flow Volatility .................................................................................... 17
2.3.6.
Liability to Bank .......................................................................................... 18
2.3.7.
Dividend Payout ........................................................................................... 20
Chapter 3.
Research Methodology .................................................................................... 24
3.1.
Data Sources ........................................................................................................... 24
3.2.
Data Statistics ......................................................................................................... 26
3.2.1.
Descriptive Statistics .................................................................................... 26
3.2.2.
Univariate Analysis ...................................................................................... 26
3.2.3.
Regression Analysis ..................................................................................... 27
3.2.3.1. Fama-MacBeth Regression Model ............................................................. 28
3.2.3.2. Cross-Sectional Regression Model with Mean Value of Variables ............. 29
3.2.3.3. Pooled Ordinary Least Squares Regression Model with Year Dummy ....... 30
3.2.3.4. Pooled Ordinary Least Squares Regression Model with Year Dummy and
Industry Dummy ....................................................................................................... 31
3.2.3.5. Fixed Effects Regression Model ................................................................. 33
3.2.4.
3.3.
Other Supported Tests for Regression Models .............................................. 34
Determined Dependent and Independent Variables ................................................. 35
3.3.1.
Dependent Variable – Cash .......................................................................... 35
3.3.2.
Independent Variables .................................................................................. 36
3.3.2.1. Size of Business (SIZE) ............................................................................. 36
3.3.2.2. Bank Debt (BANKDEBT) ......................................................................... 36
3.3.2.3. Cash Flow (CFLOW) ................................................................................. 37
3.3.2.4. Cash Flow Violability (CFVOLAT) ........................................................... 37
3.3.2.5. Liquid Assets (LIQ) ................................................................................... 37
3.3.2.6. Dividend (DIVIDEND) .............................................................................. 37
Chapter 4.
4.1.
Data Analysis and Results ................................................................................ 39
Descriptive Statistics............................................................................................... 39
VIII
4.2.
Univariate Analysis................................................................................................. 42
4.3.
Regression Results .................................................................................................. 44
4.3.1.
Fama–MacBeth Regression Model ............................................................... 44
4.3.2.
Ordinary Least Squares Regression with 5 Years Average ............................ 48
4.3.3.
Pooled OLS Regression with Year Dummies ............................................... 50
4.3.4.
Pooled OLS Regression with Year Dummies and Industry Dummies ........... 53
4.3.5.
Fixed Effects Regression Model ................................................................... 56
4.4.
Result from Supporting Tests for Regression Models .............................................. 57
4.4.1.
4.5.
Hausman Test .............................................................................................. 57
Summary of Results ................................................................................................ 59
Chapter 5.
Research Conclusion........................................................................................ 63
5.1.
Conclusion and Implication .................................................................................... 63
5.2.
Limitation of the Study ........................................................................................... 65
5.3.
Future Research ...................................................................................................... 66
References ................................................................................................................................ 68
Appendix.................................................................................................................................. 72
Appendix 1: 98 Listed Companies Chosen ............................................................................ 72
Appendix 2: Secondary Data for Excel and Stata Input ......................................................... 79
IX
List of tables
Table 1: Summary of Previous Studies ..................................................................................... 20
Table 2: List of Industry Dummies ........................................................................................... 31
Table 3: Summary of Formulas for Variables ........................................................................... 38
Table 4: Results from Descriptive Statistics .............................................................................. 39
Table 5: Results from Univariate Analysis ................................................................................ 42
Table 6: Correlations Matrix of Variables from Unvariate Analysis .......................................... 43
Table 7: Results from Fama – MacBeth Regression Model ....................................................... 44
Table 8: VIF Test for Fama-MacBeth Model ............................................................................ 46
Table 9: Results from Ordinary Least Squares Regression with 5 Years Average ..................... 48
Table 10: VIF Test for Cross-Sectional Regression Model........................................................ 49
Table 11: Results from Pooled OLS Regression with Year Dummies ....................................... 50
Table 12: VIF Test for Pooled OLS Model with Year Dummies ............................................... 51
Table 13: Results from Pooled OLS Regression with Year Dummies and Industry Dummies ... 53
Table 14:VIF Test for Pooled OLS with Year and Industry Dummies ....................................... 54
Table 15: Results from Fixed Regression Model ....................................................................... 56
Table 16: Results from Hausman Test ...................................................................................... 57
Table 17: Result Summary of Regression Models ..................................................................... 59
Table 18: Thesis’s Result Summary .......................................................................................... 60
X
List of Figures
Figure 1: Theoretical Framework to Be Applied in This Research .............................................. 5
Figure 2: Selected Regression Models ...................................................................................... 28
Figure 3: Cash Ratio Over Five Years ...................................................................................... 40
Figure 4: % Standard Deviation of Cash Flow over Total Assets .............................................. 41
Figure 5: Graphical Correlation Matrix ..................................................................................... 43
Figure 6: Percentage of Cash Holding in Years Firms Paid Dividend ........................................ 47
Figure 7: Correlations between Cash, Income and Bank Debt ................................................... 47
XI
List of Abbreviations
BANKDEBT: Bank Debt
BVND: Billion Viet Nam Dong (Currency)
CFLOW: Cash Flow
CFVOLAT: Cash Flow Volatility
DF: Degrees of Freedom
EBITDA: Earning Before Interest, Tax, Depreciation and Amortization
EMH: Efficient Markets Hypothesis
EMU: Euro Countries
FV: Future Value of Cash
HNX: Ha Noi Stock Exchange
HOSE: Ho Chi Minh Stock Exchange
LEV: Leverage
LIQ: Liquidity
OLS: Ordinary Least Square Regression
Pooled OLS: Pooled Ordinary Least Square Regression Model
PV: Present Value of Cash
SIZE: Size of Firm
VIF: Variance Inflation Factor
XII
Abstract
Understanding factors affecting the level of cash holding is and has been a challenging
task in finance to reach business objectives. That is the reason why cash management is as much
an integral part of business cycle in any period. Statistical and econometrical models are broadly
used in analysis of specific factors affecting. This paper investigates the factors affecting the
level of cash holding with the combined application of descriptive statistics, univariate analysis
and regression methods such as model Fama–MacBeth, regression using cross-sectional data of
average value, pooled OLS regression with year dummies, pooled OLS regression with year
dummies and industry dummies. This paper also outlines the practical steps which need to be
undertaken to use above methods on companies listed in Vietnam stock market. A framework for
each methodology is drawn up. The emphasis is on analysis trend of factors affecting the level of
cash holding when being put in consideration and explanation with related theories. The main
goal of this study is to present the result of each method and factors affecting the level of cash
holding in order to bring general insights of Vietnam stock market to help individual investors
make decisions.
Keywords: Vietnam stock market, descriptive, univariate, regression, level of cash
holding.
XIII
This page is intentionally left blank.
XIV
Chapter 1. Introduction
The aim of this chapter is to provide the problem background and then to understand the
purpose behind the research and questions, to which this thesis seeks and answer. It also states
goals that the author will seek in respect to both theoretical and practical contribution.
1.1. Problem Statement
The phrase “cash is king” is an expression commonly referred to finance, although its
meaning might not be as simple as this expression suggests. Until now, there are two opposing
views when looking at the level of cash that a company should hold.
For the first view, cash is normally regarded as "just an asset that a firm need to help it to
function” (Atrill & McLaney, 2004, p.124). In order to support for this statement, Berk and
DeMarzo (2011) gave several reasons for a company to hold cash. Those researches believed
that holding cash was one of the essential elements needed for a firm to grow and prosper. Cash
is also considering as the life-blood of any firm and if so without it, the survival is very unlikely.
Every firm needs cash daily to pay its bills and to pay off its liabilities on time, so that it can
survive. The firm can make use of cash to invest; for strategic purposes such as acquisitions; for
a marketing tool; to solve short-term obligations, to pay daily transactions, for repaying its loans,
paying its employees, even to satisfy bank requirements and so on.
Contrary to above arguments, the optimal level of cash holdings in a company should be
zero, Maness and Zietlow (2004) supported. This relates to the old personal saying of Plautus is
that people have to spend cash to earn cash. Instead of holding on cash, a company could has
either invested in a new project to earn a potential return or distributed it among shareholders to
let them invest elsewhere, also this resulting in a potential return. This was not just a theoretical
perspective as around the new millennium increasingly many companies were striving for
decreased cash balance; financial managers globally advocated the benefits of small cash
1
holdings, Mintz (2000) stated. Holding excess cash might lead to a loss of an opportunity that
could have increased the company’s value. With holding high level of cash, it will decrease
earning yield of business indirectly, or even directly, because it does not maximize profit or
potential opportunity from daily transactions or long-term investments. If the management
capability is weak in cash monitoring, it may lead to liquidity crisis, even to bankruptcy. If so,
what factors will decide this optimal level of cash holding by making costs and benefits on
balance?
Company can hold cash for many reasons, short-term or long-term, finance or nonfinance, strategic or operational objectives. No matter what purpose, cash flow shows us how the
company has performed in managing inflows and outflows of cash and provides a sharper
picture of the company's ability to pay bills and creditors, and to finance the growth. Deep
understanding on factors affecting the level of cash holding first, and then implementing
effective cash management solutions are the most popular approach to improve business
performance by now. For this reason, it is very important for every firm to monitor its cash flow
in order to adequate plan expenditures.
The author’s personal opinion is that cash management is always a hot spot for managers.
With context of high inflation and economic downturn in Vietnam currently, high liquidity of
cash will enhance the confidence of investors. Masan group (1,970 bVND); Techcombank
(3,142 bVND); Dam Phu My (3,748 bVND); PetroGas service (3,621 bVND); Vinamilk
(3,101.4 bVND); FPT (1,900 bVND); Bao Viet insurance (2,700 bVND); Hoa Phat group (1,064
bVND) and Hoang Anh Gia Lai group (2,335 bVND) were highlighted as bright spots for cash
management and creating advantage with outstanding profit in their market segments. Looking
into the financial reports at the end of 2011s, many companies cannot have good financial results
like above companies.
The factors, which affect cash holding, are investigated by many authors in the developed
countries. Kim et al. (1998) and Opler et al. (1999) did use data of American companies.
2
Pinkowitz and Williamson (2001) did use data of American, German and Japan. Ferreira and
Vilela (2014) were with Euro companies (EMU); Ozkan and Ozkan (2004) were with the UK
companies; Custodio et al. (2005) and Bates et al. (2009) were with the US companies; and
Meggison and Wei (2012) were with Chinese companies. These researches had been giving
important resources to other researchers, investors and managers.
As summary of financial reports of companies listed in Vietnam stock market from 2009
to 2012, the ratio of cash and cash equivalence over the total asset is decreased from 2009
(9.9%). This ration is lowest in 2011, with 8.9%. However, at the end of 2012 (9.2%), this ratio
grow up, reach to the ratio of 2010 (9.2%). Beside some basic statistics on non-business
magazines, there are few researches on cash management. The empirical studies are actually lack
for demands of researchers and investors.
In the context of Vietnam, rapid changes in business environment, but there are few
academic researches on evaluating the factors that affect level of cash holding in firm. With this
research, the author research and supplements a close analysis to cash management of companies
listed in Vietnam stock market based on historical data. By combining and simulating
approaches of previous empirical researches, the author also expects to provide the answer for
management issue of what factors create strong influences on their cash levels.
1.2. Research Objectives
This research will concentrate on clarifying factors which affect decision of how much cash was
hold by companies listed in Vietnam stock market. The objectives are:
To identify factors that affect the level of cash holding and then measure on their impact
to cash management of companies listed in Vietnam stock market.
To propose recommendations for the management.
3
1.3. Research Questions
This research will provide a practice of 98 companies listed on Vietnam stock market
resulted from related theories. It will focus on two questions:
What firm factors affect the level of cash holding of companies listed on Vietnam stock
market?
What are the implications for cash management on companies listed on Vietnam stock
market?
1.4. Research Scope
Due to time limitation and data availability, this research focuses on companies listed on
two stock exchanges in Vietnam: Ho Chi Minh and Hanoi Stock Exchange. Most of them are
supervised by State Securities Commission of Vietnam.
The data set is mainly extracted from annual consolidated financial reports, which we
have checked for errors. Due to the size and early stage of the stock market, the sample could
only cover in five years and for ninety-eight companies. The methodology part will clearly show
other criteria for selecting and filtering data set
4
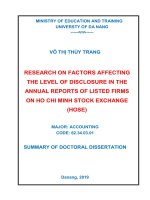
1.6. Theoretical Framework
The author defines framework for this research as below:
Research Objectives
Literature Review
Research Design
Collect Data from HSX and HNX
Data Analysis
Decision and Implication
Conclusion and Recommendation
Figure 1: Theoretical Framework to Be Applied in This Research
1.7. Contribution and Implication of Thesis to Business and Society
This research provides a review of Vietnam stock market based on examining the level of
cash holding and cash management. It suggests an approach allowing local individual investors
to make informed decisions in stock market. A suitable model for analyzing cash holding is
really necessary for any local individual investor to make informed decisions in the local stock
market.
5
1.8. Structure of the Thesis
The research will be in such a way as below. Chapter 1, introduction, will includes the
research problem and the importance of research. It also mentions to research’s scopes,
objectives, questions, structure, and contribution. Chapter 2, literature review, will deal with the
origin, terminology, and reasons why companies want to hold cash. The next part will point out
factors, which affect the level of cash holding predicted by related theories and research’s results
of previous authors, both in foreign countries and Vietnam. Chapter 3, methodology, describes
approaches for statistics. It describes the methods by which the author used to collect primary
and secondary data; as well as how to describes and check variables. Regression methods will be
introduced to show how to analyze dataset; depending on analyzing the advantage and
disadvantage of previous authors and current practice on Vietnam stock market. Chapter 4
discusses results at length and detail. Chapter 5 will be a summary of results, conclusions,
implications and limitation also. The author will focus to answer the main questions mentioned
in the beginning of this research. The author will also initiate several suggestions to make this
research more complete and thorough.
6
Chapter 2. Literature Review
This chapter uses existing concepts, models, formulations and frameworks on the basis of
previous authors and substantially develops own views and insights. It includes two main parts.
First one explains definitions and reasons why companies want to hold cash. The next part
explains factors predicted, which affect level of cash holding, by using financial theories, as well
as presents academic results of previous authors.
2.1. Definitions, Time Value and Reasons for Cash Holding
2.1.1. Cash Definitions
Everyone is actually familiar with the term cash daily, and more generally, the Oxford
online dictionary defines cash as “coins and notes”. According to financial theories, they definite
cash that include cash, short-term securities, and cash equivalences (Opler et al., 1999; Ferreira
& Vilela, 2004; Bates, Bates et al. 2009). Many investors accept as true that cash equivalences
convert into cash in short period.
2.1.2. Time Value of Cash
Time value of cash is one of the most basic principles in finance. “One dollar today is
worth more than a dollar tomorrow” is perhaps one of the most famous quotes in the finance. It
means that if a person should invest one dollar today it will earn interest and will therefore be
worth more the day after. Berk and DeMarzo (2011) postulated that the interest rate would be
dependent on the investment and has to adjust by subtracting the amount of inflation on the
currency. Both investors and companies use the concept of time value of cash in order to
calculate the present as well as the future value (FV) of their operations. For example, they
calculate the present value (PV) of the cost and benefits for a project in order to determine if the
project is profitable or not. Berk and DeMarzo (2011) gave another example to calculate if their
7
current cash level is worth enough to cover their future expenditures. The formula shows the
calculation for PV, which is the present value calculated by the future value FV, the interest i,
and the period n as shown in the formulas. Thus, Maness and Zietlow (2004) postulated that this
leads to the argument that the optimal level of cash that a company should hold is zero, since it is
then considered as an idle resource for the company that do not provide any or little additional
value.
2.1.3. Reasons for Cash Holding
In summary, the four following reasons that companies want to hold cash. The first
reason is for business operating transactions. Businesses do need cash to use for operating
activities business. The demands for cash among different types of firm are also different. For
example, the retail business has available cash in safe box to control operations. In addition,
these businesses need cash to replenish inventory deficits or to pay salaries. Conversely,
Damodaran (2008) confirmed that trades computer software could operate with much smaller
cash balances. The second reason is for reservation motivation. According to Custodio et al.
(2005), a business held cash to finance the activities and investments when no other financial
resources available or too expensive. The firm holds cash to cover unexpected costs and potential
liabilities cannot be determined. For example, Damodaran (2008) confirmed that is cyclical
business to accumulate cash during the economic boom and use that cash in case of recession to
cover deficit from operations. If the firm does not have available liquid assets, the cash flow
shortage can stop investing in the profitable projects. Thus, Ozkan and Ozkan (2004) advised
that keeping cash is to avoid financial cost and depletion. Managers consider this motivation to
hold cash as reservation motivation. The third reason is the agency cost. In public businesses, it
always exist problem between owners and managers. The board will decide whether to return
into stock or to retain in the business. In many businesses, the managers, with available programs
and activities, create funds to help them pursue these programs. Therefore, when the
8
management pays more attention to gain more control over the optimal allocation of resources,
they will accumulation of cash. Damodaran (2008) gave his opinion that it is not for shareholders
but for the purpose of opening wide funds. The management is favorite cash holdings, because
they are afraid of risks. According to Opler et al. (1999), the management holds cash to get
flexibility in pursuing their own goals. The final one is for investing in the future. If the capital
market is efficient, businesses can raise capital to invest in new and potential profitable projects
or other investments that has no transaction costs. However, in reality, businesses must always
face with the limitations of borrowing and the cost to access capital markets. These restrictions
may stem from inside, or can also come from outside the firm, but mostly, from outside the firm.
According to Damodaran (2008), In order to face these challenges, firm must reserve cash
available to cover investment needs in the future. If not, they run into the risk of reject the
project and investment value. The author mainly uses the first two reasons in this study. Two
main theories used to explain factors are the trade-off theory and the pecking order theory.
2.2. Information Asymmetry Theory and Related Theories
In the 1960s, both Fama and Samuelson developed independently the efficient markets
hypothesis (EMH), that market prices fully reflect all available information. In practice,
behavioral economists attributed the imperfections because of cognitive biases such as
representative bias or information bias. Information asymmetry theory is mainly used in this
study. And other related theories are also referred, including agency theory, trade-off theory,
pecking order theory, and cash flow theory. These theories play a central role in corporate
finance and directly associate with level of cash holding in firms.
Asymmetric information occurs when one group of participants has better or more timely
information than other groups. According to Myers and Majluf (1984), asymmetric information
makes raising capital more difficult and answer the reason why existence of asymmetric
information makes external financing costly. The outside parties want to ensure that they
9
purchase securities not priced too high, so they will need a reasonable discount. Because parties
outside the enterprise hold less information than the management, they can evaluate too low
stock valuations based on the information provided by the management. Smith and Stulz (1985)
delivered evidence that is consistent with asymmetric information problems of external
financing. For example, investors discount the value of firms when they attempt to sell risky
securities. As view of Opler et al., (1999) asymmetric information led to situation that outside
capital becomes more expensive. This model predicts increased costs when raising capital
securities, which sold, are sensitive and the problem of information asymmetry information
becomes more important. Growth opportunities are intangible in nature and their value fall
precipitously in financial distress and bankruptcy. This would in turn imply that firms with
greater growth opportunities have greater incentives to avoid financial distress and bankruptcy
and hence hold larger cash and marketable securities.
Agency theory is using in many fields and concerns itself with the problem of ensuring
that someone acting on the behalf of another, an agent representing a principal, serves the
interest of the principal. Agency problem arises where the two parties have different interests and
asymmetric information, such that the principal cannot directly ensure that the agent is always
acting in the principal’s best interests. As opinion of Eisenhardt (1989), the issue at hand is that
the agent might have other goals and interests than the principal and would act to achieve these
at the expense of the principal. The theory assumes that in certain situations, if possible, the
agent would act to serve his or her objectives and the solution in these situations comes from
aligning the interests of the principal and the agent. Harris and Raviv (1978) showed that these
relationships are numerous and cross-links, as such lawyer - clients, employer - employee and
shareholders-managers. Agency problems that might arise in a shareholder-manager situation,
concerns among other things the optimal level of cash holdings. Jensen (1986) worried that
managers have motives for having higher levels of corporate cash holdings than what is optimal
for shareholders.
10
Trade-off theory implies that businesses will set up an objective of cash level by
balancing between marginal cost and marginal benefit of holding cash. The author summarizes
three main benefits from holding cash as below. Firstly, holding cash is to reduce the ability of
financial exhaustion, because the amount of cash held will act as a safety provision for
unexpected losses or limitations from raising capital from outside sources. Secondly, cash
holding allows businesses to pursue optimal investment policy, even whenever businesses
encounter financial constraints. As enterprises face difficulties in raising external capital,
businesses may be forced to abandon the investment project has a positive net present value.
Thirdly, holding cash reduces the cost of raising capital from outside or avoid forced liquidation
of existing assets of the enterprise. The role of cash is considering as a buffer between the source
and use of firm resources. Ferreira and Vilela (2004) proved that traditional marginal cost of
holding cash is the opportunity cost of capital because it reduces the rate of return calculated on
current assets.
Pecking order theory implies that the cost of financing increases with asymmetric
information. Managers know more about their companies’ prospects, risks and value than
outside investors. Pecking order theory of Myers and Majluf (1984) said that companies finance
for investments in the order as follows: the first is retained earnings, then safe debt, followed by
risky debt, and finally equity. The basic purpose of this order is to reduce funding costs due to
problems of asymmetric information and other financial expenses. When having enough
sufficient operating cash flow, it will fund new projects to seek potential returns. Otherwise,
businesses will pay the debt and holding cash. As research of Ferreira and Vilela (2004), when
retained earnings are not sufficient to fund existing projects, they will use the amount of
reservation and, if necessary, will now borrowings.
According to free cash flow theory, Jensen (1986) did define that free cash flow is cash
flow exceeds the amount necessary to fund all projects with positive net present value,
discounted at the cost of capital involved. Free cash flow theory is a subordination of agency cost
11