A particle swarm optimisation based grey prediction model for thermal error compensation on CNC machine tools
Bạn đang xem bản rút gọn của tài liệu. Xem và tải ngay bản đầy đủ của tài liệu tại đây (248.02 KB, 11 trang )
University of Huddersfield Repository
Abdulshahed, Ali, Longstaff, Andrew P. and Fletcher, Simon
A particle swarm optimisation-based Grey prediction model for thermal error compensation on
CNC machine tools
Original Citation
Abdulshahed, Ali, Longstaff, Andrew P. and Fletcher, Simon (2015) A particle swarm optimisationbased Grey prediction model for thermal error compensation on CNC machine tools. In: Laser
Metrology and Machine Performance XI, LAMDAMAP 2015. Euspen, Huddersfield, UK, pp. 369378. ISBN 978-0-9566790-5-5
This version is available at />The University Repository is a digital collection of the research output of the
University, available on Open Access. Copyright and Moral Rights for the items
on this site are retained by the individual author and/or other copyright owners.
Users may access full items free of charge; copies of full text items generally
can be reproduced, displayed or performed and given to third parties in any
format or medium for personal research or study, educational or not-for-profit
purposes without prior permission or charge, provided:
•
•
•
The authors, title and full bibliographic details is credited in any copy;
A hyperlink and/or URL is included for the original metadata page; and
The content is not changed in any way.
For more information, including our policy and submission procedure, please
contact the Repository Team at:
/>
Laser Metrology and Machine Performance XI
A particle swarm optimisation-based Grey
prediction
model
for
thermal
error
compensation on CNC machine tools
Ali M Abdulshahed, Andrew P Longstaff, Simon Fletcher
Centre for Precision Technologies, University of Huddersfield,
HD1 3DH, UK. Email:
Abstract
Thermal errors can have a significant effect on CNC machine tool accuracy.
The thermal error compensation system has become a cost-effective method of
improving machine tool accuracy in recent years. In the presented paper, the
Grey relational analysis (GRA) was employed to obtain the similarity degrees
between fixed temperature sensors and the thermal response of the CNC
machine tool structure. Subsequently, a new Grey model with convolution
integral GMC(1, N) is used to design a thermal prediction model. To improve
the accuracy of the proposed model, the generation coefficients of GMC(1, N)
are calibrated using an adaptive Particle Swarm Optimisation (PSO) algorithm.
The results demonstrate good agreement between the experimental and
predicted thermal error. Finally, the capabilities and the limitations of the
model for thermal error compensation have been discussed.
1
Introduction
Serious attention has been paid to the influence of temperature changes on the
accuracy of the CNC machine tools [1-3]. Temperature gradient can be caused
by variation of ambient temperature, self-generated heat in machine ball-crews,
spindle motors, etc. Thermal errors are yet more complex since they represent a
response to the interaction between environmental changes and internally
generated heat. There are three primary approaches to mitigate these thermal
errors which can be categorised as [4]: elimination or avoidance, reduction of
generated heat, and compensation strategies. Elimination or avoidance
strategies try to eliminate any change in dimensions due to temperature
changes. These strategies are best or, rather, can only be implemented during
the design stage of the machine tool. Some examples of these strategies are use
Laser Metrology and Machine Performance XI
of symmetry in machine design, choice of materials and use of direct feedback
[4]. Reduction of generating heat strategies tend to directly cool the heat
sources, for instance, through on-machine cooling systems. However, the enduser must also be responsible for improved environmental temperature control
[2], or good operating practices such as spindle warm up. Compensation
approaches tend to compensate for any change in the size and the shape of the
machine structure due to temperature gradients. They can be implemented
during any stage of the machine tool design. Many compensation techniques
have been explored to reduce thermal errors in a direct or indirect way [5].
Numerical techniques such as a finite-element method and finite-difference
method [1] are powerful tools in modelling the thermal characteristics.
However, building a numerical model can be a great challenge due to problems
of establishing the boundary conditions and accurately obtaining the
characteristic of heat transfer [6]. Therefore, testing of the machine tool is still
required to calibrate the model for successful application of these techniques.
The data driven models are behavioural models that are based on historical
data to predict the thermal error of machine tool. Contrary to the numerical
models, they are not based on explicit physical equation definitions but on
experimental database which is capable of reflecting the relationship between
inputs and outputs. Data driven techniques for thermal error modelling can be
divided into two categories: statistical techniques such as regression methods,
linear polynomial models, etc., and Artificial Intelligence (AI) techniques such
as artificial neural networks (ANNs), fuzzy systems, etc.
Abdulshahed et al. [7] employed an adaptive neuro fuzzy inference system
(ANFIS) to forecast thermal error compensation on CNC machine tools. Two
types of ANFIS model were built in this paper: using grid-partitioning and
using fuzzy c-means clustering. According to the results, the ANFIS with fuzzy
c-means clustering produced better results, achieving up to 94 % improvement
in error with a maximum residual error of ± 4 μm. In another work [8] they
built a thermal model by integrating ANN and GMC(1, N) models. The thermal
model can predict the Environmental Temperature Variation Error (ETVE) of a
machine tool with reduction in error from over 20 μm to better than ± 3 μm.
Nevertheless, robust solution for both principle-based and some of data
driven models require the measurement of temperature and related thermal
error components that have to be obtained by time-consuming experiments.
This is difficult to achieve in a working machine shop, because of the
prohibitively costly downtime required to conduct the experiments.
Appropriate selection of input variables is an important task in modelling. In
fact, not all input variables are equally important; some may have no significant
effect on the system being modelled. There are many approaches which have
been proposed to reduce the number of sensors. Abdulshahed et al. [9]
proposed a thermal model merging Grey model GM(0, N) and ANFIS model.
A thermal imaging camera was also used to record temperature distributions a
across the spindle-carrier structure of the machine tool. Each pixel can be
considered as a possible temperature measurement point. The Grey model and
fuzzy c-means clustering were applied to minimise the number of temperature
Laser Metrology and Machine Performance XI
points and select the most suitable sensor locations for modelling. Grey
relational analysis (GRA) provides an alternative approach to identifying the
similarity degree among factors, or to determining the optimal temperature
sensors for modelling with less experimental data.
In this paper, the GRA model is used to determine the major sensors
influencing thermal errors of a small vertical milling machine (VMC), which is
capable of simplifying the system prediction model. A PSO-based Grey
prediction model for thermal error compensation is developed by adopting PSO
to calibrate GMC(1, N) model. It is then used to predict thermal error on a
small VMC on the basis of the selected sensors.
2
Material and methods
2.1
Modelling the thermal error using a Grey model
The Grey systems theory, established by Deng in [10], is a methodology that
focuses on solving problems involving incomplete information or small
samples. The technique can be applied to uncertain systems with partially
known information by generating, mining, and extracting useful information
from available data so that system behaviours and their hidden laws of
evolution can be accurately described. It uses a Black-Grey-White colour to
describe complex systems [11]. GM(1, N) is the most widely used
implementation in literature [11], which can establish a first-order differential
equation featured by comprehensive and dynamic analysis of the relationship
between system parameters. The accumulated generating operation (AGO) is
the most important characteristic of the Grey system theory, and its benefit is to
increase the linear characters and reduce the randomness of the samples. Based
on the existing GM(1, N) model, Tien [11] proposed a GMC(1, N) model,
which is an improved Grey prediction model. The modelling values by
GM(1, N) are corrected by including a convolution integral. Traditionally,
these models have been calibrated by the least square method. However, due to
the nonlinearity of the problem, the least square solution may not provide a
satisfactory solution.
2.2
The particle swarm optimization (PSO)
The particle swarm optimization (PSO) algorithm was introduced by Eberhart
et al. [12] as an alternative to other evolutionary techniques. The PSO
algorithm is inspired by the behaviours of natural swarms, such as the
formation of flocks of birds and schools of fish. The advantages of the PSO
algorithm is that it does not require the objective function to be differentiable as
in the gradient decent method, which makes few assumptions about the
problem to be solved. Furthermore, it has a simple structure and its
optimisation method illustrates a clear physical meaning. PSO consists of a
population formed by individuals called particles, where each one represents a
possible solution of the problem. Each particle tries to search the best position
Laser Metrology and Machine Performance XI
with time in D-dimensional space (solution space). During flight or swim, each
particle adjusts its ”flying” or “swimming” in light of its own experience and
its companions’ experience, including the current position, velocity and the best
previous position experienced by itself and its companions. Therefore, instead
of using the standard algorithms, a PSO algorithm is employed to optimise the
Grey model parameters.
2.3
GMC (1, N) and its learning algorithm
In this section, we illustrate the main steps of GMC(1, N) and discuss its
learning algorithm using PSO. The model can reveal the long-term trend of
data and, by driving the model by the AGO, rather than raw data, can minimise
the effect of some of the random occurrences. Therefore, the first step for
building GMC(1, N) is to carry out 1-AGO (first-order Accumulated
Generating Operation) to the data, so as to increase the linear characteristics
and reduce the randomness from the measuring samples. PSO algorithm, with
capability to optimise complex numerical functions, is adopted to calibrate the
GMC(1, N) model. Finally, an IAGO (inverse Accumulated Generating
Operation) is performed to predict the thermal error and generate the final
compensation values. The modelling detail is described as follows:
Step 1: Consider the original data series as:
(0)
(0)
(0)
(0)
�1 = ��1 (1 + �), �1 (2 + �), … , �1 (� + �)�, and
(0)
(0)
(0)
(0)
(0)
�� = ��� (1), �� (2), … , �� (�), … , �� (� + �)�, where � = 2,3, … , �,
r is the period of delay, n gives the length of original data series and m denotes
the number of entries to be predicted.
Step 2: The above sequences of each variable are processed using 1-AGO to
obtain the 1st-order AGO sequences as follows:
(1)
(1)
(1)
(1)
�1 = ��1 (1 + �), �1 (2 + �), … , �1 (� + �)�, and
(1)
��
(1)
(1)
(1)
(1)
= ��� (1), �� (2), … , �� (�), … , �� (� + �)�,
where � (1) = ∑��=1 � (0) (�), � = 1,2, … , � + �.
Since the details of GMC(1, N) can be found in [11], this paper only briefly
mentions the core equations of this method.
(1)
��1 (�+�)
(1)
(1)
(1)
(1)
+ �1 �1 (� + �) = �2 �2 (�) + �3 �3 (�) + ⋯ + �� �� (�) + �, (1)
where � = 1,2, … , � + �, �1 is the development coefficient, �� , (� = 2,3, … , �)
the driving coefficient, and � is the Grey control parameter. Therefore, time
response sequences can be obtained.
��
1
(1)
(0)
�−1 −�1 (�−�)
��
×
��1 (� + �) = �1 (1 + �)� −�1(�−1) + × � −�1(�−1) × �(1) + ∑�=2
1
2
�(�)� + × �(�), where �(�) = ∑�
�=2 �� �� (�) + � .
2
(1)
(2)
To calculate the coefficients �1 , �� and �, the PSO can be used to calibrate
the equation (2). Then, the Grey model is optimised until the performance is
satisfactory. Finally, the optimal corresponding coefficients are used as the
Laser Metrology and Machine Performance XI
Grey model coefficients to predict the thermal error. The calibrating process of
GMC(1, N) can be summarised as follows:
In PSO algorithm, a particle refers to a coefficient in the model that changes
its position from one move to another based on velocity updates. The
mathematical description of the PSO algorithm is as follows: suppose that the
search space is D-dimensional, and then the current position and velocity of the
ith particle can be represented by �� = [��1 , ��2 , … , ��� ]� and �� =
[��1 , ��2 , … , ��� ]� respectively, where � = 1, 2, … , � and � is the number of
particles in the swarm.
Particle i can remember the best position so far, which is known as the local
best position ������ = [�����1 , �����2 , … , ������� ]� . It can also obtain the
best position that the whole swarm establish, known as the global best position
G����� = [g����1 , g����2 , … , g������ ]� . The first position and velocity of
Particle i are randomly initialised by the uniformly distributed variables.
Afterwards, particle i adjusts its velocity of iteration k+1 according to the local
and global best positions, as well as the velocity and position of iteration k, as
follows:
�� (� + 1) = ��� (�)+ �1 �������� (�) − �� (�)�+ �2 ��G����� (�) − �� (�)�(3)
where � is the inertia factor which is used to manipulate the impact of the
previous velocities on the current velocity, c1 and c2 are the self-confidence
factor and the swarm-confidence factor, respectively. R is a uniformly
distributed random real number that can take any values between 0 and 1. With
the updated velocity, the position of particle i in the iteration k+1 can be
obtained as follows:
(4)
�� (� + 1) = �� (�) + �� (� + 1)
The fitness of particle is measured using a fitness function that quantifies the
distance between the particle and its optimal solution as follows:
�
�(�� ) = ���� (0) (�) − � (0) (�)�,2
�=1
where f is the fitness value, �� (0) (�) is the target output; and, � (0) (�) is the
predicted output based on model parameters (particles) updating.
Step 3: Update the velocity and position of each particle based on equations
(3) and (4). Adjusting the model parameters in equation (2):
Step 4: If the value of the error meets the requirement of the model, or a predetermined number of epochs are passed, then the model calibration will end if
not, then return to Step 3.
Step 5: Export the optimal solution �� .
Step 6: 1- IAGO can be applied to obtain the predicted values. The
mathematical expression is as the following:
(0)
(1)
(1)
(0)
(1)
��1 (� + �) = ��1 (� + �) − ��1 (� − 1 + �), and ��1 (1 + �)=��1 (1 + �).
Laser Metrology and Machine Performance XI
2.4
Grey relational analysis method
Grey relational analysis (GRA) is a method to capture the correlations between
the reference factor and other compared factors of a system with a relatively
small amount of data [11]. On the basis of Deng’s initial models of grey
incidences, Liu et al. [13] proposed a new type of GRA model to investigate
the closeness of connection between sequences using the geometric shapes of
the sequences. The GRA model can be summarised as follows:
Step 1: Assume sequences:
�� = ��� (1), �� (2), �� (3), . . . �� (�)�, is a sequence of data representing a
system’s characteristics, and,
�� = ��� (1), �� (2), �� (3), . . . �� (�)�, is a sequence of relevant factor.
Step 2: The initial point zeroing images are:
��0 = ���0 (1), ��0 (2), ��0 (3), . . . ��0 (�)�,
��0 = ���0 (1), ��0 (2), ��0 (3), . . . ��0 (�)�,
where, ��0 (�) = �� (�) − �� (1), ��0 (�) = �� (�) − �� (1), � = 1,2, … , �.
Step 3: The grey similitude degree is calculated as follows:
�
1
,
where �� − �� = � ���0 − ��0 ��� .
��� =
1 + ��� − �� �
1
The similitude degree of the GRA model is used to measure the geometrical
shape similarity between sequence �i and �� . The ��� is called the similitude
degree of �� with respect to �� . According to the above equations, the
similitude degree ��� between thermal error of CNC machine tool and the
various temperature sensors can be calculated. The bigger ��� the greater impact
on thermal error and on the contrary the smaller ��� .
3
Experimental work
To verify the applicability of the proposed model, an example simulating the
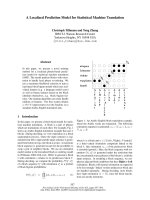
machining of six parts is investigated. The experiments were performed on a
small vertical milling centre (VMC) and utilised a Renishaw OMP40-2 spindlemounted probe to monitor distortion. It has a stated unidirectional repeatability
of 1.0 μm at 480 mm/min with a 50 mm stylus. The test consists of simulating
the machining of six parts which are machined individually at a datum point on
the table. When a part is finished the table moves to the next datum point to
start machining the next part. Each part excites the X, Y and Z axes simulate
milling operations. This allows heat to be generated from spindle, motors and
axes movement. A probing routine is run before the first machining operation
to create a datum baseline for the test on four corners of granite square (see
Figure 1). Probing routines are run after the third part and sixth part to measure
the drift of the tool in the X, Y and Z axes. The thermal data were measured
using twenty eight temperature sensors placed in strips at the carrier, spindle
boss, axes motors, axes ballscrews nut, and ambient temperature sensors were
Laser Metrology and Machine Performance XI
placed around the machine to pick up the ambient temperature. A general
overview of the experimental setup is shown in Figure 1.
Z axis motor
Spindle motor
Spindle-carrier
Probing system
Granite square
X axis motor
Table
T7
T
T
T4
T19 T17
T
T , T , T , T , T , T , and T
18
10
T
T
Surface sensors
Ambient sensors
Selected sensors: T2 , T4,
20
6
2
6
7
10
17
18
19
20
Column
Y axis motor
Four corners
Figure 1. A general overview of the experimental setup.
The machine was examined by running the spindle at a speed of 9 000 rpm
(except for the periods of probing), and a feedrate of 5 000 mm/min for
200 minutes to excite the thermal behaviour. The high rotational speed brings a
larger thermal displacement for the spindle carrier. Moreover, the higher
feedrate generates larger frictional heat at the interface points, and the motor
temperature also increases with the higher feedrate. Temperature of measured
points grows gradually until the equilibrium state is reached. The temperature
sensors were measured simultaneously every 10 seconds. The maximum drift
of the X-axis is 20 μm, the Y-axis is 18 μm, and the Z-axis is 58 μm. In this
paper, the thermal drift of the Z-axis was investigated as an example for the
modelling, and potential error compensation.
The representative temperature sensors for modelling were selected from
each group (Surface sensors and ambient sensors) according to their influence
coefficient value using GRA model, more details about similar Grey model is
given in our work [7, 9]. The representative thermal sensors T10, T20, T2, T19,
T4, T18, T17, T7, and T6, which are located on the spindle boss, spindle motor
axes motors, carrier, and ambient, are selected as the thermal key sensors for
modelling. The similitude degree of these temperature sensors are: ε1T10 =
0.98, ε1T20 = 0.93, ε1T2 = 0.85, ε1T19 = 0.84, ε1T4 = 0.82, ε1T18 = 0.82,
ε1T17 = 0.82, ε1T7 = 0.81, ε1T7 = 0.55, and ε1T6 = 0.5, respectively.
4
Results and discussion
In order to optimise the GMC(1, N) parameters, the experimental data set was
divided into two sets, one is being used for calibrating the model
(approximately 10 %), and the rest for testing performance (approximately
Laser Metrology and Machine Performance XI
90 %). Nine temperature sensors are used as inputs, and Z-axis displacement as
output. In the PSO algorithm, the number of the particles is set to be 90 whilst
the self-confidence factor and the swarm-confidence factor are c1=2 and c2=2,
respectively. The inertia weight ω was taken as an adaptive decreasing function
in iteration index k from 0.9 to 0.4. After 100 epochs, the total error was at an
acceptable level (3 μm for testing dataset). The Grey model obtained using
PSO algorithm is:
(1)
dX1 (t)
(1)
(1)
(1)
(1)
(1)
+5.31X1 (t)=72.12X2 (t)+61.04X3 (t)-26.07X4 (t)+66.34X5 (t)
dt
(1)
(1)
(1)
(1)
(1)
-23.33X6 (t)-31.99X7 (t)+25.73X8 (t)-23.50X9 (t)+7.597X10 (t)-54.74.
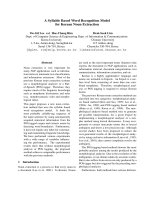
The final GMC(1, 10) model being optimised and validated in this work has
been tested next by a new testing dataset, not used during training stage. The
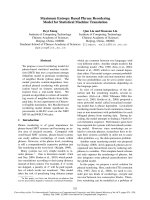
individual variables are shown in Figure 2. Simulation results show that the
thermal error in the Z direction can be significantly reduced from 58 μm to less
than 4 μm using testing dataset (see Figure 3). Furthermore, this result shows
that the PSO algorithm can act as an alternative training algorithm for Grey
model that can be used for thermal error compensation.
Consequently, this paper develops a simple, less computationally intensive
and low-cost approach based on Grey model and PSO algorithm to predict the
thermal error compensation on CNC machine tools. In this work, this model
has been used for prediction of the thermal error of a relatively simple structure
with only a few calibrating samples. However, further work is required to
validate the proposed model using disparate cycles on multiple machines.
7
6
Temperature change °C
5
4
Spindle boss
Spindle Motor
Z axis motor "bolt1"
Carrier sensor "12"
Z axis motor "bolt2"
Carrier sensor "11"
Carrier sensor "10"
Ambient column top
Ambient column bottom
3
2
1
0
-1
0
50
100
150
200
250
300
Time/min
Figure 2: Measured temperature variation (model inputs).
350
Laser Metrology and Machine Performance XI
60
Thermal displacement/microns
50
40
Measured thermal error
Grey model output
Residual value
30
20
10
0
-10
0
50
100
150
200
Time (Minutes)
250
300
350
Figure 3: GMC(1, N) model output vs the actual thermal drift.
5
Conclusions
In this paper, a PSO-based Grey prediction model for thermal error
compensation of a small vertical milling centre (VMC) is presented. Two main
findings have been addressed in this paper. First of all, the optimal temperature
sensors were determined through the GRA model. After calculating the
similarity degrees between the thermal error and the temperature sensors, one
sensor from each group is selected according to its similarity degree with the
thermal distortion. The number of required temperature sensors was thus
reduced from twenty eight to nine, which significantly minimised the
computational time, cost and effect of sensor uncertainty. Secondly, the
comparison between experimental results and predicted values of the Grey
model show that there is an excellent agreement between the predicted thermal
error and the experimental results with residual error of 4 μm. The results of
this paper show that the PSO technique can act as an alternative calibration
algorithm for Grey models that can be used for thermal error compensation.
Further work is required to validate the model using disparate cycles on
multiple machines.
6
References
[1]
Mayr J, et al. 2012 Thermal issues in machine tools CIRP Ann. Manuf.
Technol. vol 65 p 771-91
Laser Metrology and Machine Performance XI
[2]
[3]
[4]
[5]
[6]
[7]
[8]
[9]
[10]
[11]
[12]
[13]
Longstaff A, Fletcher S and Ford D 2003 Practical experience of
thermal testing with reference to ISO 230 Part 3 Laser metrology and
machine performance VI (Southampton) ed. DG F (WIT Press) p 47383
Longstaff A, Fletcher S, Parkinson S and Myers A 2013 The role of
measurement and modelling of machine tools in improving product
quality Int. J. of Metrol. and Quality Eng. vol 4 p 177-84
Ito Y 2010 Thermal deformation in machine tools (McGraw-Hill:
New York)
Li J, Zhang W, Yang G, Tu S and Chen X 2009 Thermal-error
modelling for complex physical systems: the-state-of-arts review Int.
J. Adv. Manuf. Technol vol 42 p 168-79
Mian N, Fletcher S, Longstaff A and Myers A 2013 Efficient
estimation by FEA of machine tool distortion due to environmental
temperature perturbations Precis. Eng vol 37 p 372-79
Abdulshahed A, Longstaff A and Fletcher S 2015 The application of
ANFIS prediction models for thermal error compensation on CNC
machine tools J. Appl. Soft Comput. vol 27 p 158-68
Abdulshahed A, Longstaff A, Fletcher S and Myers A 2013
Application of GNNMCI(1, N) to environmental thermal error
modelling of CNC machine tools The 3rd Int. Conf. on Adv. Manuf.
Eng. and Technol. (Sweden) vol 1 p 253-62
Abdulshahed A, Longstaff A, Fletcher S and Myers A 2014 Thermal
error modelling of machine tools based on ANFIS with fuzzy c-means
clustering using a thermal imaging camera J. App. Math. Modell.
/>Deng J 1982 Control problems of grey systems Sys. & Cont. Letters
vol 1 p 288-94
Tien T 2012 A research on the grey prediction model GM (1, n) J.
App. Math. and Comp. vol 218 p 4903-16
Eberhart R and Kennedy J 1995 A new optimizer using particle swarm
theory Proc. of the sixth int. symp. on Micro Machine and Human
Science (Nagoya, Japan) p 39-43
Liu S, Yang Y, Cao Y and Xie N 2013 A summary on the research of
GRA models Grey Sys: Theory and Appl. vol 3 p 7-15