Young stellar clusters throughout the galaxyand the interaction with their molecular environment
Bạn đang xem bản rút gọn của tài liệu. Xem và tải ngay bản đầy đủ của tài liệu tại đây (16.38 MB, 220 trang )
Young stellar clusters throughout the Galaxy
and the interaction with their molecular
environment
Dissertation
zur
Erlangung des Doktorgrades (Dr. rer. nat.)
der
Mathematisch-Naturwissenschaftlichen Fakultät
der
Rheinischen Friedrich-Wilhelms-Universität Bonn
vorgelegt von
Esteban Félix Eduardo Morales Häfelin
aus Santiago, Chile
Bonn Oktober 2012
Angefertigt mit Genehmigung der
Mathematisch-Naturwissenschaftlichen Fakultät der Rheinischen
Friedrich-Wilhelms-Universität Bonn
1. Referent: Prof. Dr. Karl M. Menten
2. Referent: Prof. Dr. Pavel Kroupa
Tag der Promotion: 12.03.2013
Erscheinungsjahr: 2014
Diese Dissertation ist auf dem Hochschulschriftenserver der ULB Bonn
unter elektronisch
publiziert.
a Denise
Abstract
Stars are born within dense clumps of giant molecular clouds, constituting
young stellar agglomerates known as embedded clusters. Once the parental gas
is expelled through stellar feedback, they evolve into bound open clusters only
under special conditions. In this thesis, we study observationally all embedded clusters (ECs) and open clusters (OCs) known so far in the inner Galaxy,
investigating particularly their interaction with the surrounding molecular environment. We first compiled a merged list of 3904 clusters from optical and
infrared clusters catalogs in the literature, including 71 new embedded clusters
discovered by us in the GLIMPSE mid-infrared data after applying a red-color
criterion. From this list, 695 clusters are within the Galactic range |l| ≤ 60◦
and |b| ≤ 1.5◦ covered by the ATLASGAL survey, which was used to search
for correlations with submm dust continuum emission tracing dense molecular
gas. Based on the morphology of this emission, we defined an evolutionary sequence of five morphological types: deeply embedded cluster (EC1), partially
embedded cluster (EC2), emerging open cluster (OC0), open cluster still associated with a submm clump in the vicinity (OC1), and open cluster without
correlation with ATLASGAL (OC2). We found that this sequence correlates
well with other observational indicators of evolution, such as UV-excited PAH
emission and H ii regions tracing stellar feedback in the first four evolutionary
stages, and infrared dark clouds probing a very early phase within the EC1
type. We also found that an OC defined observationally in this way (clusters
with types OC0, OC1 and OC2 and confirmed as real clusters) is equivalent
to the physical concept of open cluster (a bound exposed cluster) for ages in
excess of ∼ 16 Myr; some observed OCs younger than this limit can be actually
unbound associations.
We found that our OC and EC samples are roughly complete up to ∼ 1 kpc
and ∼ 1.8 kpc from the Sun, respectively, after which the completeness decays
exponentially. Using available age estimates for a few ECs, we derived an
upper limit of 3 Myr for the duration of the embedded phase. Combined with
the OC age distribution within 3 kpc from the Sun, we computed formation
rates of 0.54, 1.18, and 6.50 Myr−1 kpc−2 for bound open clusters, all observed
young exposed clusters, and embedded clusters, respectively, implying an EC
dissolution fraction of 88 ± 8%.
We carried out follow-up 13 CO(2−1) and C18 O(2−1) mapping observations
towards a subsample of 14 clusters showing evidence of ongoing stellar feedback
in our previous analysis, and we indeed found kinematic signatures of enhanced
turbulence and expanding motions. A more detailed study towards the IR
bubble G10.31−0.14, including a comparison with simple geometrical models of
the velocity field, reveals that this source is more likely an expanding molecular
ring inclined with respect to the plane of the sky, rather than a 3D shell seen
in projection.
Contents
1 Introduction
1.1 Observational tools: Galactic surveys
1.1.1 ATLASGAL . . . . . . . . . .
1.1.2 2MASS . . . . . . . . . . . .
1.1.3 GLIMPSE . . . . . . . . . . .
1.2 This Thesis . . . . . . . . . . . . . .
.
.
.
.
.
.
.
.
.
.
.
.
.
.
.
.
.
.
.
.
.
.
.
.
.
.
.
.
.
.
.
.
.
.
.
.
.
.
.
.
.
.
.
.
.
.
.
.
.
.
.
.
.
.
.
.
.
.
.
.
.
.
.
.
.
.
.
.
.
.
.
.
.
.
.
1
3
5
5
6
7
2 The current understanding of embedded cluster formation and
early evolution
2.1 Formation of embedded clusters . . . . . . . . . . . . . . . . . .
2.1.1 Theories . . . . . . . . . . . . . . . . . . . . . . . . . . .
2.1.2 Spatial distribution and clustering . . . . . . . . . . . .
2.2 Gas disruption . . . . . . . . . . . . . . . . . . . . . . . . . . .
2.2.1 Stellar feedback in young clusters . . . . . . . . . . . . .
2.2.2 Early dynamical evolution . . . . . . . . . . . . . . . . .
2.2.3 Triggered star formation . . . . . . . . . . . . . . . . . .
2.3 Cluster definition revisited . . . . . . . . . . . . . . . . . . . . .
11
11
11
15
22
22
27
31
33
3 Compilation of all-sky cluster catalogs
3.1 Optical clusters . . . . . . . . . . . . . . . . .
3.2 Near-infrared clusters . . . . . . . . . . . . . .
3.3 Mid-infrared clusters . . . . . . . . . . . . . .
3.4 New GLIMPSE search for embedded clusters
3.5 Cross-identifications . . . . . . . . . . . . . .
3.6 Spurious cluster candidates . . . . . . . . . .
35
36
37
39
39
46
47
.
.
.
.
.
.
.
.
.
.
.
.
.
.
.
.
.
.
.
.
.
.
.
.
.
.
.
.
.
.
.
.
.
.
.
.
.
.
.
.
.
.
.
.
.
.
.
.
.
.
.
.
.
.
.
.
.
.
.
.
4 Stellar clusters in the inner Galaxy and their correlation with
ATLASGAL
4.1 Construction of the Catalog . . . . . . . . . . . . . . . . . . . .
4.1.1 Designations, position and angular size . . . . . . . . . .
4.1.2 ATLASGAL emission . . . . . . . . . . . . . . . . . . .
4.1.3 Mid-IR morphology and association with known objects
53
54
54
54
57
vii
Contents
4.2
4.1.4 Kinematic distance . . . . . . . . . . . . . . . . . . . .
4.1.5 Stellar distance and age . . . . . . . . . . . . . . . . .
4.1.6 Adopted distance, complexes and subclusters . . . . .
4.1.7 Additional comments . . . . . . . . . . . . . . . . . . .
Analysis . . . . . . . . . . . . . . . . . . . . . . . . . . . . . .
4.2.1 Morphological evolutionary sequence . . . . . . . . . .
4.2.2 Spatial distribution . . . . . . . . . . . . . . . . . . . .
4.2.3 Completeness and definition of a representative sample
4.2.4 Age distribution and young cluster dissolution . . . . .
4.2.5 Correlations . . . . . . . . . . . . . . . . . . . . . . . .
5 Follow-up 13 CO(2−1) and C18 O(2−1)
5.1 Observations . . . . . . . . . . . . .
5.1.1 APEX . . . . . . . . . . . . .
5.1.2 IRAM 30-m . . . . . . . . . .
5.2 General Results . . . . . . . . . . . .
5.3 The infrared bubble G10.31−0.14 . .
5.3.1 Description of the region . . .
5.3.2 Kinematics . . . . . . . . . .
5.3.3 Discussion . . . . . . . . . . .
mapping
. . . . . .
. . . . . .
. . . . . .
. . . . . .
. . . . . .
. . . . . .
. . . . . .
. . . . . .
.
.
.
.
.
.
.
.
.
.
59
64
67
69
70
70
76
86
88
94
observations
. . . . . . . . .
. . . . . . . . .
. . . . . . . . .
. . . . . . . . .
. . . . . . . . .
. . . . . . . . .
. . . . . . . . .
. . . . . . . . .
97
97
99
101
102
120
120
124
134
6 Conclusions
139
A Cluster Classical Evolution
145
B Catalog of stellar clusters in the inner Galaxy
153
Bibliography
193
Acknowledgements
207
viii
List of Figures
1.1
Infrared and optical images of the embedded cluster RCW 38 .
2.1
Hydrodynamic simulations of star formation in a Giant Molecular Cloud . . . . . . . . . . . . . . . . . . . . . . . . . . . . . .
Zoomed-in image of star formation hydrodynamic simulations .
Young stellar objects in the Orion A molecular cloud . . . . . .
Cumulative fraction of YSO surface densities in the solar neighborhood . . . . . . . . . . . . . . . . . . . . . . . . . . . . . . .
Spatial distributions of sink particles in a star formation simulation
Schematic representation of a wind-blown H ii region . . . . . .
Comparison of feedback mechanisms in protoclusters on the
(Σ, M ) plane . . . . . . . . . . . . . . . . . . . . . . . . . . . .
2.2
2.3
2.4
2.5
2.6
2.7
4
13
14
17
18
20
25
26
3.1
Examples of new GLIMPSE embedded cluster candidates . . .
43
4.1
4.2
4.3
4.4
Comparison of kinematic and stellar distances . . . . . . . . . .
Examples of the two morphological types of embedded clusters
Examples of the three morphological types of open clusters . .
Crossing time vs. age in an solar neighborhood open cluster
sample . . . . . . . . . . . . . . . . . . . . . . . . . . . . . . . .
Galactic distribution of the star cluster sample . . . . . . . . .
Zoomed-in Galactic distribution of the star cluster sample . . .
Distribution of heights from the Galactic plane . . . . . . . . .
Distribution of heliocentric distances . . . . . . . . . . . . . . .
Age distribution of open clusters . . . . . . . . . . . . . . . . .
70
72
73
4.5
4.6
4.7
4.8
4.9
5.1
5.2
5.3
5.4
5.5
5.6
13 CO(2−1)integrated
CO
CO
CO
CO
CO
analysis
analysis
analysis
analysis
analysis
for
for
for
for
for
maps of the
G305.26+0.22 . .
G305.27−0.01 . .
G320.17+0.80 . .
G332.54−0.14 . .
G348.25−0.97 . .
observed sample
. . . . . . . . . .
. . . . . . . . . .
. . . . . . . . . .
. . . . . . . . . .
. . . . . . . . . .
.
.
.
.
.
.
.
.
.
.
.
.
.
.
.
.
.
.
.
.
.
.
.
.
.
.
.
.
.
.
.
.
.
.
.
.
.
.
.
.
.
.
77
78
79
81
82
91
103
108
109
110
111
112
ix
List of Figures
5.7
5.8
5.9
5.10
5.11
5.12
5.13
5.14
5.15
5.16
5.17
5.18
5.19
5.20
5.21
5.22
5.23
5.24
5.25
x
CO analysis for G350.51+0.95 . . . . . . . . . . . . . . . . . . . 113
CO analysis for G353.41−0.37 . . . . . . . . . . . . . . . . . . . 114
CO analysis for G1.12−0.11 . . . . . . . . . . . . . . . . . . . . 115
CO analysis for G5.90−0.44 . . . . . . . . . . . . . . . . . . . . 116
CO analysis for G10.31−0.14 . . . . . . . . . . . . . . . . . . . 117
CO analysis for G18.15−0.30 . . . . . . . . . . . . . . . . . . . 118
CO analysis for G25.39−0.16 . . . . . . . . . . . . . . . . . . . 119
ATLASGAL image of the W31 complex . . . . . . . . . . . . . 122
Multiwavelength view of the G10.31−0.14 bubble . . . . . . . . 123
13 CO(2−1) integrated spectrum of the G10.31−0.14 bubble . . 125
13 CO(2−1) channel maps of G10.31−0.14, from 0 to 29 km s−1 126
13 CO(2−1) integrated spectrum of the outflow in G10.31−0.14
127
13 CO(2−1) channel maps of G10.31−0.14, from 5 to 20 km s−1 128
C18 O(2−1) channel maps of G10.31−0.14, from 5 to 20 km s−1 129
Schematic description of the expanding ring geometrical model 130
Channel maps of expanding shell model with the back face missing.131
Channel maps of expanding shell model with front face missing. 132
Channel maps of expanding ring model (asymmetrical case) . . 134
Channel maps of expanding ring model (symmetrical case) . . . 135
List of Tables
3.1
3.2
3.3
New GLIMPSE stellar cluster candidates. .
Number of clusters for every catalog used in
List of spurious clusters, duplicated entries,
ters within the catalogs used in this work. .
. . . . . . . . . . .
this work. . . . . .
and globular clus. . . . . . . . . . .
44
47
4.1
4.2
4.3
Number of clusters in each morphological type. . . . . . . . . .
Best-fit parameters from the Z- and D-distributions. . . . . . .
Statistics for each morphological type. . . . . . . . . . . . . . .
74
85
95
5.1
5.2
The sample of regions mapped in 13 CO(2−1) and C18 O(2−1). . 100
Summary of the 13 CO(2−1) and C18 O(2−1) mapping observations. . . . . . . . . . . . . . . . . . . . . . . . . . . . . . . . . . 101
B.1 Catalog of embedded and open clusters in
(main information) . . . . . . . . . . . . . .
B.2 Catalog of embedded and open clusters in
(additional information) . . . . . . . . . . .
B.3 References for Tables B.1 and B.2. . . . . .
the inner
. . . . . .
the inner
. . . . . .
. . . . . .
50
Galaxy
. . . . . 155
Galaxy
. . . . . 173
. . . . . 191
xi
1
Introduction
Stars form by gravitational collapse of high-density fluctuations in the interstellar molecular gas, which are generated by supersonic turbulent motions
(Klessen 2011). Most of the mass of the molecular gas in the interstellar
medium (ISM) is in the form of giant molecular clouds (GMCs), large structures with sizes from ∼ 20 to ∼ 100 pc, masses in the range ∼ [104 , 106 ] M ,
and average densities of n ∼ 100 cm−3 (Williams et al. 2000; Beuther et al.
2007). Observations of GMCs in the Milky Way reveal their extremely complex
hierarchical configuration, with densities varying by several orders of magnitude, as the result of turbulence. Following the nomenclature of Williams et al.
(2000), star formation takes place in dense (n 104 cm−3 ) clumps which are,
in turn, fragmented into denser (n 105 cm−3 ) cores, where individual stars
or small multiple systems are born.
Given this nature of the star formation process, stars are born correlated
in space and time, with typical scales of 1 pc and 1 Myr, respectively (see
Kroupa 2011), which are much more restricted than those characterizing the
field population of the Galaxy. Therefore, recently formed (or forming) stars
are found in young stellar agglomerates, still embedded in their parent molecular clumps, referred to as embedded clusters. Bressert et al. (2010) studied the
spatial distribution of star formation within 500 pc from the Sun and found
that, in fact, nearly all stars in their sample are formed in regions with number densities greater than ∼ 2 pc−3 , that is more than an order of magnitude
higher than the density of field stars in the Galactic disk, 0.13 pc−3 (Chabrier
1
Chapter 1. Introduction
2001).
Many of the embedded clusters defined in this way, however, are not gravitationally bound and do not become classical open clusters, i.e., bound stellar agglomerates that are free of gas and evolve in timescales of the order of
100 Myr. It is very important to make the distinction from the start because
there is often some confusion about this in the literature. In our definition described above and explained in more detail in Section § 2.3, embedded clusters
are not necessarily the direct progenitors of bound open clusters, but just the
natural outcome of the star formation process, which is “clustered” with respect
to the field stars. Some embedded clusters could be unbound from birth even
considering the gas potential, and disperse into the field, while others, within
a giant molecular complex, might merge and form a few merged large entities
(Maschberger et al. 2010, see also § 2.1.1). A bound embedded cluster can
still be disrupted due to collisional N -body dynamics, tidal shocks from the
surrounding gas, or fast gas expulsion driven by stellar feedback (c.f. § 2.2.2).
Bound exposed clusters are therefore the few survivors of all these processes
(which effect is dominant depends on the physical conditions of the system and
the environment) and correspond to the remnants of originally more massive
embedded clusters.
Embedded clusters have a strong influence on their parent molecular clouds
by injecting energy and momentum through various mechanisms, leading to
the expulsion of the residual gas out of the cluster volume and halting the general star formation process. These feedback mechanisms include protostellar
outflows, evaporation driven by non-ionizing ultraviolet radiation, photoionization and subsequent H ii region expansion, stellar winds, radiation pressure
and, eventually, supernovae. Again, as we will see in Section § 2.2.1, the relative importance of a certain dissipation process is determined by both the
characteristics of the recently born stellar population and the physical properties of the molecular cloud. Under certain conditions, stellar feedback may also
trigger the formation of a new generation of stars in the surrounding molecular
material (see § 2.2.3). Therefore, embedded clusters themselves help to regulate star formation in the Galaxy, apart from magnetic fields and large-scale
interstellar turbulence.
The observational study of embedded clusters is thus fundamental to account for most of the newly formed stellar population in the Galaxy, and to
investigate the interaction with its birth-giving interstellar material through
the different feedback mechanisms mentioned above. At the same time, such
studies are crucial to understand better the dynamical evolution of embedded clusters towards the production of field stars (through early dissolution)
and, in some cases, of bound open clusters, especially when combined with
2
1.1. Observational tools: Galactic surveys
observations of the latter (as in this thesis).
Nevertheless, there is an observational limitation that impeded the study of
embedded clusters till a few decades ago. During their formation and early evolution, embedded clusters are located in regions with high column densities of
gas. Since in the ISM there is also cosmic dust, which is well mixed with the gas
in a roughly constant mass proportion of ∼ 1%, a high column density of gas
translates in a relatively high column density of dust too. Dust is composed
of solid grains of typical sizes of 0.1 µm that efficiently extinguish starlight
at optical wavelengths, making embedded clusters heavily obscured from optical observations and practically impossible to study at these wavelengths.
Fortunately, during the past three decades, the development of infrared (IR)
astronomy including, more recently, near-infrared (1 − 3 µm) imaging cameras
and spectrometers on ground-based telescopes, and mid-infrared (3 − 25 µm)
cameras on space telescopes, has provided astronomers the ability to survey
and systematically study embedded clusters within molecular clouds, thanks
to the fact that IR radiation is much less affected by dust extinction than visible light. An example of the power of infrared imaging for revealing the stellar
population of embedded clusters is presented in Figure 1.1, which shows the
southern young cluster RCW 38. While the optical image (top) is able to detect only the brightest (most massive) members, the IR image (bottom) clearly
probes a rich cluster embedded in nebulosity.
In the last decade, thanks to the development of all-sky infrared imaging
surveys like 2MASS and GLIMPSE (c.f. § 1.1), many new embedded clusters
have been discovered in the Galaxy (e.g., Dutra et al. 2003a; Bica et al. 2003b;
Mercer et al. 2005; Borissova et al. 2011), increasing significantly the number of
known systems. In this thesis, we study systematically all embedded clusters
and open clusters known so far in the inner Galaxy, investigating particularly
their interaction with the surrounding molecular environment. We take advantage of the recently completed ATLASGAL survey, which provides us a
completely unbiased view of the distribution of the dense molecular material
in the Milky Way. The main observational data used in this work is described
in the next Section, and at the end of this chapter we outline the scientific
goals of this thesis and the content of the following chapters.
1.1
Observational tools: Galactic surveys
Throughout this work, me make extensive use of three surveys of continuum
emission that cover practically the whole inner Galactic plane: ATLASGAL in
the submillimeter regime, 2MASS in the near-infrared (NIR), and GLIMPSE
in the mid-infrared (MIR).
3
Chapter 1. Introduction
1’ = 0.5 pc
Figure 1.1: The southern embedded cluster RCW 38. Top: Optical 4-color image
made with the B, R, and Hα filters at the MPG/ESO 2.2m Telescope. Credit: ESO.
Bottom: Near-infrared JHK image obtained with the ESO Very Large Telescope. The
field of view is about 2.5 (∼ 1.2 pc). Credit: ESO.
4
1.1. Observational tools: Galactic surveys
1.1.1
ATLASGAL
The APEX Telescope Large Area Survey of the Galaxy (ATLASGAL, Schuller
et al. 2009) is the first unbiased submm continuum survey of the whole inner
Galactic disk, covering a total of 360 square degrees of the sky with Galactic
coordinates in the range |l| ≤ 60◦ and |b| ≤ 1.5◦ . The observations were carried
out at 870 µm using the Large APEX Bolometer Camera (LABOCA; Siringo
et al. 2009) of the the APEX telescope (Güsten et al. 2006), located on Llano
de Chajnantor, Chile, at 5100 m of altitude. With an antenna diameter of
12 m, the observations reach an angular resolution of 19.2 at this wavelength.
The submm continuum emission primarily corresponds to gray-body radiation from cold dust located in regions of relatively dense molecular gas (see
Figure 5.14 for an example image of ATLASGAL). The emitting dust grains
are at typical temperatures Td in the range [10, 30] K, and are generally in
equilibrium with the gas molecules. In the submm regime, this dust emission
is optically thin (see Schuller et al. 2009), so that the received flux is directly
proportional to the total amount of dust, and hence of total cloud’s material
(assuming a constant gas/dust mass ratio), on the line of sight. Simple relations can be derived for the column density as a function of flux per beam,
and for the mass as a function of the total flux of a source (see appendix A
by Kauffmann et al. 2008, and Eq. (5.5)). The ATLASGAL survey reaches an
average rms noise level of ∼ 50 mJy/beam, which translates in a 3σ detection
limit of ∼ 4 M of total molecular mass (for a nominal distance of 2 kpc and
a dust temperature of Td = 20 K).
1.1.2
2MASS
The Two Micron All Sky Survey (2MASS, Skrutskie et al. 2006) provides nearinfrared images of the whole sky, in the J (1.25 µm), H (1.65 µm), and Ks
(2.16 µm) filters, taken from two dedicated 1.3 m diameter telescopes located
at Mount Hopkins, Arizona, and Cerro Tololo, Chile. The angular resolution is
∼ 2.5 or slightly higher (depending on the seeing conditions) and the reached
10σ detection levels for point sources were typically 15.8, 15.1, and 14.3 magnitudes for J, H, and Ks , respectively. These wavelengths trace primarily
starlight, but in young clusters there is usually a contribution from nebular
extended emission from ionized gas, and radiation from warm circumstellar
dust in the immediate vicinity of individual protostars, generally distributed
in disks and not resolved by these observations. The 2MASS images and point
source catalog are publicly available.
5
Chapter 1. Introduction
1.1.3
GLIMPSE
The Galactic Legacy Infrared Mid-Plane Survey Extraordinaire (GLIMPSE,
Benjamin et al. 2003; Churchwell et al. 2009) is a set of various surveys of the
Galactic plane carried out with the InfraRed Array Camera (IRAC, Fazio et al.
2004), on board of the Spitzer Space Telescope (Werner et al. 2004). Here we
use the GLIMPSE I and II surveys which cover the (l, b) ranges: 5◦ < |l| ≤ 65◦
and |b| ≤ 1◦ ; 2◦ < |l| ≤ 5◦ and |b| ≤ 1.5◦ ; |l| ≤ 2◦ and |b| ≤ 2◦ , comprising a
total of 274 square degrees. The IRAC camera provides images at four filters
centered at wavelengths 3.6, 4.5, 5.6, and 8.0 µm, with an angular resolution
of ∼ 2 . The GLIMPSE products are publicly available and consist of mosaic
images, a highly reliable point source catalog, and the slightly lower reliability
but more complete point source “archive”.
In star-forming regions, the four Spitzer -IRAC filters are dominated by
different emission mechanisms. One of the most relevant features is the midinfrared emission from polycyclic aromatic hydrocarbons (PAHs), which are
large organic molecules containing tens or hundreds of C atoms. Exposure
to ultraviolet (UV) radiation excites various vibrational modes of the PAHs
causing them to radiate strongly as emission features in the infrared. While UV
photons of sufficiently low energy excite PAH emission, harder UV photons,
as those above the Lyman limit, destroy these molecules. Therefore, PAH
emission is strong in photo-dissociation regions (PDRs), that lie just outside
ionized gas regions.
The main emission processes for each IRAC band are the following (see
introduction of Watson et al. 2008):
• 3.6 µm: Brightest objects are stars, while faint diffuse emission traces a
weak PAH feature at 3.3 µm and possibly some scattered starlight.
• 4.5 µm: Brightest objects are stars, and localized diffuse emission might
be tracing shocked H2 and/or CO lines; when present, this emission
is usually interpreted as the activity of protostellar outflows crashing
into the ambient interstellar medium (see Cyganowski et al. 2008, and
references therein). The 4.5 µm filter contains no PAH features.
• 5.8 µm: This filter contains a strong PAH feature at 6.2 µm, which
can dominate the diffuse emission except close to ionizing stars, where
PAHs are destroyed and radiation from thermal dust is probably the
main emission mechanism.
• 8.0 µm: This filter contains two very strong PAH features at 7.7 and
8.6 µm which dominate the diffuse emission in this band; again, close to
ionizing stars, this filter mainly traces warm dust.
6
1.2. This Thesis
The GLIMPSE surveys have revealed very peculiar structures in starforming regions (a summary is provided in § 2 of Churchwell et al. 2009).
In particular, infrared dark clouds (IRDCs), already found in previous MIR
surveys, are seen as extinction features against the bright and diffuse midinfrared Galactic background, specially at 8.0 µm. They represent the densest
and coldest condensations within giant molecular clouds and are the most likely
sites of future star formation. On the other hand, bright PAH emission is often
confined to ring-like structures known as IR bubbles, which in most cases are
tracing the molecular material swept up by the expansion of H ii regions created by the ionizing UV radiation from massive stars (Deharveng et al. 2010).
Specifically, the bright rims of the bubbles are likely tracing the inner surface of
the swept-up neutral gas, just outside the ionization front (see § 2.2.1), where
the UV field is strong enough to highly excite PAHs but below the destruction
limit of these molecules.
1.2
This Thesis
Although the current sample of embedded clusters in the Galaxy has considerably improved over the last years, so far there has not been any systematic
analysis in the literature dealing with the whole sample; in particular there is
no study combining all observed embedded and open clusters in an important
fraction of the Galaxy. The first goal of this thesis is thus the construction of a
merged list of all embedded and open cluster catalogs from the literature, dealing properly with cross-identifications and placing particular emphasis in the
part of the Galactic plane covered by ATLASGAL (|l| ≤ 60◦ and |b| ≤ 1.5◦ ),
where all further analysis is done.
While the distinction of embedded clusters from open clusters in these
catalogs has been made primarily via correlations with known H ii regions or
nebulae seen in the IR, the ATLASGAL survey allows us to objectively discriminate1 whether or not these objects are associated with dense molecular
material, in an unbiased and uniform way. This redefinition is important since
we have seen that embedded and open clusters are different astrophysical objects. On the other hand, the distribution of the ATLASGAL emission towards
each one of the clusters of our sample, if present, tells us how embedded is the
cluster and gives us some clues about the importance of the stellar feedback,
allowing us to delineate possible evolutionary stages. As mentioned before,
with proper statistics of these different stages, mainly of embedded clusters
relative to open clusters, we can test the different disruption mechanisms that
1
In combination with velocity information for cases of ambiguous physical relation.
7
Chapter 1. Introduction
are dominant at different stages of evolution and understand better how embedded clusters evolve into the production of field stars or bound open clusters.
For embedded clusters (and young open clusters also), further clues about the
relative evolutionary differences are provided by the characteristics of the midinfrared emission available from the GLIMPSE survey, via identification of
IRDCs, and IR bubbles or more irregular PAH emission. In this work, we
aim at addressing all these issues through careful inspection of each individual cluster within the ATLASGAL range, and subsequent statistics with an
appropriate treatment of the incompleteness.
The work presented in this thesis is organized in the following chapters:
• Chapter 2 gives a review of the current understanding of embedded cluster formation and early evolution, presenting the results of recent observational and theoretical investigations. The covered topics include the
theories of embedded cluster formation, the observed spatial distribution
of newly formed stars, stellar feedback mechanisms, the early dynamical evolution of an embedded cluster, and triggered star formation. A
companion appendix (Appendix A) presents some basic concepts of the
classical evolution of an open cluster, some of which are still useful when
studying embedded clusters.
• In Chapter 3, we describe the literature compilation of all embedded and
open clusters known so far in the Galaxy, including a new search for
embedded cluster we conducted on the GLIMPSE survey. We explain
how we constructed our final all-sky list after cross-identification, and
discuss about spurious detections.
• Chapter 4 presents a thoughtful study of the cluster sample within the
ATLASGAL Galactic range. We first constructed a big catalog with
many pieces of information regarding the characteristics of the ATLASGAL and mid-infrared emission; correlation with IRDCs, IR bubbles, and
H ii regions; distances (kinematic and/or stellar) and ages; and membership in big molecular complexes. We then delineate a possible evolutionary sequence and define embedded and open cluster types based on
ATLASGAL emission; study the spatial distribution and completeness;
and analyze the age distribution of open clusters in combination with
the statistics and typical ages of embedded clusters. The whole list of
clusters within the ATLASGAL range is given in Appendix B, together
with an important fraction of the compiled information in our catalog.
• In Chapter 5, we describe a follow-up study of the gas kinematics of a
subsample of 14 clusters exhibiting signposts of stellar feedback, via ded-
8
1.2. This Thesis
icated 13 CO(2−1) and C18 O(2−1) mapping observations. In particular,
we present a detailed analysis of the IR bubble G10.31−0.14.
• Finally, Chapter 6 summarizes the main conclusions of this thesis.
9
2
The current understanding of
embedded cluster formation and early
evolution
2.1
2.1.1
Formation of embedded clusters
Theories
Galactic molecular clouds have ubiquitously presented observational evidence
of supersonic turbulence (e.g., McKee & Ostriker 2007). On large scales, turbulence is highly supersonic and support the cloud against global gravitational
collapse. At the same time, however, supersonic turbulence creates a highly
transient and inhomogeneous molecular cloud structure which is characterized
by large density contrasts produced by shocked layers of gas. Under the right
conditions, high-density fluctuations can become gravitationally unstable and
decouple from the overall turbulent flow. The largest and most massive of these
fragments, or clumps, are potential sites of cluster formation. It is known that
the density contrast for isothermal gas scales with the Mach number M to the
second power (Klessen 2011), which means that for a typical M ∼ 10 we expect
density contrasts of roughly 100, consistent with the observed ratio between
clump (104 cm−3 ) and global (100 cm−3 ) average densities in GMCs. When
zooming in on cluster-forming clumps, one still observes supersonic Mach numbers of M ∼ 5, still leading to localized density fluctuations of a factor of 25
11
Chapter 2. Embedded cluster formation and early evolution
on average, which may exceed the critical mass for gravitational collapse to set
in. The presence of turbulence, therefore, makes the massive clump to break
apart into smaller units, or cores, and build up a cluster of stars with a wide
range of masses. This process is called gravoturbulent fragmentation, because
turbulence generates the distribution of clumps/cores initially and then gravity
selects a subset of them for star formation (Klessen 2011).
While now it is quite accepted that the density fluctuations that allow local
gravitational collapse in molecular clouds are produced by supersonic turbulent
motions, the exact mechanism through which the clump gas is accreted onto
the forming stars is not clear. Currently, there are two main possible models
regarding the formation itself of a stellar cluster that would explain the origin
of the so-called initial mass function (IMF), the distribution of stellar masses
at birth. This is now a key prerequisite to any theory of star formation given
that the IMF derived from observations presents strong evidences of universality in diverse environments (e.g., Kroupa 2002; Bastian et al. 2010). In the core
accretion model, collapses that produce individual stars or small multiple systems within a massive clump are local, so that different protostars are for the
most part not accreting from the same mass reservoir. The mass distribution
of the stars is set by the mass distribution of the regions of localized collapse,
the cores (e.g., Padoan & Nordlund 2002; Hennebelle & Chabrier 2008, 2009).
In contrast, in the competitive accretion model, collapses that produce star
clusters are global in nature, so all stars accrete from the same mass reservoir. In this case, the stellar mass distribution is determined by a competition
between formation of new, small fragments and growth of existing fragments
that continue accreting gas, specially at the center of the proto-cluster potential
(e.g., Bonnell et al. 2001; Bonnell & Bate 2006). One of the critical differences
between these two models is the formation of high-mass stars, which would
require, in the case of core accretion, the existence of single collapsing massive
cores that must not fragment during the star formation process in order to
be able to build up a single or binary massive star. Whereas some hydrodynamic simulations have indeed shown massive core fragmentation (e.g., Dobbs
et al. 2005), this can be reduced by considering the influence of protostellar
radiation on the gas heating (Krumholz et al. 2007), under the assumption
that the internal sources are formed before the core becomes susceptible to
fragmentation.
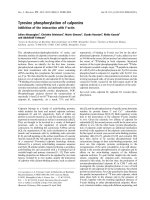
Figures 2.1 and 2.2 show different snapshots of a smoothed particle hydrodynamics (SPH) simulation of star formation in a GMC, performed by
Bonnell et al. (2011). The initial conditions consist of a 104 M cylindrical
molecular cloud of 10 pc length and 1.5 pc radius, a turbulent velocity field,
and a linear density gradient along the major axis making the top region grav-
12
2.1. Formation of embedded clusters
t = 0.37 tff
t = 0.96 tff
2 pc
Figure 2.1: Hydrodynamic simulations of star formation in a Giant Molecular Cloud,
shown at times 0.365 tff (left) and 0.961 tff (right), with tff 0.66 Myr. The size scale
of each panel is 10 pc on a side. The gas column densities are plotted on a logarithmic
scale from 0.01 g cm−2 (black) to 100 g cm−2 (white). Yellow and white dots are sink
particles representing forming stars. (From Bonnell et al. 2011).
itationally bound, while keeping the lower region slightly unbound. It can be
seen on the left panel of Fig. 2.1, which shows the simulation at 0.365 tff (with
tff 0.66 Myr), how turbulence and self-gravity establishes a complex network
of overdense filamentary structures from an initially smooth density distribution. Subsequent fragmentation lead to the formation of dense cores, specially
at the intersection of such filaments, where further gravitational collapse gives
birth to the first protostars, at a time of about 0.4 tff in this simulation. The
right panel presents a snapshot at 0.961 tff , close to the final computation time,
and shows the formed stars as white and yellow dots, represented numerically
as “sink particles” (point masses with the ability to accrete further gas). The
majority of the stars have formed in the upper gravitationally bound part of the
molecular cloud, mostly in a clustered mode, whereas a smaller fraction have
formed in the lower, gravitationally unbound regions, in a more distributed
way (see also § 2.1.2). If we zoom in on the top region around the highest
stellar densities and display different simulation times (Fig. 2.2), we can have
a better idea of the assembly history of the formed star clusters there. Newly
born stars fall into local potential wells and form small-N subclusters which
quickly grow by accreting other stars (and gas) that flow along the filaments
into the subcluster potential. Maschberger et al. (2010) carried out a detailed
analysis of the evolution of clustering in these simulations, following the track
of individual stars over the time, and found that the system in this region
undergoes a process of hierarchical merging of small-N subclusters and evolves
13