Analysis of the mechanical reaction of human endothelial cells to a single constant or transient uniaxial strain
Bạn đang xem bản rút gọn của tài liệu. Xem và tải ngay bản đầy đủ của tài liệu tại đây (6.82 MB, 84 trang )
Analysis of the Mechanical Reaction of Human
Endothelial Cells to a Single Constant or
Transient Uniaxial Strain
Dissertation
zur
Erlangung des Doktorgrades (Dr. rer.nat.)
der
Mathematisch-Naturwissenschaftliche Fakultät
der
Rheinische Friedrich-Wilhelms-Universität Bonn
vorgelegt von
Zhanna Santybayeva
aus Almaty, Kazakhstan
Bonn, 2013
II
Angefertigt mit Genehmigung der Mathematisch-Naturwissenschaftlichen Fakultät der
Rheinischen Friedrich-Wilhelms-Universität Bonn
1. Gutachter: Prof. Dr. Rudolf Merkel
2. Gutachter: Prof. Dr. Ulrich Kubitscheck
Tag der Promotion: 13.02.2014
Erscheinungsjahr: 2014
III
IV
Zusammenfassung
Eine Vielzahl von adhärenten Zelltypen ist ständig verschiedenen mechanischen
Belastungen ausgesetzt. Vaskuläre Endothelzellen, Alveolarzellen und Zellen des
Magen-Darm-Tracks erfahren beispielsweise periodische Deformationen durch den
Blutkreislauf, Atmung und Peristaltik. Die Zellen können diesen Belastungen
standhalten, indem sie die Deformation erkennen und durch biochemische oder
mechanische
Rückkopplung
entsprechend
reagieren.
Diese
Fähigkeit
wird
Mechanosensitivität genannt und ist von entscheidender Bedeutung für die normale
Zellfunktion, Proliferation und das Überleben. Die Weiteren ist die Mechanosensitivität
wichtig in pathogenen Prozessen wie Krebs, Atherosklerose und Plaquebildung [1]. Die
mechanische Zellantwort besteht im Umbau der internen spannungs-aufnehmenden
und spannungs-erzeugenden Strukturen wie z.B. im Aktomyosin-Zytoskelett und in den
fokalen Adhäsionen. Das hochdynamische Aktinnetzwerk besteht aus einzelnen
Aktinfilamenten und Aktinbündeln, die durch Kreuzvernetzer wie α-Actinin zusammen
gebunden sind. Mit Hilfe des kontraktilen Aktomyosin-Apparats kann das Netzwerk die
Kräfte an die zellulären Adhäsionsstellen vermitteln. Letztere sind mit den
Transmembranrezeptoren verbunden, die sich an der Außenseite der Zelle, z.B. an die
extrazelluläre Matrix oder an benachbarte Zellen befestigen. Somit werden intern
erzeugte Kräfte auf die Umgebung der Zelle übertragen, wodurch der gesamte Prozess
der Kraftaufnahme reziprok ist.
Die vaskulären Endothelzellen sind dafür bekannt, auf mechanische Reize reagieren
zu können, die in ihrer physiologischen Umgebung entstehen [2], wie zum Beispiel auf
Scherströmung und Druck der pulsierenden Bewegung des Blutes durch das Blutgefäß
oder auf eine angelegte radiale Kompression der glatten Muskulatur um die Vene.
Außerdem
erfassen
Endothelzellen
die
Steifigkeit
der
zugrunde
liegenden
Basalmembran, was ihnen die Fähigkeit verleiht, bei Entzündungen oder Atherosklerose
entgegenzuwirken [3]. Daher war es unser Ziel, die mechanische Reaktion der
Endothelzellen auf äußere Belastung zu analysieren. Hierfür wurden die Zellen auf
einem elastischen Substrat mit passender Elastizität kultiviert und einer uniaxialen
Dehnung ausgesetzt, um in vivo Bedingungen nachzuahmen.
Um diese Experimente zu realisieren, ist ein neuer Aufbau einschließlich geeigneter
Software entwickelt worden. Der Aufbau kombiniert die Lebendzellmikroskopie unter
V
nahezu physiologischen Bedingungen, die Zellkraftmikroskopie und die SubstratDehnung. Zwei Arten der Dehnungsprotokolle wurden verwendet: eine konstante 20%
Dehnung und eine transiente 20% Dehnung. Die Zellen wurden vor und nach der
Dehnung optisch abgebildet. Die Zugkräfte der Zellen wurden über die numerische
Lösung des Boussinesq-Problems des elastischen Halbraumes abgeschätzt [4]. Darüber
hinaus wurden geometrische Parameter wie Fläche, Orientierung, Ausdehnung und
Aspektverhältnis der Zellen vermessen. Die zwei Dehnungsprotokolle verursachten
zwei verschiedene Zellreaktionen. Die transiente Dehnung induzierte einen abrupten
Abfall der Zellkräfte um 20%, die sich innerhalb von 5 min wieder vollständig auf das
Vordehnungsniveau ausglichen. Andere visuelle Änderungen des Verhaltens von Zellen
wurden nicht beobachtet. Die Zellen änderten weder ihre Ausrichtung noch
Morphologie nach der transienten Dehnung. Im Gegensatz dazu führte eine konstante
Dehnung zu einem plötzlichen Anstieg der kontraktilen Kräfte von bis zu 150%. Nach
dem Strecken erhöhten sich diese Kräfte für etwa weitere 10 min. Danach fielen sie
entweder allmählich ab oder blieben auf dem maximalen Niveau stehen. In diesem
Dehnungsprotokoll zeigten überraschenderweise 90% der beobachteten Zellen Kräfte,
die
sich
nicht
bis
Vordehnungsniveau
zum
Ende
entspannten.
der
Beobachtungszeit
Gleichzeitig
wurden
(70-100 min)
auf
Zellorientierung
das
und
Ausdehnung während Messungen nach dem Strecken beibehalten: die Zellen folgten
einfach der Verformung des Substrats. Obwohl die Resultate im Einklang mit früheren
Befunden sind, motivieren diese Ergebnisse zukünftige Untersuchungen der genauen
beteiligten subzellulären Prozesse.
Die zwei Arten der Experimente erzeugten verschiedene mechanische Zellreaktionen.
Die Zellantwort war universell in jedem Dehnungsprotokoll: alle Zellen zeigten die
gleiche Reaktion, unabhängig von der Vorspannung der Zelle. Die Änderung der
kontraktilen Kräfte bedeutet, dass die Aktomyosin-Aktivität sich gemäß der angelegten
Spannung anpasst. Die Zellorientierung blieb in diesen Dehnungsexperimenten
konstant. Dies bedeutet, dass eine längere und wiederholte externe mechanische
Belastung notwendig ist, um die Zellorientierung entweder in Richtung minimaler
Dehnung oder Belastung zu ändern, wie es in zyklischen Dehnungsexperimenten
gezeigt wurde. Diese Beobachtungen motivieren weitere Untersuchungen der
Aktomyosin-
und
Aktinkreuzvernetzer-Kinetik
unter
einzelner
Dehnung
oder
Kompression, sowie der schrittweisen Änderung der Kontraktilität und Orientierung
der Zelle unter zyklischer Dehnung.
VI
Abstract
Many adherent cell types are continually exposed to a variety of mechanical stresses.
For instance, vascular endothelial cells, alveolar cells, and cells of gastrointestinal tract
experience periodic strains due to blood circulation, breathing and peristaltic activity. In
order to withstand those stresses, cells have to be able to perceive them and to react
accordingly through a biochemical or mechanical feedback. This ability, called
mechanosensitivity, is crucial for normal cell function, proliferation, and survival.
Mechanosensing is believed to be important in such processes as cancer, atherosclerosis
and plaque formation [1]. In particular, mechanical cell response is manifested in
modulation of the internal stress-bearing and stress-generating structures as actin
cytoskeleton and focal adhesions. The highly dynamic actin network consists of single
filaments and actin bundles, connected by a variety of cross-linking proteins like αactinin. The filaments transmit forces produced by the contracting actomyosin
machinery to the cellular adhesion sites. The latter connects to transmembrane proteins
anchoring to the outside of the cell, be that extracellular matrix or neighbouring cells.
Thus, internally generated forces are transmitted to the environment of the cell, implying
that the whole process is reciprocal.
In this work the mechanical response of vascular endothelial cells was studied. These
cells are known to be responsive to mechanical stimuli present in their physiological
environment [2], where they are exposed to shear flow and pressure of the pulsating
movement of blood through the vessel, and radial compression created by the smooth
muscle tissue encircling the vein. Besides, endothelial cells sense the stiffness of the
underlying basal membrane which is essential at counteracting in case of inflammation
or atherosclerosis [3]. Therefore, we aimed to examine the mechanical response of vein
endothelial cells to an external stress. Here, cells cultivated on an elastic substratum of
suitable elasticity were exposed to a uniaxial stretch in order to mimic in vivo conditions.
To realize these experiments, a new setup and suitable software have been
developed. The setup successfully combined live cell imaging at close to physiological
conditions, traction force microscopy, and substrate stretching. Two kinds of stretch
protocols were used: a constant 20% strain (also called stretch-and-hold) and a transient
20% (stretch-and-release).
VII
Cells were imaged before and after stretching for comparison. Cell traction forces
were calculated by solving the Boussinesq problem for infinite layers with the help of a
Fourier transform method combined with regularization [4]. In addition, such
geometrical parameters as cell area, orientation, elongation and aspect ratio were
measured. The two kinds of strain protocols prompted two different cell reactions.
Transient strain induced an abrupt drop of cell forces by 20% that recovered completely
to the pre-stretch level within 5 min. No other visual changes of the cell behaviour were
detected. Cells did not change their orientation or morphology after the stretch-release
cycle. In contrast, constant strain evoked a sudden rise of contractile forces by up to
150%. These forces continued to increase for about 10 min after stretching. After that
they either decreased gradually or remained at the maximal level. Surprisingly, in this
strain protocol 90% of the observed cells exhibited forces that did not relax to the prestretch levels until the end of observation (70-100 min). At the same time, cell orientation
and elongation persisted throughout measurements after stretching: cells simply
followed the deformation of the substrate.
The two types of experiments resulted in different kinds of mechanical response of
the cell. The cell response was universal under each strain type: in practice, all cells
displayed the same reaction, independently of the cell pre-stress history. The change in
contractility indicated that the actomyosin activity adapted according to the applied
stress. The cell orientation upon the stretch persisted in these single stretch experiments.
This implies that a longer and a repetitive exposure to external loads is necessary to
induce cell reorientation in either minimum stress or minimum strain direction as in
cyclic stretch experiments. These observations motivate further investigations of the cell
actomyosin and actin cross-linker kinetics upon single stretch or compression, as well as
of gradual change of cell contractility and orientation in cyclic stretch experiments.
VIII
Dedication
To my parents and my little brother
The force is strong with this one.
Darth Vader
IX
X
Acknowledgement
I am deeply grateful to my supervisor Prof. Dr. Rudolf Merkel for accepting me in
the field with zero experience in the cell culture work, and believing I would manage to
learn, for help and advice, and all the productive discussions together with Dr. Bernd
Hoffman.
Dr. Norbert Kirchgessner, Dr. Ronald Springer, Georg Dreissen for programming
tips and implementations, for facilitating analysis, tea-times, and serious and fun
discussions. Wolfgang Rubner, Johannes Fleischhauer, Werner Hüttner for giving hand
in the hardware and electronics matters. The IT crowd for the updates and fixing
computer problems.
Claudia Klamandt for always helping with documents, sympathy, and nice chats in
between the work.
Special thanks to my office-mate Kevin Küpper for giving important advice
concerning the lab and everyday life, and for the very first corrections, and Alex
Zielinski for always helping around in the lab and with cells. It has been a great pleasure
to work with Christian Kleusch, Cornelia Monzel, David Kirchenbüchler, and all the
colleagues, that I thank for being so friendly and supportive. Nico, Simone and Nils for
sharing the valuable experience of the lab work.
Thorsten Auth and my friends from the Biosoft for giving a chance to learn many
important things about and around science, and to upgrade soft skills. Many thanks to
my friends and scientific acquaintances, who kept me going, by sharing their successes
and fails, their opinions and challenges, and more importantly, for all the chocolate and
waffle breaks by the lake.
I thank my colleagues and friends who found the time to review the text of the
dissertation, even though they were very busy themselves. I’d like to thank everyone for
helpful suggestions and constructive criticism of the work. My super gratitude to my
super friend Simón Poblete, who read and reviewed this work, until it reached a
reasonable level of readability, for all fruitful discussions and interesting and inspiring
stories. All hail to the coffee and Radio 6 Music!
I express my greatest gratitude to my greatest parents and little brother for all the
irreplaceable support during all these years.
XI
XII
Table of Contents
Zusammenfassung ................................................................................................................. V
Abstract ................................................................................................................................ VII
Dedication .............................................................................................................................. IX
Acknowledgement ................................................................................................................ XI
Table of Contents ............................................................................................................... XIII
List of Figures ...................................................................................................................... XV
1.
Introduction .................................................................................................................... 1
1.1
Cell Mechanosensitivity............................................................................................ 1
1.2
Contractile Actin Cytoskeleton ................................................................................ 3
1.3
Cell Traction Forces ................................................................................................... 4
2.
Materials and Methods ................................................................................................. 8
2.1
Cell Culture ................................................................................................................ 8
2.2
Substrate Manufacturing and Treatment ............................................................... 9
2.3
Microscopy Setup .................................................................................................... 12
2.4
Software .................................................................................................................... 15
2.4.1
Acquisition Software ....................................................................................... 15
2.4.2
Autofocus .......................................................................................................... 15
2.4.3
Reference Image Correction ........................................................................... 16
2.4.4
Cell Force Analysis .......................................................................................... 18
2.4.5
Strains and cell orientation ............................................................................. 20
2.5
Calibration Measurements ..................................................................................... 21
2.5.1
X- and Y-Corrections ....................................................................................... 21
2.5.2
Z-Corrections.................................................................................................... 22
2.6 Experiment: Traction Force Microscopy of a Single Cell under Constant or
Transient Strains ...................................................................................................................... 23
3.
Results ........................................................................................................................... 26
3.1
Setup .......................................................................................................................... 26
3.2
General analysis ....................................................................................................... 26
3.3
Contractile Moments ............................................................................................... 30
3.3.1
Single Stretch-and-Hold ..................................................................................... 32
3.3.2
Single Stretch-and-Release ................................................................................. 37
3.4
4.
Cell Orientation, Aspect Ratio, and Area ............................................................. 41
Discussion ..................................................................................................................... 46
4.1
4.1.1
Cell Traction Forces ................................................................................................. 46
Stretch-and-Hold ................................................................................................. 47
XIII
4.1.2
4.2
Stretch-and-Release............................................................................................. 48
Cell Orientation, Aspect Ratio, and Area ............................................................ 49
5.
Conclusion ................................................................................................................... 52
6.
References....................................................................................................................... 1
Appendix A: Hardware ......................................................................................................... 7
Appendix B: Materials ........................................................................................................... 9
Appendix C: List of Micro-Manager Scripts ..................................................................... 11
Appendix D: List of Abbreviations .................................................................................... 13
XIV
List of Figures
Figure 1.1. Cartoon of a blood vessel .......................................................................................... 1
Figure 1.2. VECs mechanosensitivity. ........................................................................................ 2
Figure 1.3. Actin stress-fibre structure in non-muscle cells ..................................................... 3
Figure 1.4. Length change of a muscle sacromere under tension ........................................... 4
Figure 1.5. Cell traction force techniques. .................................................................................. 5
Figure 1.6. Deformation of the substrate by a cell. ................................................................... 5
Figure 1.7. Young’s modulus and Poisson’s ratio. .................................................................... 6
Figure 2.1. ....................................................................................................................................... 9
Figure 2.2. Composite fluorescence micrographs of pHUVECs. .......................................... 10
Figure 2.3. Fluorescent beads on the cross-linked PDMS substrates. .................................. 11
Figure 2.4. ..................................................................................................................................... 11
Figure 2.5. Cartoon of the setup ................................................................................................ 13
Figure 2.6. Detailed cartoon of the setup. ................................................................................ 14
Figure 2.7. Bright field micrograph of a cell. ........................................................................... 16
Figure 2.8. Displacement vector field ....................................................................................... 17
Figure 2.9. Cell force analysis image sequence........................................................................ 19
Figure 2.10. Inverted micrographs of fluorescent beads. ....................................................... 20
Figure 2.11. Bright field micrographs of a cell before (on the left) and after (on the right)
stretching. ..................................................................................................................................... 21
Figure 2.12. Demonstration of the displacement of a spot of interest due to stretching. .. 22
Figure 2.13. Schematic representation of the experiments. ................................................... 23
Figure 2.14. The scanning path of the substrate. .................................................................... 24
Figure 3.1. No-cell control measurements. .............................................................................. 27
Figure 3.2. Stretch-and-hold. ...................................................................................................... 27
Figure 3.3. Stretch-and-release................................................................................................... 28
Figure 3.4. Mean contractile moments of all experiments, including no cell controls. ..... 29
Figure 3.5. ..................................................................................................................................... 29
Figure 3.6. Example of normalization on a stretch-and-release experiment. ...................... 30
Figure 3.7. Normalized contractile moments of cells in the control experiments. ............. 31
Figure 3.8. The after-stretch increase of contractile moments in the stretch-and-hold
experiments .................................................................................................................................. 32
Figure 3.9. Normalized contractile moments in the stretch-and-hold experiments. ......... 32
Figure 3.10. Qualitative grouping. ............................................................................................ 33
Figure 3.11. Grouped normalized contractile moments in stretch-and-hold experiments.
........................................................................................................................................................ 34
Figure 3.12. Time when the maximal contractile moments were reached after the stretch:
(a) against the contractile moments before the stretch, (b) distribution, and (c) cumulative
plot. ................................................................................................................................................ 35
Figure 3.13. ................................................................................................................................... 36
Figure 3.14. Drop of contractile moments in the stretch-and-release experiment was
defined as a difference between the CM before the stretch-release cycle and right after. 37
Figure 3.15. Baseline correction of the linearly decreasing contractile moment................. 37
Figure 3.16. A first order exponential fit .................................................................................. 38
Figure 3.17. Normalized contractile moments in the stretch-and-release experiments. ... 38
Figure 3.18. Grouped normalized contractile moments in stretch-and-hold experiments.
........................................................................................................................................................ 39
XV
Figure 3.19. Recovery time of the contractile moments after the stretch: (a) plotted
against mean CM before stretching, (b) distribution, (c) cumulative plot. ......................... 40
Figure 3.20. Drop of contractile moments upon stretch: (a) plotted against the mean
contractile moments before stretching, (b) distribution. No correlation between mean
CM and drop observed (U test, ................................................................................................. 40
Figure 3.21. Cell orientation from ellipse fit. The angles ....................................................... 41
Figure 3.22. Substrate and cell deformation direction. .......................................................... 42
Figure 3.23. Immediate cell reorientation and direction of substrate deformation. .......... 42
Figure 3.24. Mean cell orientation before and after the stretch. ........................................... 43
Figure 3.25. Absolute cell orientation: (a, b, c) in the stretch-and-hold and (d, e, f) in the
stretch-and-release experiments. (a) and (d) before the stretch; (b) and (e) right after the
stretch; (c) and (f) at the end of the observation. .................................................................... 43
Figure 3.26. Cell orientation relative to the stretch direction. ............................................... 44
Figure 3.27. Cell area in SH........................................................................................................ 44
Figure 3.28. Immediate before and after the stretch aspect ratio and elongation of cells in
the stretch-and-gold experiment............................................................................................... 45
Figure 4.1. ..................................................................................................................................... 48
Figure 4.2. Fluorescence micrographs of pHUVECs transfected with pEGFP-vinculin. .. 51
XVI
1. Introduction
For survival and proper function, adherent cells have to actively respond and adapt to
biochemical and mechanical cues of the surrounding extracellular matrix or neighbouring
cells. The mechanical reaction of endothelial cells to uniaxial strains is of primary interest in
this work. The cells are able to alter their internal stresses and forces they apply in order to
withstand mechanical loads. Cell forces can be detected and evaluated with appropriate
traction force techniques.
1.1 Cell Mechanosensitivity
Primary human umbilical vein endothelial cells (pHUVECs) were studied in the current
work. Among the assortment of adherent cells, vascular endothelial cells (VECs) are of great
interest, because they naturally undergo a variety of mechanical stresses (Figure 1.1). Smooth
muscle cells covering the vein contract periodically to advance the blood through. At the
same time, blood presses on the walls of veins and shears the endothelium when flowing.
Furthermore, the cells are exposed to stresses applied by adjacent tissues. While forming an
inner lining of blood vessels, endothelial cells actively participate in many processes, such as
hemostasis, thrombosis, and vascular resistance [5].
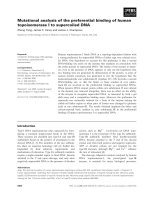
Figure 1.1. Cartoon of a blood vessel with applied forces [6]. EC – endothelial cells, BL – basement lamella, IEL
and EEL – internal and external elastic laminae.
It has been extensively demonstrated that endothelial cells sense structure, stiffness,
stress, and deformations of the underlying matrix [7]–[12]. Cell body orientation follows
1
patterns on the surface they adhere to (Figure 1.2. a). In addition, these cells sense the rigidity
of their substratum, a property that is essential in tubulogenesis [13] (Figure 1.2. b) and in
pathogenic processes, like atherosclerosis [3]. Furthermore, the cells actively rearrange
themselves and their inner structures as a result of application of external forces
(Figure 1.2. c).
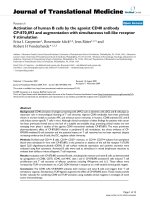
Figure 1.2. VECs mechanosensitivity. (a) HUVECs cultured on different topology [10]. (a1) On a flat surface have
no preferred orientation, (a2) on a ridged surface cells align along the seams. Scale bar 100 µm. (b) HUVECs
cultured on gels of different stiffness [13]. (b1) Grown on matrigel containing heat-denatured type I collagen, and
(b2) polymeric type I collagen. Scale bar 25 µm. (c) Monolayers of rhodamine phalloidine stained bovine aortic
endothelial cells [2]. (c1) No-stress control state. (c2) After 24 h exposure to 3 Pa shear stress. Scale bars 50 µm.
In this work, two kinds of strain protocols were applied: a transient and a constant
uniaxial stretch. A similar research on various cell types showed, that the cells respond to
stretch either by prompt fluidization of their cytoskeleton followed by its reinforcement or
only by stiffening of the cytoskeleton and reinforcement [14]–[18]. In attempt to resolve this
discrepancy it was speculated, that response of cells depends primarily on their cytoskeletal
prestress: stiffer cells react by fluidizing and softer cells reinforce in order to comply with the
applied stresses [19]. Other obvious explanations included dependence on the cell type,
experimental setup, etc. However, the exact mechanisms of the cell reaction remain unclear
although some clues have been suggested, in which the main role is given to the contractile
actomyosin network.
2
1.2 Contractile Actin Cytoskeleton
Cell integrity and shape are supported by its cytoskeleton, which is made up of three
types of filaments: actin filaments, intermediate filaments, and microtubules. Since actin
filaments together with motor proteins are the force-generating structures, they are of major
importance in this work. Actin filaments are highly dynamic structures made up of a
globular protein actin. They assemble and disassemble in a way that allows the cell to react
very fast to the changing conditions of the environment. Single actin filaments connected by
cross-linking proteins like α-actinin form actin bundles. Several bundles assemble into more
stable and thicker stress-fibres linked by a motor-protein non-muscle myosin. When the
latter changes its conformation by ATP (adenosine triphosphate) hydrolysis, an event known
as a power stroke, it causes stress fibre contraction.
Figure 1.3. Actin stress-fibre structure in non-muscle cells [20]. Depending on the location and function, three
main types of actin stress-fibres have been distinguished: ventral, transverse, and dorsal SF.
The structural organization of stress fibers varies depending on the location and their
direct function (Figure 1.4) [20], [21]. For instance, ventral SF have either graded structure or
sacromeric-like structure similar to that of muscle cells, so that they are able to extend or
contract, e.g. under changing tension (Figure 1.3). The ends of actin stress fibres connect to
adhesion protein complexes, creating an active framework of a cell, and defining its internal
stress, or called otherwise prestress [22], [23]. It was shown that actin filaments and entire
stress fibers are themselves able to function as mechanosensors, for instance, by inhibiting
binding of fiber severing proteins as cofilin under strain, or by means of focal adhesion
associated proteins, like zyxin and talin [24], [25].
3
Figure 1.4. Length change of a muscle sacromere under tension. [26] The structure elongates upon increased
strain.
Adhesion sites connect to the outside of the cell via transmembrane receptors of integrin
family. Thus, cell traction forces are transmitted to the extracellular matrix (ECM, a network
of proteins, such as fibronectin and collagen, and polysaccharides that compose intercellular
space) or adjacent cells.
1.3 Cell Traction Forces
Various methods of cell force detection have been developed. One of the first introduced
methods used wrinkling of a thin film to which cells adhered as a measure of applied force
[27] (Figure 1.5 a). However, this led to highly demanding calculations because of the nonlinearity of deformations. Other methods involve 3-dimensional microstructures, e.g.
micropillars [28], from which deflection cell forces are evaluated (Figure 1.5 b). However, the
structure might not exactly mimic the natural environment of cells. Other methods, induce
local deformations of a cell, such as micropipette aspiration (Figure 1.5 c), pulling on a
magnetic bead, to which a cell created contact, etc. [29]–[31]. The reported cell force
magnitude is in pN to nN range, depending on the cell type and cell activity.
4
a
b
c
Figure 1.5. Cell traction force techniques. (a) Wrinkling of a thin elastic lamella [32]. (b) Micropillars deflection
[33]. (c) Micropipette aspiration [29].
Figure 1.6. Deformation of the substrate by a cell. When adhered to a flat surface (dark grey ellipses are
adhesion sites) cells deform the upper layers by applying traction forces (dark arrows). Open arrows represent
deformation vectors. [34].
In the current work, the deformation of a flat substrate by a cell is used for cell force
detection (Figure 1.6). When a cell creates adherent contacts to an elastic surface, it deforms
its upper layers. In order to detect these deformations, fluorescent microscopic markers
(beads) are incorporated into the upper layer of the substrate material, so that beads displace
together with it. By comparing images of a relaxed substrate and those where cell was
applying force, one can evaluate cell forces. In order to get an image of a relaxed substrate,
the cell has to be detached from it mechanically or chemically (see Section 2.1). This method
of cell traction force calculation was first proposed by M. Dembo and Y.-L.Wang [6], and
improved by introducing a regularization of the solution by S. Houben and colleagues [34].
For simplicity, it is assumed that the material of the substrate is linear, isotropic, and
homogeneous, and that the deformation is homogeneous throughout the substrate. Knowing
the properties of the material (thickness, Young’s modulus and Poisson’s ratio) traction
forces can be calculated from these deformations. The linearity assumption permits to use
the Hooke’s law in a first approximation. Young’s elastic modulus characterizes stiffness of
5
elastic materials. It is a measure of how much force per area (stress ) should be applied to
deform a substrate to certain magnitude (strain ), and is defined as:
/
(1)
∆/
where F is the applied force, A is the cross-sectional area to which force is applied, Δl is the
elongation and l is the initial length of the object of interest (Figure 1.7 a).
Suppose, a rod made of an isotropic elastic material is being stretched along one
direction. It will compress in two other dimensions perpendicular to the force application.
The ratio between the transverse compression and the axial stretch is called Poisson’s ratio
(Figure 1.7 b):
(2)
where axial and transverse strains are the relative changes in length:
z
A
∆
∆
,
,
∆
.
Δy
y
a
Δl
l
x
b
Δz
Δx
Figure 1.7. Young’s modulus and Poisson’s ratio. (a) Force applied to the cross-sectional area of a bar causes
change in the length. The ratio between stress and strain is Young’s modulus. (b) Stretching a rod along x-axis
results in compression in y and z. The ratio between axial and transverse strains is Poisson’s ratio.
Force estimation assumes that the thickness of the substrate is infinite (>100 µm, or larger
than the lateral size of a cell) compared to deformations [7], [35], and therefore forces are
constrained to the surface, or said to be tangential. The deformations of the substrate are
related to the forces through a Green’s tensor in the Fredholm’s integral equation of the first
kind:
′
,
where
,
′
represents the deformation field, and
displacements
′
′
′
,
′
′
′
(3)
is the Green’s tensor, that relates surface
with (x, y) initial coordinates, and (x’ , y’) –
displaced coordinates, and material properties (Poisson’s ratio, , and Young’s modulus, E):
2 1
(4)
2 1
2 1
6
The expression (3) is a classical example of an ill-posed problem in numerical analysis, for
more than one solution exists for the same dataset: the same displacement field can result in
different deformations and forces. Moreover, the solution is very sensitive to minor changes
in the data. The solution was first elaborated by Boussinesq for a semi-infinite substrate [7].
Ideally, the expression (3) can be solved in two steps. The right-side of the equation is a
convolution of two functions. In Fourier space deconvolution is simply a product of the two
variables, and hence the solution for
is found in a rather straightforward way by system of
linear equations. However, any real measurement is not error-free. The uncertainty emerges
from the measurement inaccuracy, noise and limited spatial resolution of the detection
system, etc. Therefore, the validity of each solution must be checked through a regularization
procedure [4], [36], [37]. The best-known regularization procedure is Tikhonov regularization
that is similar to the least-squares method and minimizes the residual and penalty norms:
(5)
where
is the regularization parameter,
– identity operator,
and
are the calculated
forces and measured deformations, respectively.
A convenient measure of the whole cell mechanical activity that is conventionally used in
force evaluations is the first generalized moment [34]:
∑
,
,
,
,
(6)
This matrix can be diagonalized assuming the torque is zero, and its trace gives the sum
of its eigenvalues, i.e. the contractile moments:
∑
,
∑
,
. The net force
applied by a stationary cell on the surface is zero. Therefore, calculating forces only inside a
cell outline gives a more stable and reasonable solution.
7
2. Materials and Methods
In the current work primary human umbilical vein endothelial cells (pHUVECs) were
chosen as a model of study (Section 2.1). Adhered to flat silicone elastomeric substrates
(Sections 2.2 and 2.5) they were subjected to constant or transient uniaxial strain protocols
(Section 2.6). The short and long term mechanical response of cells was observed and
quantified with the help of the developed setup and software (Sections 2.3 and 2.4,
respectively).
2.1 Cell Culture
Primary HUVECs, originated from various donors, were supplied by Lonza (Cologne,
Germany) with an attributed passage number P0. In this study cells in passages 2-6 were
used. Primary HUVECs were cultured in endothelial growth medium EGM-2 (Lonza,
Cologne, Germany; see Appendix B for details) under physiological conditions (37 °C, 5% CO2
and 95% humidity; Heracell 150i, Thermo Scientific, Germany). To be transferred from culture
to substrates (see Section 2.2), cells were trypsinized. To do so, they were rinsed with
phosphate buffered saline solution (PBS; see Appendix B) and incubated in 1 ml (for a 35 mm
tissue culture dish) of 5% trypsin-EDTA solution (TE; see Appendix B; Sigma-Aldrich,
Munich, Germany) for 4 min at 37 °C. When cells detached, 2 ml EGM-2 were added to the
suspension to block trypsin digestion. The suspension was centrifuged for 3 min at 200 g
(Heraeus Labofuge 400, Thermo Scientific, Germany), and the pellet was resuspended in 1 ml
EGM-2 for further passaging or transfer. Approximately 1,500 cells were seeded in 200 µl
medium per substrate, so that by the time of acquisition there were single-lying cells (around
2,500 cells per sample). After 2 h of incubation, when cells formed stable contacts to the
substrates, 7 ml of EGM-2 were added for further 24 h incubation.
Before the experiment started, the substrates were washed with PBS to get rid of cell
debris. For imaging, samples were immersed in 20 ml EGM-2 with 20 mM HEPES (buffering
agent, 4-(2-hydroxyethyl)-1-piperazineethanesulfonic acid; Sigma-Aldrich, Munich, Germany),
in order to supply cells with sufficient nutrients during the whole experiment without
excessive evaporation. The latter supported pH of the medium at a physiological level
(pH 7.2) during the whole experiment. pH and osmolarity of once used media were
measured. These measurements showed that the same medium could be used for two or
three further experiments (pH and osmolarity ranged in 7.0-7.6 and 0.300-0.380 osmol/kg,
8
respectively). Moreover, random samples of the media were checked for contamination of
bacterial or fungal origin. No contamination was detected.
2.2 Substrate Manufacturing and Treatment
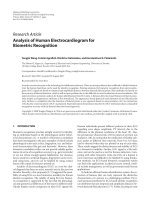
Flat ribbon-like (Figure 2.1 c) silicone elastomeric substrates were made of cross-linked
polydimethylsiloxane (PDMS, prepared from a two-component liquid Sylgard 184, Dow
Corning, Wiesbaden, Germany). The material exhibits physical and chemical properties,
necessary for the experiment. It is biocompatible, incompressible (Poisson’s ratio ~0.5) and
absorbs insignificant amount of water when immersed [34]. Moreover, its stiffness can be
tuned over a wide range of values (from several kPa to few MPa) by mixing the cross-linker
and the base in different ratios. The procedure for calibration of the Young’s elastic modulus
was developed by C. M. Cesa and co-workers [34], and every batch was calibrated by
N. Hampe (ICS-7, FZ Juelich) according to this procedure. The substrates used in the current
work had a Young’s modulus of 30 kPa. They were manufactured according to the moulding
and curing protocol [34]. The cross-linker was stirred thoroughly with the base in a 1:45
mass-ratio. The PDMS mixture was degassed and poured into moulding forms
(Figure 2.1 a, b).
a
b
20 mm
10 mm
c
d
Figure 2.1. (a, b) Cartoons of a mould. Scale bar 10 mm. (c) A substrate with (d) a close-up of the 100 nm high
microstructure with 3.5 µm lattice constant and 2 µm size on the substrate. Scale bar 2 µm.
9