VULNERABILITY ASSESSMENT OF DIFFERENT SOCIO ECONOMIC GROUPS TO FLOODS IN THE RURAL MEKONG DELTA OF VIETNAM
Bạn đang xem bản rút gọn của tài liệu. Xem và tải ngay bản đầy đủ của tài liệu tại đây (3.04 MB, 230 trang )
VULNERABILITY ASSESSMENT OF
DIFFERENT SOCIO-ECONOMIC GROUPS
TO FLOODS IN THE RURAL MEKONG DELTA OF VIETNAM
DISSERTATION
zur
Erlangung des Doktorgrades (Dr. rer. nat.)
der
Mathematisch-Naturwissenschaftlichen Fakultät
der
Rheinischen Friedrich-Wilhelms-Universität Bonn
vorgelegt von
VO VAN TUAN
aus
An Giang, Vietnam
Bonn, 2014
Angefertigt mit Genehmigung der Mathematisch-Naturwissenschaftlichen Fakultät der
Rheinischen Friedrich-Wilhelms-Universität Bonn
1. Gutachter : Professor. Dr. Sabine Tröger
2. Gutachter : PD. Dr. Jörn Birkmann
Tag der Promotion: 06.02.2014
Erscheinungsjahr: 2014
ii
Summary
The overall objectives of this study are, firstly, to identify and analyse the different factors
that characterise vulnerability and that explain the losses people experience resulting from
slow-onset floods and, secondly, to develop criteria and indicators to assess this vulnerability.
The thesis aims to enhance an understanding of the dynamics of vulnerability and response
capacities of people facing floods in rural areas in the upper Vietnamese Mekong Delta
(VMD). The research was conducted within the interdisciplinary WISDOM Project (Waterrelated Information System for the Sustainable Development of the Mekong Delta) and
embedded in Work Package 5000 on Water Knowledge and Vulnerability. Emphasis is thus
given to how varying socio-economic groups access and use their livelihood resources to
build livelihood strategies in the context of floods. It explores the influences shaped by the
transforming processes and structures in their flood response.
Theoretically and conceptually, the study is based on a framework modified from the BBC
Framework (Birkmann, 2006) and the Sustainable Livelihoods Framework (Chambers and
Conway, 1992). The framework deconstructs vulnerability in the three components of
exposure, susceptibility and capacity of response, and has provided conceptual means to
explore the subject matter from a holistic perspective in an interdisciplinary approach. In
order to get a more in-depth understanding of the framework components, the study draws on
theoretical concepts of disaster risk management, coupled human-environmental systems, and
institutional economics.
Both qualitative and quantitative methods were used to explore and triangulate information
and accordingly ensure the reliability and consistency of data collected. A literature review
and secondary data analysis provided information in terms of floods, flood damage, land use,
resettlements and flood-related policies. In-depth interviews during the field research enabled
the research to probe deeper research findings and explore the main relationships among
determinants influencing flood vulnerability. These interviews, along with focus group
discussions (FGDs) and participatory methods, were used for assessing the flood vulnerability
of local residents. A standardised household survey of 370 households located in riverbank
and inland areas in An Hoa and Phu Hiep Communes, Tam Nong District, Dong Thap
Province, complemented the approach.
Flood vulnerability indicators were identified by combining scientific literature and
investigated data. The indicators were then consolidated and validated through further
household interviews, official flood damage reports, expert interviews and FGDs with floodiii
exposed people. In accordance with the conceptual approach, this methodological proceeding
enabled a selection of exposure, susceptibility and capacity of response indicators.
Subsequently, relevant indicators and their weightings, which were verified by stakeholders’
perceptions, were operationalised. Vulnerability at the household level was then assessed
using the seven most important drivers of flood vulnerability, viz. (1) access to agricultural
land, (2) access to residential land, (3) type of house, (4) household assets, (5) demographic
composition of household, (6) remittances, and (7) income dependency.
Main findings: exposure, susceptibility and capacity of response
Annual slow-onset floods have occurred for thousands of years in the VMD; however, flood
characteristics have increasingly altered due to both climate change and human interventions.
In particular, the northern provinces of the VMD have experienced severe losses of life and
livelihood disruptions due to major floods, especially in the years 2000, 2001 and 2002.
The analysis of different flood patterns and the respective losses and damages due to high
floods revealed that changes in cropping types and strategies and interventions to reduce flood
risks, such as embankments, were the main drivers for the changes observed in exposure to
floods and loss patterns for different actors and groups. These changes are not primarily a
result of changing conditions in flood patterns, but rather are determined by socio-economic
transformation (e.g. renovation, resettlement, embankments and rice intensification). For
example, regarding the change in rice-based farming systems, rice-growing periods are
extended into the flooding season (from two to three rice crops per year). This also implies a
longer temporal exposure of these crops and assets to flood risk.
The analysis of flood vulnerability shows that access to agricultural land is particularly
important in terms of the households’ ability to respond to floods and sustain their livelihoods,
since it can be transformed into or used to access other livelihood assets. Access to
agricultural land enables people to generate income and access formal loans. In addition, land
and land certificates also function as important securities when facing losses, especially flood
impacts. Therefore, access to agricultural land is a major factor that determines flood
vulnerability in rural areas of Dong Thap. Historically, access to agricultural land and floodbased benefits such as fishing, vegetable collection, flood-related agriculture and advantages
of rice crop cultivation pushed many landless households to migrate to the Dong Thap
floodplains. Yet the household survey showed that approximately 40 per cent of in-migrants
could not access any agricultural land, because they had insufficient capabilities to reach or
protect their land use rights. In this regard, accessing, accumulating and protecting
iv
agricultural land can be viewed through the perspective of institutional economics to better
explore how in-migrants try to protect their land for flood adaptation and how they secure
their livelihoods. Although one might expect that in a socialist country like Vietnam access to
land was easily facilitated by the government, the interviews and vulnerability assessment
revealed that many farmers who failed to convert from growing floating rice to growing highyielding rice in the 1990s were also likely to lose their land because of a lack of financial
resources. In contrast, many of the households which are classified as wealthy have
successfully accessed and protected their allocated land.
Still, some of the households classified as poor and landless have been able to reduce their
flood vulnerability since they were able to gradually improve their housing conditions, to
successfully conduct (seasonal) out-migration, or were better-off after having been relocated
by the government. However, most households classified as poor and landless showed an
increase in vulnerability and a further erosion of adaptive capacity. Rural people in Dong
Thap have gained their flood-related knowledge through a trial and error process and through
the experiences of other farmers over time. However, when abnormal floods occur, such as
particularly high floods, their strategies fail to provide security. Past flood loss patterns show
that flood damage becomes severe when local knowledge is inappropriate.
The assessment and study undertaken in An Hoa and Phu Hiep Communes revealed that
economic opportunities for fishermen and poor households have significantly declined, so that
these groups have to deal with an erosion of their livelihood options. Many of the
breadwinners of these households migrate, seasonally or temporally, to urban areas for nonfarm jobs. As a result, children of poor households are insufficiently protected by adults and
also lack physical means of flood protection, such as appropriate shelters. A new trade-off and
balancing exercise during the flooding season can be observed between strategies to generate
remittances to deal with livelihood disruptions, and activities that require staying in the floodprone area to protect human and physical assets. Young labourers have shifted to non-farm
jobs in urban areas; however, they often undertake manual low-skilled jobs due to their low
educational levels and lack of professional expertise. Although this might be a reasonable
transformation process in some cases, various interviewed households either failed in
temporal migration or were not able to provide stable levels of remittances because of getting
low-skilled jobs. As a result, remittances, which could provide additional resources for
livelihood adaptation to floods, are quite limited.
The forced resettlement of poor flood-prone households into residential clusters and dykes has
helped the relocated households to either eliminate their exposure to floods or evacuate
v
rapidly when required. Although this resettlement has significantly reduced the flood
exposure, the vulnerability assessment shows that it has also increased susceptibility in many
cases due to new livelihood disruptions and insecurities. This results, for example, in
increasing daily costs of living, changes in the rural lifestyle, loss of social networks and
disruption of income-earning activities. Thus, many relocated households had to cope with the
adverse effects of the new situation and had to undertake second-order adaptation measures to
the above shocks triggered by the resettlement process. In this context, many relocated
households have developed new strategies (e.g. off-farm labour teams) that enable them to
cope with new types of shocks.
Furthermore, the analysis of capacities to respond to floods shows that flood-related coping
and adaptation mechanisms are diverse and sometimes constrain each other since they are
implemented by different actors and socio-economic groups without considering the negative
effects for other households or regions. For example, embankments have helped landowners
to protect their rice production from floods, but this has caused the decline in flood-related
resources that negatively influence livelihoods of the poor. Both coping and adaptation have
contributed to reducing flood damage, but informal or non-governmental versus
formal/governmental strategies often encompass quite different actions and sometimes may
even generate mismatches. Formal coping strategies conducted by the government, such as
harvesting rice threatened by floods, evacuation, and distribution of relief food, encourage
flood-affected households to respond to extreme flood events. Informal coping is linked to
knowledge gained over the years. In the slow-onset flood context, coping processes have
contributed to enhancing flood adaptation. However, in some cases, governmental adaptation
strategies (e.g. embankments and resettlement) can contradict local knowledge, since the
flooding conditions might have fundamentally changed and some resources for coping and
adapting to floods (e.g. flood-related resources and local materials for housing) are not
available any more.
The study has revealed that different socio-economic groups implement different coping
measures because of their differential access to livelihood assets. Hence, households classified
as poor usually undertake coping activities because of inadequate livelihood assets that would
enable them to adapt while wealthier households mainly develop adaptation options, since
they have resources to do so.
Finally, the vulnerability of local communities to floods is shaped by flood-related policies
and transformation. The concept of “living with floods” that was formulated by a series of
governmental decisions and socio-economic development programmes after the destructive
vi
floods in 2000 is judged to be a beneficial strategy by various stakeholders since residents’
livelihoods are closely associated with floods. However, major loss and harm in times of high
floods also challenge the concept. The transforming structures, including relocation,
embankments and agricultural intensification, have caused positive and negative impacts on
local residents regarding their ability to “live with floods”. Embankments, mainly built during
the 2000s in order to reduce flood impacts, have strongly modified vulnerability profiles and
have provided an important basis for further changes in the management of flood-exposed
crops. Embankments have functioned on the one hand as measures to increase human
security, and on the other hand as an intervention to support further intensification of rice
production. Consequently, the findings underscore that, although the government has
successfully reduced flood exposure with such embankments, it has introduced additional or
intensified existing conflicts between landowners and flood-based resource users during the
flood season. This illustrates that a comprehensive vulnerability assessment, differentiating
the effects flood intervention tools have on various socio-economic groups, is a prerequisite
for the identification of sustainable disaster risk reduction and flood adaptation measures.
vii
Acknowledgements
I have completed my doctoral research because of the enthusiasm of Professor Dr. Sabine
Tröger, and P.D. Dr. Jörn Birkmann. They have fostered my research ideas through
encouraging me to explore the hidden factors shaping vulnerability and to theoretically and
empirically interpret the facts and research findings. I particularly wish to thank them for their
critical insights and valuable comments during the writing process.
The institutional support afforded to me by the Department of Geography, Faculty of
Mathematics and Natural Science, University of Bonn, is gratefully acknowledged. I also
received financial support, for which I am most appreciative, from the Ministry of Education
and Research (BMBF) in Germany, through the Water-Related Information for Sustainable
Development of the Mekong Delta (WISDOM). In relation to this, I wish to thank Dr. Claudia
Künzer, a coordinator of the WISDOM, for efforts in running the project as well as helping
me with links to various research partners.
I also wish thank people whom I learned from while I carried out this research. The people
who live in the flood-prone areas, Phu Hiep Commune, and the riverbank area, An Hoa
Commune, gave me the first ideas relating to flood-based livelihoods and flood-related
adaptation. They shared their time, food, drink as well as their experiences, feelings and
stories they have accumulated through living with floods. They also talked about current
challenges they face and future expectations. Their openness, kindness, hospitality and
enthusiasm helped me to better understand flood-related damage from the perspective of those
who have experienced it, their response capacity as well as the major drivers shaping flood
vulnerability at the household level. They helped me to change my subjective thinking and
address complicated research questions, which was invaluable to the analysis. Local staff,
particularly members of the local Committees for Flood and Storm Control in Tam Nong
District and Dong Thap Province, shared valuable guidance in terms of empirical work and
statistical data, as well as providing annual reports, documents, experience, and historical
narratives relating to the research. These staff explained how local and central institutions
have implemented flood-related interventions and assisted local residents in responding to
flood impacts. They individually indicated major factors and an importance of each indicator
influencing vulnerability to annual slow-onset floods in rural floodplains.
The support of my colleagues in the Mekong Delta Research Development Institute (MDI)
and other institutions at Can Tho University was extremely useful and greatly appreciated.
They helped me to develop my research ideas and understanding and to conduct the empirical
viii
work, especially the standardised household survey. I am sincerely grateful to Dr. Tran Thanh
Be and Associate Professor Dr. Nguyen Van Sanh, my directors, who have supported and
shared their knowledge. I wish to thank Dr. Dang Kieu Nhan, Associate Professor Dr. Nguyen
Duy Can, Associate Professor Dr. Vo Thi Thanh Loc, Dr. Vu Anh Phap, my vice directors,
who helped me to implement the study. I am also thankful to Associate Professor Dr. Duong
Ngoc Thanh and Dr. Le Canh Dung, my heads of the Department of Socio-Economics and
Policy, who supported me in my research. I also wish to thank Huon, Truc, Chanh, Buu, Khai,
Liem, Luan, Phuc, Son, Tam, Toan and Tuan, who are staff of the MDI who helped carry out
the qualitative research and the household survey in the flood-prone area in Dong Thap.
I wish to acknowledge the love and support of my family, especially my parents, my brothers,
my wife and my son. My wife, Truong Thi Kim Loan, my son, Vo Duy Thong, and my young
sister, Vo Thi Thao, faced many challenges when I was abroad for study, but they always
encouraged me to overcome barriers in order to achieve the research outcomes. Without their
material and spiritual help, I could not have finished this dissertation.
My friends who worked together in the WISDOM doctoral family are Nguyen Thanh Binh,
Nguyen Viet Dung, Nguyen Thai Hoa, Le Thi Anh Hong, Nguyen Nghia Hung, Pham Cong
Huu, Jose Delgalo, Judith Ehlert, Vo Phuong Hong Loan, Matthias Garschagen, Nadine Reis,
Tadjana Bauer and Pham Van Toan. They shared knowledge and offered support during my
doctoral research, particularly regarding my empirical work in the Vietnamese Mekong Delta.
Finally, I wish to thank my friends and colleagues at the United Nations University-Institute
for Environment and Human Security (UNU-EHS). I gratefully appreciate the support and
guidance given to me by Professor Dr. Janos Bogardi, PD. Dr. Joern Birkmann, Dr. Fabrice
Renaud, Dr. Zita Sebesvari, Dr. Mathias Garschagen and Philipp Koch who work with the
WISDOM. I also want to thank Evalyne, Helene, Neysa, Niklas, Dr. Nishara, Dr. Denis, Dr.
Torsten, Dunja, Maike, Claudia, Maria and Tobias who supported me in administrative work
and shared their experience in relation to vulnerability research when I was in Bonn. In
particular, I wish to thank Associate Professor Dr. Teresa Sobieszczyk, a Fulbright Scholar,
who helped me to improve the writing and language of this study.
ix
Table of Content
Summary
iii
Acknowledgements
viii
Table of Content
x
List of Figures
xiv
List of Tables
xv
Abbreviations
xvi
1. Introduction
1
2. Theoretical Background and Conceptual Approaches
10
2.1. Introduction ..................................................................................................................... 10
2.2. Disaster Risk Research .................................................................................................... 10
2.3. Vulnerability Research .................................................................................................... 13
2.3.1. Vulnerability ....................................................................................................... 13
2.3.2. Bohle’s Double Structure of Vulnerability ......................................................... 18
2.3.3. BBC Conceptual Framework ............................................................................. 19
2.3.4. Coupled Social and Ecological Systems ............................................................ 20
2.3.5. Vulnerability Assessment ................................................................................... 21
2.4. Livelihood Research ........................................................................................................ 22
2.4.1. Sustainable Livelihoods Approach ..................................................................... 22
2.4.2. Sustainable Livelihoods Framework .................................................................. 24
2.5. Institutional Economics ................................................................................................... 25
2.5.1. Institutional Economic Approach ....................................................................... 26
2.5.2. Transaction Costs and Access to Major Natural Resources ............................... 26
2.5.3. Conflicts over Natural Resources ....................................................................... 27
2.6. A Modified Analytical Framework ................................................................................. 27
2.6.1. Conceptual Framework ...................................................................................... 27
2.6.2. A Modified Conceptual Framework ................................................................... 28
3. The Mekong Delta - Geographical and Thematic Context
31
3.1. Introduction ..................................................................................................................... 31
3.2. Main Characteristics of the Vietnamese Mekong Delta .................................................. 31
3.2.1. The Natural Condition in the Vietnamese Mekong Delta .................................. 32
3.2.1.1. Topography......................................................................................................... 32
3.2.1.2. Soil Condition .................................................................................................... 33
3.2.1.3. Climate Conditions............................................................................................. 33
3.2.1.4. Hydrology........................................................................................................... 34
3.2.1.5. Physical Geographical Features and their Interactions with Floods and People’s
Livelihoods ....................................................................................................................... 35
3.2.2. Floods and Changes in Flood Regimes .............................................................. 35
3.2.2.1. The Context of Slow-Onset Floods in the Vietnamese Mekong Delta .............. 35
3.2.2.2. Changes in Flood Regimes in the Vietnamese Mekong Delta ........................... 37
3.2.3. Socio-Economic and Political Transformation .................................................. 38
3.2.3.1. Population Pressure and Poverty ........................................................................ 40
3.2.3.2. Migration Patterns and Access to Agricultural Land ......................................... 41
3.2.3.3. Change in Agriculture ........................................................................................ 43
3.2.3.4. Vietnamese Governmental Transforming Structures at Flood Risk Reduction . 44
3.3. Research into Rural Livelihoods and Water-Related Hazards in the VMD .................... 45
4. Research Questions and Research Methodology
47
4.1. Research Questions ......................................................................................................... 47
4.1.1. Introduction ........................................................................................................ 47
x
4.1.2. Research Objectives ........................................................................................... 48
4.1.3. Research Questions ............................................................................................ 48
4.2. Research Methodology .................................................................................................... 50
4.2.1. Introduction ........................................................................................................ 50
4.2.2. Research Design ................................................................................................. 51
4.2.2.1. Research Process ................................................................................................ 51
4.2.2.2. Research Site Selection ...................................................................................... 52
4.2.2.3. Target Groups ..................................................................................................... 54
4.2.2.4. Sampling............................................................................................................. 56
4.2.3. Data Collection and Interpretation ..................................................................... 57
4.2.4. Data Analysis...................................................................................................... 59
4.2.5. Research Limit and Focuses ............................................................................... 60
5. Exposure Trends, Flood Losses
62
5.1. Characteristics of Flooding Events in the Rural Floodplains of Dong Thap .................. 62
5.2. Loss and Damage Profile ................................................................................................ 63
5.2.1. Loss of Wet-Season Paddy ................................................................................. 63
5.2.2. Damage to Temporary Housing and Major Infrastructure ................................. 66
5.2.2.1. Major Public Infrastructure Damaged due to Floods ......................................... 67
5.2.2.2. Temporary Houses Damaged by Floods ............................................................ 67
5.2.3. Main Socio-Economic Groups Affected by Floods ........................................... 69
5.2.3.1. Children of Poor Households as Main Flood Victims ........................................ 69
5.2.3.2. Poor People Exposed to Physical and Psychological Shocks and Stresses ........ 70
5.2.3.3. Landless Residents Exposed to Disruption in Income-Earning Activities by
Floods 71
5.2.3.4. Changes in Flood Exposure for Landowners ..................................................... 71
5.3. The Changes in Flood Damage Patterns in the Last Decades ......................................... 72
5.4. The Trends in Flood Exposure ........................................................................................ 75
5.4.1. Flood Exposure in the Context of Climate Change............................................ 75
5.4.2. Flood Exposures Shaped by Dams and Embankment ........................................ 75
5.4.3. Resettlement Patterns Influencing People Exposed to Flood Impacts ............... 76
5.4.4. Agricultural Intensification Shaping the Changes in New Exposed Crops ....... 77
5.5. Positive Effects of Flood Exposure ................................................................................. 79
5.5.1. Food-Related Resources for Household Consumption ...................................... 79
5.5.2. Fishing as a Main Income Activity of Rural Landless Households ................... 80
5.5.3. Floods as Benefits for Crop Production and Flood-Based Agriculture .............. 81
5.6. Main Factors of Susceptibility to Slow-Onset Floods .................................................... 82
5.6.1. Susceptibility to Floods Shaped by Natural Conditions..................................... 82
5.6.1.1. Severe Acid Sulphate Soils ................................................................................ 82
5.6.1.2. Water Pollution ................................................................................................... 83
5.6.2. Susceptible Sources of Income .......................................................................... 84
6. Local People’s Reactions to and Capacity to Access Resources in the Context of SlowOnset Floods
86
6.1. Coping Activities of Local Communities ........................................................................ 86
6.1.1. Coping with Human Insecurity .......................................................................... 87
6.1.2. Adjustment Flexibility Regarding Housing Condition ...................................... 87
6.1.3. Temporary Evacuation ....................................................................................... 87
6.1.4. Coping with Livelihood Disruption ................................................................... 89
6.1.4.1. Flood-Related Resource Exploitation ................................................................ 89
6.1.4.2. Seasonal Migration ............................................................................................. 91
6.1.4.3. Collective Coping Patterns ................................................................................. 93
6.1.5. Changes in Coping Processes ............................................................................. 95
xi
6.2. Adaptation of Local Communities in the Context of Slow-Onset Floods ...................... 95
6.2.1. In-migration ........................................................................................................ 96
6.2.2. Housing Adaptation ............................................................................................ 96
6.2.3. Income Earning Strategies.................................................................................. 98
6.2.3.1. Traditional Adaptive Crops and Practices .......................................................... 99
6.2.3.2. Agricultural Intensification .............................................................................. 100
6.3. Capacity of Different Socio-Economic Groups to Access Resources and Respond to
Floods ............................................................................................................................ 101
6.3.1. Introduction ...................................................................................................... 101
6.3.2. Access to Natural Assets for Rural Communities in the Rural Floodplains .... 102
6.3.2.1. Access to residential land ................................................................................. 102
6.3.2.2. Constraints to Access to Agricultural Land ...................................................... 103
6.3.2.3. The Decline in Flood-Related Resources ......................................................... 106
6.3.3. Access to Physical Assets ................................................................................. 107
6.3.4. Access to Financial Assets ............................................................................... 109
6.3.5. Access to Human Capital ................................................................................. 112
6.3.5.1. Acquirement and Dissemination of Flood-Related Knowledge ...................... 112
6.3.5.2. Constraint to Human Capital Generation ......................................................... 114
6.3.6. Access to Social Capital ................................................................................... 117
6.3.6.1. Neighbourhood and Off-farm Worker Teams................................................... 117
6.3.6.2. Religion ............................................................................................................ 118
6.3.6.3. Local Flood-Related Institutions ...................................................................... 119
6.4. Effects of Adaptation Strategies on the Adaptive Capacity of Local Communities ..... 120
6.4.1. Livelihood Change Initiated by Resettlement .................................................. 120
6.4.2. Livelihood Change Caused by Agricultural Intensification ............................ 124
7. Assessment of Local Flood Vulnerability
128
7.1. Introduction ................................................................................................................... 128
7.2. Indicator Development .................................................................................................. 128
7.2.1. Access to Agricultural Land ............................................................................. 130
7.2.2. Access to Residential Land .............................................................................. 131
7.2.3. Type and Quality of Houses ............................................................................. 132
7.2.4. Access to Physical Household Assets .............................................................. 132
7.2.5. Demographic Composition of Households ...................................................... 133
7.2.6. Access to Remittances from Urban Areas ........................................................ 133
7.2.7. Income Dependency ......................................................................................... 134
7.3. Indicator Weighting ....................................................................................................... 134
7.4. Vulnerability Aggregation ............................................................................................. 136
7.5. Socio-Economic Characteristics and Their Impacts on Flood Vulnerability Patterns .. 137
7.5.1. Agricultural Land Ownership........................................................................... 139
7.5.2. Household Wealth ............................................................................................ 140
7.5.3. Types of Main Income Sources ........................................................................ 141
7.5.4. Residents’ In-migration Periods ....................................................................... 142
7.5.5. Relocation Patterns ........................................................................................... 143
7.6. Transferability of the Local Vulnerability Assessment ................................................. 145
7.6.1. Disaster Risk Reduction in General ................................................................. 145
7.6.2. Climate Change Adaptation in Vietnam ........................................................... 145
7.6.3. Local Vulnerability of Flood Risk Reduction Strategies .................................. 146
7.6.4. Transferability on Different Social and Spatial Scales ..................................... 147
7.6.4.1. Flood Vulnerability at the Household Level .................................................... 147
7.6.4.2. Flood Vulnerability at the Community Level................................................... 148
xii
7.6.5. The Local Vulnerability of Water-Related Information Systems for Sustainable
Development in the Upper Rural Flood-Prone Areas .................................................... 149
8. Transforming Structures in Flood Risk Governance and Their Impacts on Vulnerability
Patterns
151
8.1. Legal Frameworks and Institutions Relating to Flood Risk Governance ..................... 151
8.1.1. Policies in Relation to Flood Risk Governance ............................................... 152
8.1.2. The Committee for Flood and Storm Control and Its Roles in Flood Risk
Governance..................................................................................................................... 154
8.1.2.1. Planning and Coordination ............................................................................... 154
8.1.2.2. Planning and Participation in Decision-Making Processes .............................. 154
8.1.2.3. Coordination Mechanism ................................................................................. 156
8.1.2.4. Reporting Hierarchies ...................................................................................... 156
8.2. Formal Coping Processes in Flood Risk Governance ................................................... 161
8.2.1. Unstructured Formal Coping Measures ........................................................... 162
8.2.2. Structured Formal Coping Measures ................................................................ 164
8.2.2.1. Critical Infrastructure and Agriculture Protection ............................................ 164
8.2.2.2. Emergency Aid ................................................................................................. 164
8.2.2.3. Protecting Children from Flood Risks ............................................................. 164
8.3. Major Formal Adaptation Processes in Flood Risk Governance .................................. 166
8.3.1. Embankment Measure ...................................................................................... 167
8.3.2. Relocation Measure .......................................................................................... 168
8.4. The Influences of Transforming Structures on Social Vulnerability Patterns ............... 170
8.4.1. Influences on Exposure .................................................................................... 171
8.4.1.1. The Influence of Relocation Policy on Flood Exposure .................................. 171
8.4.1.2. The Influence of Embankment on Flood Exposure ......................................... 171
8.4.2. The Influences on Susceptibility ...................................................................... 172
8.4.2.1. The Influences of Relocation Policy on Flood Susceptibility .......................... 172
8.4.2.2. The Influences of Embankment on Flood Susceptibility ................................. 172
8.4.3. The Influences on Adaptive Capacity .............................................................. 173
8.4.3.1. The Influences of Relocation Policy on Adaptive Capacity to Flood Impacts 173
8.4.3.2. The Influences of Embankments on Adaptive Capacity .................................. 174
8.5. Governmental Transforming Structure Influences on Human Agency ......................... 174
9. Conclusion
177
References
190
Appendixes
195
Household Survey Questionnaire
198
xiii
List of Figures
Figure 1: Flood duration and flood depth in the year 2000 in the Vietnamese Mekong Delta .. 2
Figure 2: Coping and adaptation in relation to impact and change .......................................... 16
Figure 3: Bohle’s conceptual model on double structure of vulnerability ............................... 19
Figure 4: BBC Conceptual Framework .................................................................................... 20
Figure 5: Sustainable Livelihoods Framework ........................................................................ 25
Figure 6: A modified analytical framework by the author based on the combination of ......... 29
Figure 7: Flood duration in the high flooding depth area in the Mekong Delta ...................... 37
Figure 8: The peaks of floods in the upper Vietnamese Mekong Delta ................................... 38
Figure 9: An increase in landlessness rate in the rural Mekong Delta ..................................... 43
Figure 10: The locations of the research sites in the Vietnamese Mekong Delta..................... 53
Figure 11: A schematic overview of the research process ........................................................ 55
Figure 12: Indicator development and vulnerability assessment process ................................ 58
Figure 13: Changes in floods in the field and major crops in Tam Nong regarding
embankment ............................................................................................................................. 62
Figure 14: Rice destroyed by seasons due to floods in Dong Thap (1994-2011) .................... 65
Figure 15: Houses damaged and destroyed by floods in Dong Thap (1994-2011) .................. 68
Figure 16: People killed by floods in Dong Thap .................................................................... 70
Figure 17: Structure of economic loss caused by floods in Dong Thap ................................... 73
Figure 18: Economic losses due to flood impacts in Dong Thap Province ............................. 74
Figure 19: Transect map of the inland site, Phu Hiep Commune (west-east direction) ........... 77
Figure 20: Transect map of the riverbank site, An Hoa Commune (west-east direction) ........ 77
Figure 21: Structure of planted paddy area by seasons in Dong Thap Province ...................... 78
Figure 22: Rice with reduced yield due to floods in Dong Thap Province .............................. 79
Figure 23: Change in amount of fertiliser applied for rice production in the rural Mekong
floodplains ................................................................................................................................ 83
Figure 24: Changes in main sources of income within the last 10 years (1999-2009) ............ 90
Figure 25: Structure of main occupation within each land size group ..................................... 92
Figure 26: Structure of main occupation across land ownership groups ................................. 93
Figure 27: Seasonal crop calendar in Phu Hiep Commune, Tam Nong District ...................... 97
Figure 28: Local knowledge pertaining to flood-related adaptation ...................................... 100
Figure 29: Changes in main sources of income regarding different land ownership and
relocated groups ..................................................................................................................... 101
Figure 30: Types of house of different land ownership and relocated groups ....................... 106
Figure 31: Access to essential physical assets regarding land ownership and relocated groups
................................................................................................................................................ 108
Figure 32: Social and crop map of Phu Hiep Commune........................................................ 123
Figure 33: Social and crop map of An Hoa Commune .......................................................... 124
Figure 34: Indicator weighting regarding different perceptions ............................................ 136
Figure 35: Household vulnerability regarding land ownership .............................................. 140
Figure 36: Household vulnerability regarding household wealth .......................................... 141
Figure 37: Household vulnerability regarding main income sources .................................... 142
Figure 38: Household vulnerability regarding in-migration periods ..................................... 143
Figure 39: Vulnerability of households regarding relocation patterns ................................... 144
Figure 40: Organisational structure of the CFSCs at various levels ...................................... 155
Figure 41: The number of available day-care houses for children in Dong Thap from 2001 to
2011 ........................................................................................................................................ 165
Figure 42: The construction of residential clusters and dykes and relocated households in
Dong Thap .............................................................................................................................. 168
xiv
Figure 43: Financial sources and distribution for the second phase of the construction of
residential places (2008-2012) ............................................................................................... 169
List of Tables
Table 1: Major reform events and interventions in Vietnam after unification in 1975 ............ 40
Table 2: Major events affecting resettlement and land ownership in the Mekong Delta ......... 42
Table 3: The plan for the construction of residential clusters and dykes in the VMD and Dong
Thap .......................................................................................................................................... 44
Table 4: Samples for the standardised household survey ......................................................... 57
Table 5: Changes in the number of income sources regarding land ownership and relocated
groups ....................................................................................................................................... 90
Table 6: Major coping activities and adaptation patterns of local households in the rural VMD
.................................................................................................................................................. 94
Table 7: Changes in the structure of household income in the last decade regarding different
land ownership and relocated groups ....................................................................................... 99
Table 8: Past land ownership of current land ownership and relocated groups ..................... 104
Table 9: Agricultural and residential land of different land ownership and relocated groups 105
Table 10: Basic family profile of different land ownership and relocated groups ................. 115
Table 11: Basic profile regarding the different occupations of main labourers ..................... 116
Table 12: Historical events at the riverbank site in An Hoa Commune, Tam Nong District . 120
Table 13: Historical events in the inland site, Phu Hiep Commune ....................................... 122
Table 14: Changes in mechanisation and labour used in winter-spring rice production (1 ha)
................................................................................................................................................ 126
Table 15: Major indicators to measure flood vulnerability in the VMD ................................ 129
Table 16: Weights of indicators measuring flood vulnerability at the household level ......... 135
Table 17: Aggregated vulnerability of different socio-economic groups ............................... 138
Table 18: The flood-related policies and interventions in the Vietnamese Mekong Delta .... 153
Table 19: Weaknesses and possible solutions of CFSC at the provincial level...................... 159
Table 20: Main formal coping and adaptation patterns of local authorities in the rural upper
VMD....................................................................................................................................... 166
Table 21: Embankment in Phu Hiep and An Hoa Communes ............................................... 167
Table 22: Residential cluster and dyke construction relocation households in Phu Hiep and An
Hoa ......................................................................................................................................... 170
xv
Abbreviations
ASEAN
AW
CCFSC
DARD
DFID
DOC
DOET
DOLISA
DONRE
DOIT
DPI
FA
FGD
GDP
GSO
HYV
IPCC
IRRI
ISDR
KIP
MARD
CMHF
MONRE
MRC
PAR model
PC
PRA
RCA
SA
SES
SPSS
UNFCCC
UN-ISDR
UNU-EHS
USD
VBARD
VBSP
VMD
VND
WB
WISDOM
WS
WTO
WU
YU
Association of Southeast Asian Nations
Autumn-winter rice crop
Central Committee for Flood and Storm Control
Department of Agriculture and Rural Development
UK Department for International Development
Department of Construction
Department of Education and Training
Department of Labour, Invalids and Social Affairs
Department of Natural Resources and Environment
Department of Industry and Trade
Department of Planning and Investment
Farmer’s Association
Focus Group Discussion
Gross Domestic Products
General Statistical Office
High-Yielding Rice Varieties
Intergovernmental Panel for Disaster Reduction
International Rice Research Institute
International Strategy for Disaster Reduction
Key Informant Panel
Ministry of Agriculture and Rural Development
Centre for Hydro-Metrological Forecasting
Ministry of Natural Resources and Environment
Mekong River Commission
Pressure and Release model
People’s Committee
Participatory Rural Appraisal
Red Cross Association
Summer-autumn rice crop
Socio-Ecological Systems
Statistical Package for the Social Sciences
United Nations Framework Convention on Climate Change
United Nations-International Strategy for Disaster Reduction
United Nations University-Institute for Environmental and Human Security
United State Dollar
Vietnam Bank for Agriculture and Rural Development
Vietnam Bank for Social Policies
Vietnamese Mekong Delta
Vietnamese Dong
World Bank
Water-Related Information System for Sustainable Development of MD
Winter-spring rice crop
World Trade Organisation
Women Union
Youth Union
xvi
1.
Introduction
Vietnam is located in the southeast coastal region of Asia and is among the most disasterprone countries in the world (Dasgupta et al., 2007; Carew-Reid, 2007). Slow-onset river
flooding is among the most destructive natural hazards in Vietnam. They occur regularly and
abnormally in the context of climate change and human interventions (e.g., land use change
and embankments). Furthermore, Vietnam and the Vietnamese Mekong Delta in particular
have been subject to major changes in recent history. The delta has not only undergone major
socio-economic transformations but is also highly affected by climate change. Both have
changed and will continue to significantly change the impacts of natural hazards.
For example, although historically the VMD has seldom been hit by typhoons (Mao et al.,
1992), recent observations showed that the hurricane trajectories of Vietnam have shifted
slightly to the south. Thus, because both flooding and typhoons have coincided, in the future
typhoons and floods may occur concurrently in the delta. This is a concern since local people
will be exposed to new and compound natural hazards. Indeed, recently, several typhoons
passed the edge of the delta; however, these typhoons caused serious damage to local
livelihoods. The extent of devastation that is possible was seen in 1997, when Typhoon Linda
(also called Typhoon No. 7) in the south of Vietnam killed over 2,200 people working on the
sea and caused significant damage to crops and properties in the VMD, even though it
occurred at the end of the flooding season (CCFSC, 1991-2000). This means that local
residents are facing different hazards patterns, particularly different flooding patterns, because
they have changed due to climate variability.
Sea level rise will also shape the delta’s impacts of flooding substantially. Regarding sea level
rise scenarios of 20 and 45 cm, Wassmann et al. (2004) indicate that sea levels could
potentially increase the water level during high flooding discharge in the delta from 11.9 and
27.4 cm, respectively. Moreover, flood regimes are strongly influenced by human physical
interventions (e.g., dams for hydro-power plants or irrigation) in the Mekong Basin that have
also shaped the livelihoods of people in the rural riparian communities in the lower Mekong
Basin (Weaderbee, 1997; Dore et al., 2007; Greancen and Palettu, 2007). As flood regimes
have changed in water discharge and duration, and a combination of floods and other natural
hazards like typhoons and sea level rises have been predicted by scientists, the impacts of
slow-onset floods on local communities have also been altered and need to be understood.
Slow or flash-onset river floods significantly affect human lives, infrastructure and incomeearning activities in the world. According to Pedizzi (2006), between 1990 and 2000 the total
1
number of deaths related to floods worldwide was 170,010. In recent years, although the
number of people killed by floods has decreased, the number of affected people and economic
damage has increased significantly. Populous South East Asian countries are among the most
exposed to annual catastrophic flooding, and Vietnam is one of the most highly exposed
countries. In Vietnam, both slow and flash floods cause serious damage and loss of crops and
infrastructure and are responsible for a high number of human fatalities1. Floods have killed
about 6,000 Vietnamese people within the last 20 years, approximately 43 per cent of the total
number of victims of natural hazards. While flash-onset floods usually occur in the northern
and central regions because of the steeply sloped landscape, annual slow-onset floods severely
affect the VMD in the south.
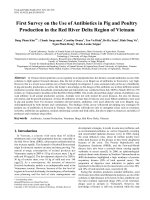
Figure 1: Flood duration and flood depth in the year 2000 in the Vietnamese Mekong Delta
(Source: Garschagen, 2013)
1
According to data collected by the CCSFC (1989-2008), the total number of people killed by natural hazards in
Vietnam between 1989 and 2008 was approximately 13,900; of which the number of deaths caused by slowonset floods was 4,557, accounting for 33 per cent of fatalities caused by natural hazards.
2
In the Mekong River Basin, annual floods are natural phenomena; however, high floods result
in human fatalities, damage to crops and infrastructure and disruption to social and economic
activities (MRC, 2003). In the VMD, an approximately 1.9 million hectares of land,
accounting for 50 per cent of its total natural area, is inundated by annual slow-onset floods.
Within this area, 11 million people, 65 per cent of its population, are exposed to flood risks.
Rice crops, basic infrastructure (e.g., houses, roads, and bridges) and people who lived in
temporary houses and worked in floodplains were most exposed to slow-onset floods impacts.
Since 2003, flooding has decreased because of a reduction in water discharge from upstream;
however, the high floods that occurred in 2011 caused massive economic losses. One of the
major reasons was that people started growing more the autumn-winter rice (AW rice) which
is always grown during the flooding season through the construction of full flood-control
embankments. Generally, flooding depths do not vary much; however, the level of damage
will be significantly higher if flooding increases by only 20 to 30 cm given the flat shape of
the delta (Nha, 2004). Significant economic losses and human fatalities are related to flooding
depths exceeding 4.5 metres as measured at Tan Chau Gauging Station, which is located in
the upper VMD. Small floods may also cause adverse effects for many rural residents since
they constrain many parts of their lives. They cause a decrease in flood-related resources (e.g.,
wild aquatic species, alluvial sediments and freshwater) and an increase in grasses, pests (e.g.,
rats and insects), crop diseases, agro-chemical concentration in the upper delta as well as
salinity intrusion in the coastal regions. Moreover, livelihood activities or agriculture in the
delta follow seasonal schedules shaped by cyclic climate conditions. Therefore, any changes
in not only the intensity but also the timing of floods may damage agriculture and rural
livelihoods. Moreover, the impact of the flooding caused by high or low floods influences
different socio-economic groups in a different ways.
Flood calamity is not only influenced by flood events or flood change, but also by natural and
socio-economic conditions, which both enable and constrain exposed residents to respond to
floods differently. Since the VMD was formed by slow alluvium deposition, has an elevation
of mostly only 1.0 metres above mean sea level (Sanh et al., 1998; Hoi, 2005), and is located
in the downstream section of the long international Mekong River, it is prone to both riverflooding from the upstream stretches of the Mekong River and to sea level rises from the
ocean. Moreover, approximately 41 per cent of agricultural land in the delta is influenced by
potential or active acid sulphate soils (Sanh et al., 1998), which are unfavourable for various
types of crop cultivation such as fruit trees, rice and vegetables. Therefore, in the initial
resettlement of the rural floodplains, when acid sulphate soils were still severe, farmers faced
3
many challenges in rice production. In such fragile conditions where there are groups of
people or elements exposed to floods, their susceptible circumstances have also shaped their
flood vulnerability. In reality, flooding which causes injury, death and financial loss mainly
occurs in the remote floodplains where new settlers live and poor basic infrastructure
dominates.
Although floods are considered natural destructive hazards, there are positive attributes
associated with floods as well. In contrast to flash floods, slow-onset flooding provides both
risks and livelihood opportunities to rural residents. In the rural VMD, people cope with and
adapt to slow-onset floods that last nearly half a year. Floods are not only perceived as natural
risky hazards, but also as livelihood opportunities. Crop damage, infrastructure damage,
human injury and death are all aspects associated with floods; however, the annual slow-onset
floods in the Mekong Basin also contributes to the wealth of biodiversity, abundance of fish,
and soil fertility as well as helping to eliminate pests, crop disease, crop waste and
agrochemicals (MRC, 2003; Hoi, 2005). Annually, the Mekong River provides a series of
benefits for people’s livelihoods in riparian communities (Hoanh et al., 2003). In the VMD,
many households have created livelihoods out of flood-related resources. For instance, local
residents take advantage of the floods by applying intensive cultivation (e.g., fresh water
prawn or intensive snakehead fish) and extensive production (e.g., vegetables, fish, eels and
frogs). In addition, other professions such as making boats, nets, hooks and fishing traps also
benefit from floods. Moreover, people often consume flood-related resources as common-pool
resources. During flooding seasons, the boundary between paddy field plots is unclear,
creating an open-access regime for common-pool resources in large areas. Therefore,
residents in the rural floodplains can earn much of their income and requirements for staple
foods (e.g., fish, shrimp, snails and flood-based vegetables) in the flooded quasi-open-access
areas. However, as a result of these livelihoods, these particular households, which live on the
floodplains and are reliant on flood-related resources, are also severely exposed to flood risks.
Potential flood impacts are influenced by how local residents make trade-offs between
livelihood opportunities and flood risks. In the VMD, landless and poor people migrate to
rural floodplains for livelihood opportunities through both formal and informal mechanisms.
Therefore, the net in-migration rate in the rural floodplains in Dong Thap was positive.
Historically, in-migrants hoped to reclaim, buy or be allocated agricultural land as well as to
exploit flood-related resources However, in previous years, the trend of migration flow has
changed. The net out-migration rate in the VMD increased from 9.9 per cent in 1999 to 40.4
per cent in 2009 (Marx and Fleische, 2010). For example, in the past, Dong Thap experienced
4
high in-migration. Many households formally and informally resettled in the rural floodplains
in order to access new livelihood opportunities, focusing mainly on fishing and obtaining
agricultural land that was initially allocated to in-migrants. These residents accepted living
with flood risks in order to take flood-related benefits and achieve their desired livelihood
outcomes. This explains why many households resettled and thrived on the rural floodplains.
However, in recent years, this trend has reversed. Now out-migration dominates. This is
largely because when natural resources decline alongside developing opportunities in urban
areas, local residents, particularly landless residents, seasonally or temporally migrate in
search of new livelihood opportunities in urban and industrial regions (mainly Ho Chi Minh
City, Binh Duong and Dong Nai). It is therefore important to gain understanding into the
different push and pull factors, the changes in migration flows and how migration is related to
flood vulnerability. In short, floods and flood-related resources affect the livelihoods of
various socio-economic groups differently, which in turn influences their vulnerability to
floods. This means that the flood vulnerability of different groups also depends on changes in
flood-related livelihood opportunities as well as their access to these livelihood resources.
Response(s) to a hazard play(s) an important role in reducing risks since some responses
contribute to a decrease in the vulnerability of people at risk. Hence, vulnerability cannot be
assessed without taking into account the capacity of a community to absorb, cope with and
adapt to the impacts of a hazardous event (Westgate and O’Keefe, 1976). Each household has
its own livelihood assets and capacity to access these assets, which are accumulated over time
(Swain et al., 2008). At the household level, capacity to respond to a hazard is associated with
people’s property rights and their access to livelihood resources in order to build or adjust
their response strategies to mitigate hazardous impacts. In the rural VMD, income from ricebased farming systems at the household level is a major income source as the planted area of
paddy production accounts for approximately 99 per cent of the annual grain crops (GSO,
1990-2010). Therefore, access to agricultural land plays an important role in shaping rural
livelihoods, which influence people’s vulnerability to flood impacts.
Based on their livelihood assets, each socio-economic group is vulnerable in different ways to
the same flooding conditions. However, many households have failed to access their
agricultural land so that there are now a high number of landless households in the rural
floodplains in Dong Thap. This is a significant concern given that land is the major productive
asset for rural residents. Constraints and costs in accessing and protecting agricultural land in
the floodplains could be one of the key determinants influencing in-migrants to respond to
floods effectively. Therefore, it is important to understand how farmers could protect their
5
agricultural land better. In addition, the use of the livelihood assets of varying socio-economic
groups may reshape flood vulnerability. For example, in the rural floodplains, the lack of
access to agricultural land has constrained farmers’ access to formal financial institutions as
well as becoming a member of local famer associations (Swain et al., 2008).
In addition to the informal strategies of households, it is also important to take into account
formal strategies developed by the government. In consideration of the fact that the VMD has
both great potential for agriculture and high vulnerability to severe flooding (Miller, 2003;
Sanh et al., 1998), the Vietnamese government announced a strategy of “living with floods”2.
It has been applied in flooding areas through physical interventions (e.g., the construction of
embankments and residential clusters and dykes) and via a set of policies stimulating incomeearning activities and economic development in the rural floodplains. In consequence, a series
of flood-related interventions (e.g., embankment, farming system change, relocation) have
been implemented in order to mitigate flood impacts and develop agriculture within the full
flood-control areas. In the upper VMD, the physical flood-related interventions of local
governments are characterised by creation of semi-flood-control areas, full flood-control areas
and residential clusters and dykes. These measures create substantial changes in residents’
livelihoods (Nha, 2004; Miller, 2003). After the devastating floods that occurred in 2000,
many semi- and full flood-control embankments were built in order to protect most areas that
experience significant flooding.
However, while these aim to be positive changes, it has been shown that the technological
interventions usually applied to mitigate hazardous impacts can actually increase vulnerability
(McLaughlin and Dietz, 2007). In the rural VMD, embankments have influenced flood
duration in full flood-control areas, which in turn have induced changes in rice-based farming
systems. Rice crops, particularly AW rice crops are more exposed to dyke breakage due to
high flood impacts. Moreover, the construction of residential clusters and dykes, mainly by
the governments after the 2000 floods, were used to relocate poor households who have no
residential land or live in areas severely prone to flood risks. Such flood mitigation projects,
enforced since the 2000 floods, in many case have changed the rural livelihoods of people
exposed to floods. The relocated residents have escaped from flood impacts; however, they
2
The strategy of “living with floods” was launched in 1996 based on Decision No. 99-TTg of the Prime
Minister. This strategy has promoted a long-term plan for the development of irrigation, transport and
construction, especially embankments and residential clusters and dykes, to enable people to live with floods in
the VMD.
6
are confronted with new socio-economic constraints such as livelihood disruption as well as
high expenditure (Danh and Mushtaq, 2011).
Moreover, conflicts among natural resource users in the rural floodplains may occur regarding
these embankments. Local residents in flood-prone areas compete in using natural resources
since flood-related resources and agricultural land are located in the same areas; yet, these
differentiated resources are expected to maximise the utility of both landless and land
ownership groups. These land use purposes influence water management patterns through
flood-related mitigation measures like embankments that make it possible to protect and
develop rice crops from flooding but eliminates flood-related resources (e.g., fish and floodrelated vegetables). In reality, embankments in the rural floodplains excluded landless
households since mainly agricultural landowners joined meetings for decision-making
processes. Landless residents are the main flood-related resource users but are relatively
powerless in sub-regional land use decision-making. The decline in flood-related resources,
one of the consequences of embankment projects, has reduced livelihood opportunities of
both relocated and non-relocated poor residents. The concern is how impacts of flood-related
mitigation interventions, especially embankments, have shaped people’s flood vulnerability,
especially regarding changes in flood-related livelihoods.
Vietnam’s political-economic reforms, also called “Doi Moi” policy, have also affected rural
livelihoods and influenced flood response capacity. Since the 1980s, Vietnam has shifted from
a centrally planned economy to a free-market economy incorporating measures that have
strongly contributed to changes in agricultural intensification in the 1990s. The transition has
led to several essential reforms in the agricultural sector: households began to be considered
autonomous and independent economic units, and agricultural land was distributed. Through
these reforms, Vietnam began moving away from a country that faced food shortage in the
1980s to a country producing large amounts of food exports in the 1990s. This induced
significant land use changes in the VMD. Within one decade of the “Doi Moi” policy’s
launch, the amount of rice-planted land in the delta increased by 60 per cent, of which a large
area of single floating rice was converted to the double High-Yielding rice Varieties (HYV).
This conversion has negatively affected flooding conditions and flood-related resources in the
rural floodplains since changes in cropping patterns have also constrained natural resource
development. In brief, the areas experiencing the most significant flooding have the maximum
agricultural use potential. With over 17 million people in the VMD, of which approximately
7
12.3 per cent (Que and Thanh, 2011) live under the general poverty line3 of less than 1 USD a
day, the poor have struggled to both deal with floods and earn their livelihoods. Moreover,
because of socio-economic constraints they face challenges in accessing livelihood assets,
which impedes their ability to cope with and adapt to flood impacts.
Both flooding and flood-related interventions have strongly affected coupled humanenvironment systems, in which human activities (e.g., embankments, flood-related resource
use) and environmental conditions (e.g., flooding conditions, flood-based resources) interact.
However, a natural hazard (e.g., flooding) alone is not able to convert a risk into a disaster if
there are no elements or people at risk, and hazardous impacts may be reduced if exposed
elements have less vulnerability or high resilience to the hazard (Cardona, 2004; Adger,
1996). Therefore, vulnerability cannot adequately be characterised without simultaneously
considering its major components, including exposure, susceptibility and capacity of response
in a dynamic process (Birkmann, 2006; Cardona, 2004). Accordingly, understanding the
vulnerability of varying socio-economic groups at risk before, during and after a particular
disaster are critical activities for developing an appropriate disaster risk reduction strategy
(Birkmann, 2006) and hazard-based livelihood enhancement (e.g., flood-related livelihoods).
Following this notion, a vulnerability assessment to floods in the context of the VMD implies
that the susceptibility and capacity of response of exposed elements or groups of people
should be examined within the transforming structure and process that exist. The building of
coping and adaptation strategies for each socio-economic group may be shaped through their
interpretation of the flood context, the transforming processes and structures, and their ability
to create or access livelihood resources. Since flood vulnerability partly depends on their
flood-based livelihoods, flood adaptation strategies are constructed and enforced through their
own livelihood resources. Consequently, an assessment of people’s vulnerability to floods is
related to clarifying their level of access to livelihood assets for their flood response
strategies. The significantly different flood damage outcomes experienced by various socioeconomic groups in the rural floodplains indicates that many unidentified factors shaping
human flood vulnerability need to be explored. A lack of studies into the vulnerability of
different socio-economic groups regarding the impacts of slow-onset floods may influence the
effects of physical interventions in order to mitigate flood damage in the delta. Thus, the
emerging questions are how people in flood-prone areas are vulnerable to annual slow-onset
3
The general poverty line is a minimal level of consumption including both food and non-food goods and
services.
8
floods, and which factors have influenced different socio-economic groups in accessing their
livelihood resources for coping with and adapting to flood impacts.
Since vulnerability research requires an interdisciplinary approach, more emphasis has to be
given to understand and address the interrelated dynamics of social structure, human agency
and environments (McLaughlin and Dietz, 2007). In this context Birkmann (2006)
underscores the fact that a vulnerability assessment needs to be based on a comprehensive and
holistic approach and should take into account the dynamic nature of vulnerability and the
underlying causal factors. Moreover, flood vulnerability is related to the biophysical
dimension (e.g., rural floodplains), human agency and transforming structures and processes.
Vulnerability assessment at the household level should therefore encompass both qualitative
and quantitative approaches in order to interpret human agency and the livelihoods of varying
socio-economic groups in the rural floodplains of the VMD.
Taking into account all these issues, the main aim of this study is to understand how to
analyse factors that characterise vulnerability and that explain people’s losses and problems
due to slow-onset floods in the rural floodplains of the VMD. The secondary aim is to develop
criteria and indicators to assess vulnerability based on this analysis. The objective is to
enhance knowledge regarding the dynamics of vulnerability and response capacities of people
facing floods in rural areas in the upper VMD. To provide a comprehensive understanding of
these issues, the study tries to highlight both negative and positive impacts of the
transforming processes and structures on flood vulnerability.
The thesis consists of nice chapters. The introduction chapter explains the flood vulnerability
of different socio-economic groups in the VMD. The second chapter examines theoretical and
conceptual approaches to flood vulnerability and the research framework. The third chapter
presents the general background of the VMD and Dong Thap Province that contributes to
flood vulnerability as well as the capacity of response to floods. The fourth chapter presents
the research objectives and questions and the methodology used. The fifth chapter analyses
flood exposure and past flood damage and fatalities. The sixth chapter focuses on people’s
reactions to floods and access to livelihood resources for flood responses. The seventh chapter
develops and describes the indicators and criteria to aggregate flood vulnerability at the
household level. The eighth chapter discusses people’s coping and adaptation processes
regarding transforming processes and structures. The final chapter provides a general
discussion, a theoretical reflection regarding vulnerability assessment, the major research
findings, policy relevance and outlook.
9