Probiotics as a novel approach to modulate incretins, insulin secretion and risk factors of type 2 diabetes and complications
Bạn đang xem bản rút gọn của tài liệu. Xem và tải ngay bản đầy đủ của tài liệu tại đây (1.5 MB, 105 trang )
Institut für Ernährungs- und Lebensmittelwissenschaften (IEL)
an der Landwirtschaftlichen Fakultät der Rheinischen Friedrich-Wilhelm-Universität Bonn
Probiotics as a novel approach to modulate incretins, insulin
secretion and risk factors of type 2 diabetes and complications
Inaugural-Dissertation
zur
Erlangung des Grades
Doktor der Ernährungs- und Lebensmittelwissenschaft
(Dr. oec. troph.)
der
Landwirtschaftlichen Fakultät
der
Rheinischen Friedrich-Wilhelms-Universität Bonn
von
Marie-Christine Simon
aus
Ratingen
Referent:
Korreferent:
Tag der mündlichen Prüfung:
Erscheinungsjahr:
Prof. Dr. rer. nat. Peter Stehle
Prof. Dr. med. Nanette Cathrin Schloot
13.12.2013
2014
Das Staunen ist der Anfang der Erkenntnis.
Platon (ca. 427 v.Chr. - 347 v.Chr.)
Summary
Background and Aim: Ingestion of probiotics can modify gut microbiota and alter insulin
resistance and diabetes development in rodents. We hypothesized that daily intake of
Lactobacillus (L.) reuteri increases insulin sensitivity by changing cytokine release and
insulin secretion via modulation of glucagon-like peptide (GLP-1, GLP-2) release.
Material and Methods: A prospective, double-blind, randomized trial was performed in 21
glucose tolerant humans (10 obese; age 51±2 years, BMI 36.0±4.8 kg/m2; 11 lean; 49±4
years, BMI 23.6±1.9 kg/m2). Participants ingested 1010 L. reuteri or placebo b.i.d. over 4
weeks. Oral glucose tolerance and isoglycemic glucose infusion tests were used to
assess GLP-1, GLP-2 and C-peptide secretion, hyperinsulinemic-euglycemic clamps with
[6,6-2H2]glucose to measure peripheral insulin sensitivity (M-value) and endogenous
glucose production (EGP). Muscle and hepatic lipid contents were measured by 1H
magnetic resonance spectroscopy. Immune status was assessed by measuring systemic
cytokines, high-sensitive C-reactive protein (hsCRP) and lipopolysaccharide (LPS)
concentrations.
Results: Intervention did not affect body mass, ectopic fat content and circulating
cytokines. M was 37% lower (p<0.01) in obese than in lean volunteers, but both M-value
and EGP did not change upon L. reuteri treatment. However, administration of L. reuteri
increased glucose-stimulated insulin and C-peptide secretion by 49% (p<0.05) and 55%
(p<0.05), respectively. Moreover, administration of L. reuteri improved the glucosestimulated GLP-1 and GLP-2 release by 76% and 43%, respectively, compared to
placebo (p<0.05).
Conclusions: Enrichment of gut microbiota with L. reuteri increased incretin-mediated
insulin and C-peptide release, without effects on insulin sensitivity in glucose tolerant
human subjects. These results suggest that modifying the microbiome could increase
insulin secretion and thereby serve as a novel therapeutic tool for the treatment of type 2
diabetes. However, further studies are needed to address this issue in this emerging
research field.
1
Zusammenfassung
Hintergrund: Die Einnahme von Probiotika führt bei Nagetieren zu einer Modifizierung
der Darmflora und nachfolgend zu einer Veränderung der Insulinresistenz sowie
verzögerten Entwicklung eines Diabetes mellitus. Unsere Hypothese lautet, dass es durch
die tägliche orale Einnahme von Lactobacillus (L.) reuteri über 4 Wochen und die sich
daraus ergebende Veränderung der menschlichen Darmflora zu einer gesteigerten
Sekretion der Darmhormone GLP-1, GLP-2, sowie einer verbesserten Insulinsensitivität
und -Freisetzung kommt.
Material und Methoden: Eine prospektive, doppelblinde, randomisierte, zweiarmige
Studie mit 21 Probanden mit normaler Glukosetoleranz (10 adipöse Personen, Alter 51±2
Jahre, BMI 36,0±4,8 kg/m2, 11 schlanke Personen, Alter 49±4 Jahre, BMI 23,6±1,9 kg/m2)
wurde durchgeführt. Die Probanden nahmen konstitutiv zweimal täglich 1010 L. reuteri
oder Plazebo über 4 Wochen ein. Ein isoglykämischer i.v. Glukoseinfusionstest analog zu
den
Blutzuckerspiegeln
des
vorausgegangen
oralen Glukosetoleranztests wurde
durchgeführt, um den Inkretineffekt sowie die Insulinsekretion zu untersuchen. Zur
Messung der peripheren (M-Wert) und hepatischen Insulinsensitivität (endogene Glucoseproduktion, EGP) wurde ein euglykämischer-hyperinsulinämischer Clamp unter Einsatz
eines nicht-radioaktiven Tracer (6,6[2H2]Glukose) durchgeführt. Ektope Fetteinlagerungen
in Muskel und Leber wurden mittels 1H Magnetresonanzspektroskopie (MRS) gemessen.
Der systemische Immunstatus wurde anhand systemischer Spiegel von Zytokinen, hoch
sensitivem C-reaktivem Protein (hsCRP) und Lipopolysaccarid (LPS) erfasst.
Ergebnisse: Die 4-wöchige Einnahme von L. reuteri hatte keinen messbaren Einfluss auf
Körpergewicht und Körperfettanteil. Der M-Wert von adipösen Probanden war 37%
niedriger (p<0,01) verglichen mit dem der schlanken Teilnehmer, jedoch blieben M-Wert
und EGP unter der Intervention mit L. reuteri oder Plazebo unverändert. Die Einnahme
von L. reuteri führte jedoch zu einer Glucose-stimulierten Erhöhung der Insulin- (49%,
p<0,05) und C-Peptid- Sekretion (55%, p<0,05). Desweiteren führte die Einnahme von L.
reuteri zu einer Erhöhung von Glucose-stimulierten GLP-1 und GLP-2 um 76% bzw. 43%
(p<0,05) verglichen zur Plazebo-Gruppe.
Zusammenfassung: Die tägliche Einnahme von L. reuteri über 4 Wochen erhöht Inkretinvermittelt die Insulin- und C-Peptid-Sekretion, ohne jedoch die Insulinsensitivität der
glukosetoleranten Probanden zu beeinflussen. Das lässt vermuten, dass die probiotische
Modulation der Darmflora die Insulinsekretion verbessert und somit als therapeutischer
Ansatz bei Personen mit Diabetes Anwendung finden könnte. Im Hinblick auf die aktuelle
und durchaus kontroverse Informationslage in diesem Forschungsgebiet bedarf es
weiterer Studien, um diesen Effekt von Probiotika noch genauer zu untersuchen.
2
Index
Summary .............................................................................................................................. 1
Zusammenfassung .............................................................................................................. 2
Abbreviations ...................................................................................................................... 3
Figures ................................................................................................................................. 5
Tables ................................................................................................................................... 6
Introduction ......................................................................................................................... 7
The role of insulin resistance and secretion in type 2 diabetes ..............................................7
Intestinal microbiota and the impact on host metabolism .....................................................13
Lactobacillus reuteri .............................................................................................................17
Hypothesis ......................................................................................................................... 20
Specific aims ........................................................................................................................20
Material and Methods .........................................................................................................23
Study design.........................................................................................................................23
Study participants .................................................................................................................24
Anthropometric parameters ..................................................................................................25
Intestinal permeability in vivo ...............................................................................................25
Gastric emptying ..................................................................................................................26
Analysis of the faecal content ...............................................................................................27
Oral glucose tolerance test (OGTT) .....................................................................................29
Assessment of insulin secretion and β-cell function .............................................................30
Isoglycemic glucose infusion test .........................................................................................30
Hyperinsulinemic-euglycemic clamp with isotopic dilution to assess insulin sensitivity .......32
Gas chromatography-mass spectrometry to determine atom percent enrichment of
[6,62H2] glucose ....................................................................................................................33
Indirect calorimetry ...............................................................................................................34
Biochemical analysis ............................................................................................................35
Incretin concentrations .........................................................................................................36
Reactive oxygen species (ROS) ..........................................................................................38
Immune mediators and adipokines ......................................................................................38
Limulus test to measure LPS ...............................................................................................39
1
H MRS for the determination of hepatic and muscular fat content ......................................39
Lactobacillus reuteri capsules and placebo capsules ..........................................................40
Statistical data analysis and power calculation ....................................................................40
Results
.............................................................................................................................42
Recruitment and enrollment of study subjects .....................................................................42
Baseline characteristics of study cohort ...............................................................................44
1
Abundance of bacterial populations in faecal samples ........................................................44
Anthropometry ......................................................................................................................45
Ectopic lipid content .............................................................................................................47
Tissue-specific whole body and hepatic insulin sensitivity ...................................................47
Energy expenditure and substrate oxidation ........................................................................48
Glucose tolerance ................................................................................................................49
Insulin secretion and incretin effect ......................................................................................51
Incretin secretion ..................................................................................................................55
Systemic Inflammation .........................................................................................................58
Circulating endotoxin levels ..................................................................................................58
Circulating adipokine concentrations ....................................................................................60
Concentrations of free fatty acids and triglycerides ..............................................................63
Discussion ......................................................................................................................... 64
Good treatment adherence throughout the study and safety of the probiotic strain L.
reuteri
.............................................................................................................................64
Ingestion of the probiotic strain L. reuteri modulates plasma gut peptides ..........................65
Administration of L. reuteri increases glucose-stimulated release of insulin and C-peptide.66
Ingestion of L. reuteri might accelerate intestinal motility .....................................................67
Administration of L. reuteri had no impact on glucagon concentrations ...............................67
Effects of probiotic L. reuteri treatment on blood glucose concentrations ............................68
FFA levels seem unaffected by L. reuteri administration .....................................................68
L. reuteri administration does not alter systemic and hepatic insulin sensitivity ...................69
Impact of L. reuteri on fatty liver disease ..............................................................................70
Intervention resulted in preserved concentrations of systemic inflammatory markers,
oxidative stress and endotoxin .............................................................................................71
Effects of L. reuteri on intestinal permeability .......................................................................72
Effects of probiotic modulation of gut microbiota on adipokines ..........................................73
L. reuteri administration is associated with constant body weight and resting energy
expenditure...........................................................................................................................73
Strengths and limitations of the study ..................................................................................74
Conclusion ......................................................................................................................... 75
Outlook ............................................................................................................................... 76
References ......................................................................................................................... 77
Acknowledgements ........................................................................................................... 98
2
Abbreviations
APE
atom percent enrichment
AUC
area under curve
BMI
body mass index
CFU
colony forming unit
CRP
C-reactive protein
DAG
diacylglycerol
DI
disposition index
DDZ
german diabetes center
DPP4
dipeptidyl peptidase 4
EDTA
ethylendiamintetraacetat
FFA
free fatty acids
GC-MC
GLP-1
gas chromatography-mass spectrometry
gastric inhibitory polypeptide or glucose-dependent insulinotropic
peptide
glucagon-like peptide-1
GLP-2
glucagon-like peptide-2
GOT
glutamic oxaloacetic transaminase
GPR
G-protein-coupled receptor
GPT
glutamic pyruvate transaminase
HCL
hepatocellular lipids
hsCRP
high-sensitive C-reactive protein
IcCE
individual calibration control evaluation
IFG
impaired fasting glucose
IGT
impaired glucose tolerance
IGF-1
insulin-like growth factor-1
IMCL
intramyocellular lipids
IQR
interquartile range
IRS-1 /-2
insulin-receptor substrate
ISR
insulin secretion
i.v.
intra venous
ivGTT
intra venous glucose tolerance test
LAL
limulus amebocyte lysate
LBP
lipopolysaccharide-binding protein
LCFA
long-chain fatty acids
LPS
lipopolysaccharide
MRI
magnetic resonance imaging
GIP
3
MRS
magnetic resonance spectroscopy
NAFLD
non-alcoholic fatty liver disease
NGT
normal-glucose tolerance
OGIS
oral glucose sensitivity index
OGTT
oral glucose tolerance test
PCR
polymerase chain reaction
PI3K
phosphatidylinositol 3-kinase
PKC
protein kinases C
REE
resting energy expenditure
ROS
reactive oxygen species
RQ
respiratory quotient
RT
room temperature
SCFA
short-chain fatty acid
SD
standard deviation
SEM
standard error of the mean
TG
triglycerides
TLR
toll-like receptor
T2D
type 2 Diabetes
VCO2
carbon dioxide production
VO2
oxygen consumption
4
Figures
Fig. 1
The current paradigm of the development of type 2 diabetes ....................................9
Fig. 2
Schematic presentation of proglucagon-processing ................................................12
Fig. 3
Lactobacillus reuteri .................................................................................................18
Fig. 4
Schematic overview of the probiotic effects .............................................................22
Fig. 5
Overview of the study design and frequency of visits. .............................................23
Fig. 6
Gastric emptying rate ...............................................................................................27
Fig. 7
Schematic representation of the oral glucose tolerance test (OGTT). .....................29
Fig. 8
The biological incretin effect determined by the isoglycemic clamp technique ........31
Fig. 9
Schematic representation of the time course of the clamp studies ..........................33
Fig. 10 Correlation of the GLP-1 concentrations detected by two different methods ...........37
Fig. 11 Enrollment and allocation of participants according CONSORT flow diagram .........42
Fig. 12 Abundance of bacterial populations in faecal samples ............................................44
Fig. 13 Ectopic lipid content in L. reuteri and placebo treated subjects ...............................46
Fig. 14 Results from the hyperinsulinemic-euglycemic clamp ..............................................48
Fig. 15 Lipid oxidation and glucose utilization before and after intervention ........................49
Fig. 16 Blood glucose concentrations during OGTT and isoglycemic i.v. glucose infusion .50
Fig. 17 Concentrations of insulin, C-peptide and glucagon during OGTT ............................52
Fig. 18 ΔAUC of Insulin, C-peptide and glucagon ................................................................53
Fig. 19 Gut peptides secretion during OGTT .......................................................................56
Fig. 20 ΔAUC of glucagon like peptides and glucose-dependent insulinotropic peptide .....57
Fig. 21 Fasting hsCRP concentrations .................................................................................59
Fig. 22 Fasting endotoxin concentrations.............................................................................59
Fig. 23 Fasting leptin concentrations....................................................................................61
Fig. 24 Fasting adiponectin concentrations ..........................................................................61
Fig. 25 Free fatty acids (FFA) and triglycerides (TG) during OGTT .....................................63
Fig. 26 Schematic overview of the probiotic effects .............................................................64
5
Tables
Table 1
Metabolic effects of probiotic strains administered to different animal models .. 16
Table 2
Primer and Probes ............................................................................................. 28
Table 3
Blood sampling protocol of OGTT ..................................................................... 35
Table 4
Baseline characteristics of study cohort ............................................................ 43
Table 5
Anthropometric data before and after intervention in the respective groups. .... 45
Table 6
Changes of indices of β-cell function upon intervention .................................... 54
Table 7
Systemic inflammatory mediators ...................................................................... 62
6
Introduction
The role of insulin resistance and secretion in type 2 diabetes
In 2010 about 285 million people were suffering from diabetes and this number is
expected to increase to more than 550 million by the year 2030 (IDF, 2011; Shaw et al.,
2010; Nolan et al., 2011). Type 2 diabetes (T2D), formerly known as non-insulin
dependent diabetes mellitus (NIDDM), is the most prevalent form and accounts for about
90% of diabetes cases (ADA, 2010). The prevalence of T2D is assumed to increase due
to population growth, aging and urbanization. It is expected that diabetes incidence, which
already reached epidemic dimensions, will continue to increase (Chan et al., 2009; Roglic
et al., 2005; Wild et al., 2004).
T2D results from decreased insulin sensitivity in combination with insufficient insulin
secretion. When individuals are insulin-resistant and have lost approximately 65% of their
β-cell function, T2D becomes overt (Meier et al., 2012; Abdul-Ghani et al., 2006a; AbdulGhani et al., 2010; Abdul-Ghani et al., 2006b; Ferrannini et al., 2005; Defronzo, 2009;
Defronzo, 2004) (figure 1). Moreover, T2D is associated with reduced incretin
concentrations as well as incretin effects (Toft-Nielsen et al., 2001; Vilsboll et al., 2001;
Meier et al., 2001; Nauck et al., 1986), resulting in an impaired insulin secretion in
response to glucose. In particular, the first-phase of insulin secretion (ISR) is diminished in
T2D, indicating the important role of incretins as amplifiers of first-phase ISR (Woerle et
al., 2012).
The recent increase in the global incidence of T2D, which is observed in Western
countries and developing nations, suggests that most cases of this disease are caused by
changes in environmental factors. Major risk factors for T2D such as overnutrition and low
dietary fibre involve the gut and have been found to be associated with increased insulin
resistance, decreased glucose tolerance and local or systemic low-grade inflammation
(Kolb and Mandrup-Poulsen, 2010). Obesity has also been shown to associate with
altered gut microbiota (Ley et al., 2005; Turnbaugh et al., 2006) which differs in patients
with T2D compared to non-diabetic subjects (Larsen et al., 2010). In a metagenome-wide
association study of gut microbiota it has be shown that patients with type 2 diabetes were
characterized by a moderate degree of gut microbial dysbiosis, accompanied by
increased abundance of opportunistic pathogenic bacteria (Qin et al., 2012).
Peripheral and hepatic insulin resistance
Insulin resistance is described as the fundamental failure to respond appropriately to
insulin. Insulin resistance mainly affects the target tissues of insulin, particularly skeletal
7
muscle and liver, but also adipose tissue and brain (Szendroedi et al., 2012; Szendroedi
et al., 2011; Bonnet et al., 2011; Harford et al., 2011; Ruan and Lodish, 2003; Ferrannini
et al., 2005; Abdul-Ghani et al., 2006b; Banks et al., 2012).
Currently, it is under debate whether the peripheral (muscle) or the hepatic insulin
resistance occurs first. Skeletal muscle is mainly responsible for whole-body insulin
resistance, in terms of dysfunction of cellular mechanism to respond appropriately to
insulin. Skeletal muscle insulin resistance and the resulting reduction of peripheral
glucose uptake seems to develop early, as shown by studies in young lean individuals
with muscle-specific insulin resistance (Petersen et al., 2007). As a consequence, glucose
is redirected to the liver, which increases de-novo-lipogenesis with consecutive
impairment of hepatic energy metabolism (Samuel and Shulman, 2012; Szendroedi et al.,
2011; Defronzo and Tripathy, 2009).
However, it has also been suggested that hepatic insulin resistance is the primary event
initiating to the development of diabetes. Previously, it has been revealed that disruption
of hepatic insulin signaling results in fasting and postprandial hyperglycemia and the
subsequent development of peripheral insulin resistance (Michael et al., 2000; Takamura
et al., 2012).
Metabolic and environmental factors affecting insulin resistance
The link between elevated lipid levels and insulin resistance is widely accepted. Increased
availability of free fatty acids (FFA) and subsequent ectopic intracellular lipid accumulation
may trigger the development of insulin resistance. Particularly, an increased intracellular
lipid contents in skeletal muscle and liver has been related to insulin resistance (Krssak et
al., 1999; Szendroedi and Roden, 2009) (figure 1). It was postulated that, in muscle and
liver, the intracellular accumulation of lipids and diacylglycerol (DAG) triggers the
activation of novel protein kinases Cs (PKCs) with subsequent impairment of insulin
signalling. For example, insulin-receptor substrate (IRS) 1-associated phosphatidylinositol
3-kinase (PI3K) activity is reduced in the muscles of individuals after a lipid infusion. In
addition, in these individuals the insulin action in the liver, which has some similarities with
the insulin action in muscle, is associated with defects in insulin signalling in the state of
hepatic steatosis. Increased liver lipid content further impairs the ability of insulin to
regulate gluconeogenesis and activate glycogen synthesis (Samuel et al., 2010; Samuel
and Shulman, 2012).
8
Several other aspects including genetic factors, have been described to contribute to
alterations of insulin resisitance, (Meigs et al., 2000; Pierce et al., 1995; Kaprio et al.,
1992; Poulsen et al., 1999; Pratley, 1998; Herder and Roden, 2011; Sladek et al., 2007;
Hemminki et al., 2010; Poulsen et al., 2009; Tattersal and Fajans, 1975). It has been
demonstrated that first degree relatives of type 2 diabetic subjects have a higher risk to
develop insulin resistance and subsequent type 2 diabetes (Axelsen et al., 1999; Groop et
al., 1996; Stumvoll et al., 2005; Pratipanawatr et al., 2001)
Fig. 1 The current paradigm of the development of type 2 diabetes
Type 2 diabetes (T2D) is a severe metabolic disorder characterized by a combination of insulin
resistance and impaired insulin secretion. The development of T2D involves genetic,
environmental, and lifestyle factors. Insulin resistance occurs in different tissues, mainly in muscle
and liver and is detectable long before the onset of T2D. Temporarily, insulin resistance can be
compensated by increased insulin secretion. When β-cells can no longer compensate for the
insulin resistance a hyperinsulinemic state develops and T2D becomes manifest. Normal glucose
tolerance (NGT), impaired glucose tolerance (IGT), impaired fasting glucose (IFG). For further
details see main text. Adapted from (Kendall et al., 2009).
Adiposity, inflammation, and lifestyle factors including dietary habits and physical activity
also contribute to the development of insulin resistance and subsequently to type 2
diabetes.
9
Adiposity contributes to T2D development in two aspects. On one hand insulin resistance
of adipose tissue insulin resistance and elevated lipolysis increase levels of circulating
FFA and thereby contribute to the development of insulin resistance as described above
(Kashyap and Defronzo, 2007; Szendroedi and Roden, 2009). On the other hand, adipose
tissue is an endocrine organ which secretes hormones such as adiponectin and leptin as
well as cytokines and chemokines (Rosen and Spiegelman, 2006; Fantuzzi, 2005; Wellen
and Hotamisligil, 2005; Samaras et al., 2010; Guilherme et al., 2008) contributing to the
subclinical inflammation, associated with the development of T2D (Spranger et al., 2003;
Herder et al., 2005b; Herder et al., 2009a; Carstensen et al., 2010; Meier et al., 2002;
Pradhan et al., 2001).
Dietary habits of the western lifestyle, such as consumption of fast food, are associated
with insulin resistance (Pereira et al., 2005). In addition, high-fat diet (Badin et al., 2013;
Atkinson et al., 2013; Lottenberg et al., 2012) and reduced consumption of dietary fiber,
especially cereals and / or carbohydrates with low glycaemic index are associated with
insulin resistance (Breneman and Tucker, 2012; Brockman et al., 2012; Cloetens et al.,
2012; Pal and Radavelli-Bagatini, 2012; Parnell and Reimer, 2012; Roelofsen et al., 2010;
Robertson et al., 2003; Pereira et al., 2002; Weickert et al., 2006a). The consumption of
dietary fiber has been suspected beneficial in several aspects. It can increase the
production of short-chain fatty acids (SCFA) in the colon by increased bacterial
fermentation of indigestible dietary fibers which in turn may improve lipid homeostasis and
reduce hepatic glucose output (Galisteo et al., 2008). These metabolic alterations are
mediated by the secretion of gastrointestinal hormones like ghrelin, peptide YY (PYY),
and glucose-dependent insulinotropic peptide (GIP) with subsequent alteration of satiety
(Weickert et al., 2006b; Heini et al., 1998; Weickert et al., 2005; Robertson et al., 2003;
Schenk et al., 2003; Qi et al., 2005). Hence, the mechanisms through which these
different diets promote the progression to insulin resistance and consecutively towards a
pre-diabetic state involve a complex physiology of glucose homeostasis (Thomas and
Pfeiffer, 2012).
Physical activity also seems to have a strong impact on glucose homeostasis. As
mentioned above, there is an association of altered skeletal muscle mitochondrial function
and changes in hepatic glucose and lipid metabolism subsequent to altered insulin
sensitivity. Several studies described that physical activity protects from insulin resistance
and T2D, by reversing the negative effects of insulin resistance on skeletal muscle and
liver (Rabol et al., 2011; Phielix et al., 2012; Phielix et al., 2011; Boushel et al., 2007;
Mogensen et al., 2007; Kelley et al., 2002; Dela et al., 1995; Manson et al., 1991; King et
al., 1987).
10
Clinical manifestation of insulin resistance
Insulin resistance is detectable several years before the diagnosis of diabetes and is
initially compensated by increased insulin secretion (Tabak et al., 2009; Ferrannini et al.,
2005). T2D manifests when high insulin demand resulting from insulin resistance is no
longer compensated by the β-cells (Ferrannini, 2009) (figure 1). As demonstrated by the
Whitehall II study, insulin sensitivity is decreased up to 87% during the five years period
before diabetes diagnosis. The fasting and the 2h postprandial glucose level increased
linearly three years before T2D manifestation, and the β-cell function, determined by
HOMA, showed first pathological increases three to four years before diabetes
manifestation, followed by a decrease up to 63% until diagnosis (Tabak et al., 2009).
Additionally, insulin resistance can also be observed in individuals with normal-glucose
tolerance (NGT), in first degree relatives of subjects with type 2 diabetes, and in
individuals with impaired fasting glucose (IGT) (Abdul-Ghani et al., 2006b; Weyer et al.,
2001; Lillioja et al., 1988; Saad et al., 1988) and predicts the development of glucose
intolerance and T2D (Weyer et al., 2001; Abdul-Ghani and Defronzo, 2009).
Insulin secretion and β-cell function as contribuiting factors in the development of type 2
diabetes
The β-cells of the islet of Langerhans in the pancreas secrete insulin dependent on actual
blood glucose concentrations. In insulin-resistant states, β-cells produce increased
amounts of insulin to counteract resistance to the hormone in peripheral tissues (figure
1). When β-cells can no longer compensate the insulin resistance by an hyperinsulinemic
state, hyperglycemia occurs and T2D becomes clinically manifest (Festa et al., 2006;
Abdul-Ghani and Defronzo, 2009; Abdul-Ghani et al., 2006a; Abdul-Ghani et al., 2006b;
Kahn et al., 1989; Kahn et al., 1993).
In an animal model this concept has been confirmed, demonstrating that knockout of the
peripheral muscle insulin receptor did not induce a diabetic phenotype (Lauro et al.,
1998), indicating that up-regulation of β-cell activity compensates for insulin resistance
and may engender normal fasting glucose levels by hyperinsulinemia. In contrast, it has
been shown, that a β-cell defect in the presence of insulin resistance results in a diabetic
phenotype (Bergman, 1989; Bruning et al., 1997).
Furthermore, the development of β-cell dysfunction is associated with the consumption of
high fat diet, which may be accompanied with higher levels of endogenous FFA. FFA, in
particular saturated FFA, are potentially lipotoxic to pancreatic β-cells, promote apoptosis
11
(Unger, 2002) and have an impact of cytokine secretion of blood cells (Simon et al.,
2013).
The gastrointestinal hormones and the incretin effect
Oral glucose administration induces a much greater degree of insulin secretion compared
to a parenteral isoglycemic intravenous glucose infusion, suggesting that gastrointestinal
hormones, the incretins play an important role (MCINTYRE et al., 1964; MCINTYRE et al.,
1965). Gastrointestinal hormones like glucose-dependent insulinotropic polypeptide (GIP)
and glucagon-like peptide-1 (GLP-1) are essentially involved in the regulation of gastric
acid secretion and gut motility, release of pancreatic enzymes, and nutrient absorption.
The incretin GLP-1, support the disposal of glucose through the stimulation of insulin
secretion from the pancreas. This incretin effect is of relevance in the glucose metabolism
and applied in the treatment of T2D (Drucker, 2006; Drucker and Nauck, 2006; Nauck et
al., 2004; ELRICK et al., 1964) since it has been described that the overall incretin effect
in T2D with deteriorated glycaemic control is reduced (Nauck et al., 1986; Nauck et al.,
1993; Calanna et al., 2013).
Fig. 2 Schematic presentation of proglucagon-processing
Modified from (Rowland and Brubaker, 2008): Synthesis of the 160 amino acid precursor
protein by the intestinal L-cell. The hormone Glucagon is part of the sequence but is not
liberated in his active form from the intestinal L-cell.
12
GIP is synthesized from the enteroendocrine K cells, has insulinotropic effects and only
slight effects on the gastric acid secretion (Dupre et al., 1973). It was the first identified
incretin, followed by GLP-1.
GLP-1 and GLP-2 are co-secreted after food intake from intestinal L-cells (figure 2) and
are rapidly degraded by dipeptidyl-peptidase (DPP)-4. The incretin release is
interdependent on gastric emptying and blood glucose (Samsom et al., 2009; Drucker,
2006). Defects of the incretin system in patients with T2D have been tackled by medical
treatment with incretin analogues or mimetics as well as treatment with DPP-4 inhibitors,
all of which improve glucose metabolism. GLP-1 improves insulin secretion, inhibits
glucagon action, has effects on central-nervous-system, and inhibits gastric emptying
(Drucker and Nauck, 2006; Drucker, 2002).
GLP-2, an intestinotrophic peptide, enhances intestinal epithelial barrier function by
affecting both para-cellular and trans-cellular pathways. GLP-2 treatment has been shown
to increase intestinal weight and mucosal thickness, surface area and cryptic architecture
in animals and humans (Rowland and Brubaker, 2008; Jeppesen et al., 2005).
Furthermore, chronic administration of GLP-2 also affects intestinal functions towards an
increase in nutrient digestion and absorption as well as in barrier function in normal mice
(Benjamin et al., 2000; Brubaker et al., 1997; Cheeseman, 1997; Kato et al., 1999;
Drucker, 2002). It has been proposed to treat patients with chronic bowel disease with
GLP-2 in a clinical setup, as it has been shown to reduce inflammation and enhance
mucosal integrity in several injury models in rodents. However, as GLP-2 affects cell
proliferation and differentiation through insulin-like growth factor (IGF)-1 related pathways.
Therefore, it was proposed to closely monitor patients with known neoplasms during
treatment with DPP-4 inhibitors, since it has been described that DPP-4 degraded both
peptides, GLP-1 and GLP-2 (Rowland and Brubaker, 2008; Masur et al., 2006).
Intestinal microbiota and the impact on host metabolism
Numerous animal studies point to a link between intestinal microbiota, intestinal
permeability, and chronic inflammation (Sommer and Backhed, 2013; Tremaroli and
Backhed, 2012). Furthermore mainly in mouse models it has been supposed that
intestinal microbiota are involved in the regulation of metabolic parameters (Musso et al.,
2010; Lye et al., 2009; Cani and Delzenne, 2009b; Cani et al., 2009b) including insulin
resistance (Genta et al., 2009), postprandial glucose response (Cani et al., 2009a),
lllllllllllllllllllllllllllllllllllllllllllllllllllllllllllllllllllllllllllllllllllllllllllllllllllllllllllllllllllllllllllllllllllllllllllllllllllllllllllllllllllllllllllllllllll
llllllllllllllllllllllllllllllllllllllllllllllllllllllllllllllllllllllllllllllllllllllllllllllllllllllllllllllllllllllllllllllllllllllllllllllllllllllllllllllllllllll
13
obesity (Parnell and Reimer, 2009) and type 2 diabetes (Qin et al., 2012). However, the
majority of these studies were performed in animal models, while data from human
studies are rare.
Gut microbiota and gut hormones (incretins)
Recently, in rodents it has been demonstrated that the alteration of gut microbiota
composition affects the intestinotrophic gut hormone glucagon-like peptide (GLP)-2 (Cani
et al., 2009b) as well as the insulinotropic GLP-1, GIP and PYY (Cani et al., 2009a).
Cani et al. showed that mice treated with prebiotics leads to have increased GLP-2 levels
resulting in reduced gut permeability, supposed to increased expression of the tight
junction proteins like occludin and zona occludens-1 (Cani et al., 2009b; Moran et al.,
2012). The increased GLP-2 release was likely mediated by changes of FFA levels in the
gut, in particular the SCFA butyrate (Bartholome et al., 2004; Tappenden et al., 2003),
which is one of the SCFA produced during the fermentation of the prebiotics by the gut
microbiota (Roberfroid et al., 2010; Ramnani et al., 2012).
Gut microbiota and systemic inflammation
Another mechanism how defined modulation of the gut microbiota may prevent metabolic
diseases could be by reducing the translocation and systemic concentrations of the
endotoxin Lipopolysaccharide (LPS), leading to an altered inflammatory status. It is well
established that elevated levels of LPS, a component of the outer cell wall of gramnegative bacteria, in the peripheral blood are associated with low-grade inflammation
(Caradonna et al., 2000; Cani et al., 2012; Cani and Delzenne, 2009c; Andreasen et al.,
2010b). LPS is a dominant exogenous Toll-like receptor (TLR-)4 ligand, which activates
the innate immune system (Medzhitov, 2007; Medzhitov, 2001). In an animal study by
Cani et al., decreased intestinal permeability modulated by prebiotic treatment correlated
with lower portal plasma LPS concentrations known to trigger inflammation and oxidative
stress (figure 4). In these mice improved systemic and hepatic inflammation was shown
(Cani et al., 2009b).
Since both, cytokines and oxidative stress have been shown to be potentially harmful to
insulin-producing β-cells, this could be an additional effect. Low-grade inflammation and
differentially regulated cytokines have been reported in human subjects with diabetes to
associate
with
insulin
resistance,
decreased
β-cell
function,
impaired
glucose
homeostasis, prediabetes, diabetes and obesity (Herder et al., 2009b; Herder et al.,
2009a; Pfleger et al., 2008a; Herder et al., 2007b; Herder et al., 2007a; Herder et al.,
14
2005a; Schloot et al., 2007; Kempf et al., 2007). In mice an additional role of leptin, an
adipokine secreted from the white adipose tissue (Xie et al., 2008), mainly involved in
energy metabolism (Mantzoros et al., 2011) has been described to alter the intestinal
translocation of bacteria by modulating the bacterial adherence to the intestinal mucosa
(Amar et al., 2011). Those observations, mainly from animal studys, indicate that the gut
microbiota is in important factor to contribute to systemic inflammation and may contribute
to changes in insulin sensitivity, possibly also in humans.
Metabolic effects of modulated microbiota
In animal studies altered gut microbiota has been associated by diseases like obesity and
diabetes and is influenced by weight alterations and dietary intervention (Cani and
Delzenne, 2009a; Cani et al., 2008b). Ingestion of probiotics in animal experiments and in
only few human clinical trials has been shown to influence gut microbiota composition
(Ley et al., 2005; Turnbaugh et al., 2006), intestinal permeability, blood glucose, HbA1c,
triglyceride and LDL-cholesterol levels (Cani et al., 2007b; Yadav et al., 2007; Hlivak et
al., 2005), and blood pressure (Sipola et al., 2002; Seppo et al., 2003) (table 1).
However, in human subjects, the link between alterations of the gut microbiota by
ingestion of probiotics and factors associated with diabetes or obesity such as insulin
resistance, β-cell activity, low grade inflammation and altered incretin hormones is less
well understood.
At present, it is poorly investigated whether probiotic treatment leads to an alteration of
ectopic fat distribution which is defined by the deposition of triglycerides within cells of
non-adipose tissue that normally contain only small amounts of fat (Lettner and Roden,
2008) focusing particularly on the intracellular lipid contents in skeletal muscle and liver,
which are directly related to insulin resistance (Szendroedi and Roden, 2009).
Recently, a preliminary study with ten healthy human subjects has shown that the intake
of prebiotics over a period of two weeks lead to increased plasma GLP-1 and Peptide YY
concentrations as well as decreased post prandial glucose concentrations in humans
(Cani et al., 2009a). To date only one other human study addressed whether the alteration
of gut microbiota by ingestion of probiotics can influence glucose homeostasis and insulin
sensitivity, but whether a beneficial effect of probiotics on glucose metabolism in humans
indeed is related to improved gut integrity (via GLP-2) and to an amelioration of chronic
systemic inflammation is unknown.
15
Table 1 Metabolic effects of probiotic strains administered to different animal models
Probiotic strain /
combinations
Result of intervention
Animal model
Reference
L. casei
inhibited occurrence of diabetes
modified immune response
NOD mice
(Matsuzaki et
al., 1997b)
L.casei
plasma glucose
modified immune response
NIDDM-KK-Ay mice
(Matsuzaki et
al., 1997c)
L.casei
incidence of diabetes
insulin secreting β-cells
AXN-induced BALB/c
mice
(Matsuzaki et
al., 1997a)
L. rhamnosus GG
HbA1c and oxidative stress
glucose tolerance
insulin secretion
STZ-induced diabetic
rats
(Tabuchi et al.,
2003)
L. reuteri GMNL263
HbA1c
blood glucose
STZ-induced diabetic
rats
(Lu et al., 2010)
L. plantarum DSM
15313
blood glucose
HFD C57BL/6J mice
(Andersson et
al., 2010)
B. longum BIF
CGMCC no. 2107
endotoxin
intestinal inflammation
intestinal growth factor
HFD rats
(Chen et al.,
2011)
B. animalis subsp.
lactis 420
inflammatory status
metabolic status
bacterial translocation
HFD vs. chaw diet
(Amar et al.,
C57bl6 ob/ob knock-out
2011)
mice
L. acidophilus
NCDC14,
L. casei NCDC19
diabetic dyslipidemia
lipid peroxidation
STZ-induced diabetic
rats
(Yadav et al.,
2008)
L. acidophilus
NCDC14,
L. casei NCDC19
HbA1c and blood glucose
free fatty acids
triglycerides
Fructose-induced
diabetic rats
(Yadav et al.,
2007)
L. acidophilus,
L. rhamnosus
B. lactis,
impoved blood glucose due to
altered gliclazide transport
across ileal tissue
AXN-induced diabetic
rats
(Al-Salami et
al., 2008)
VSL#3
β-cell destruction and insulitis
IL-10
NOD mice
(Calcinaro et
al., 2005)
VSL#3
insulin resistance
hepatic steatosis
inflammation
HFD C57BBL-6 mice
(Ma et al.,
2008)
Different Lactobacilli (L.) and Bifidobacteria (B) species and their metabolic effects. Streptozotocin
(STZ), Alloxan (AXN), non-obese diabetic (NOD) mice, non-insulin-dependent diabetes mellitus
(NIDDM) model, high fat diet (HFD), means improved / increased, means reduced /
decreased. VSL#3 is patented probiotic mixture, containing Bifidobacterium breve, Bifidobacterium
longum, Bifidobacterium infantis, Lactobacillus acidophilus, Lactobacillus plantarum, Lactobacillus
paracasei, Lactobacillus bulgaricus and Streptococcus thermophilus.
16
A recent study by Vrieze et al. investigated the effects of allogenic fecal transplantation of
lean donors on insulin sensitivity to subjects (n=18) with newly diagnosed metabolic
syndrome (Vrieze et al., 2012). The fecal infusion from lean donors improved insulin
resistance as well as fasting lipid levels in obese individuals with metabolic syndrome.
These results underscore the potential role of gut microbiota on glucose and lipid
metabolism (Vrieze et al., 2012). Interestingly, donor-feces infusion has recently been
shown to result in 81% (13 of 16 patients) in resolution of Clostridium difficile associated
diarrhoe whereas antibiotic therapy with vancomycin results only in 31% (4 of 13 patients)
in resolution (Van et al., 2013). This suggests that donor-feces infusion might be used as
a potential therapeutic strategy against recurrent C. difficile infection, which is difficult to
treat, even with antibiotics (Van et al., 2013). Besides transferring the complex community
of microorganisms, with poor knowledge of the composition and diversity, the ingestion of
probiotics might be an alternative (Gerritsen et al., 2011).
A study with a heterogenous group of participants of 54 males with T2D or with impaired
or normal glucose tolerance who received L. acidophilus NCFM for 4 weeks showed
preserved insulin sensitivity compared to the placebo group, but no effect on the systemic
inflammatory response (Andreasen et al., 2010a). There was considerable variability
among study participants and it was not reported whether those with improved insulin
sensitivity were diabetic or normoglycemic.
Recently, Ejtahed et al. showed that the consumption of a probiotic yogurt containing L.
acidophilus La5 and Bifidobacterium lactis Bb12 over six weeks improved enzymatic
antioxidant status, fasting blood glucose level and the HbA1c in patients with type 2
diabetis compared to the control group which consumed conventional yogurt (Ejtahed et
al., 2012). The absence of a control group that consumed no yogurt, even in regard to the
described biological activities of milk proteins (Korhonen and Pihlanto, 2006) could limit
the generalizability of these results (Ejtahed et al., 2012).
Lactobacillus reuteri
Probiotic treatment with Lactobacilli and Bifidiobacteria are supposed to benefit of the host
metabolism in different ways, involving preventative and therapeutic aspects (table 1).
Probiotics such as Lactobacillus (L.) reuteri has been shown to improve diseases such as
infant colic (Savino et al., 2007; Indrio et al., 2008), IgE-associated eczema
(Abrahamsson et al., 2007; Bottcher et al., 2008) and diarrhea (Shornikova et al., 1997b;
Shornikova et al., 1997a; Weizman et al., 2005). In animal models L. reuteri reduced
17
intestinal inflammation (Liu et al., 2010) and seemed to have an impact on immune
reactivity measured in vitro (Livingston et al., 2010; Hoffmann et al., 2008).
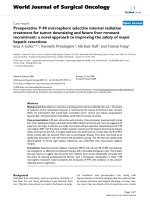
Fig. 3 Lactobacillus reuteri
Colored in blue after a gram stain (100x)
(private source, foto made at the Institute for Medical Microbiology
and Hospital Hygiene, Heinrich-Heine-University Düsseldorf,
Germany 2012, M.C. Simon)
Lactobacillus reuteri is a gram-positive bacterium (figure 3), which also naturally inhabits
the gut of mammals, and is used by the food industry to prepare probiotic nutrients. L.
reuteri has been tested for host tolerance in children (Ruiz-Palacios et al., 1992), healthy
adults (Wolf et al., 1995), and immunosuppressed patients with HIV (Wolf et al., 1998).
One of the best documented effects of L. reuteri is the treatment of rotavirus-induced
diarrhea. Treatment of rotaviral diarrhea by consumption of L. reuteri significantly shortens
the duration of the illness compared to placebo treatment in young children between 6 and
36 months of age receiving up to 1011 colony-forming units (CFU). This effect was dosedependent: the more L. reuteri is consumed, the faster the diarrhea stops (Shornikova et
al., 1997a; Shornikova et al., 1997b).
Furthermore, L. reuteri is found in breast milk (Sinkiewicz and Nordström, 2005), and oral
intake of the mother likewise increases the amount of L. reuteri present in her milk, and
thus the likelihood that it will be transferred to the child (Abrahamsson et al., 2005). L.
reuteri benefits its host in a variety of ways, particularly by modulating the immune system
and has been shown to be safe in application, even in neonates at dosages up to 1010
18
CFU per day. L. reuteri has a well-studied safety and a strong probiotic activity, when
compared with 46 other strains of Lactobacillus spp. (Jacobsen et al., 1999).
Overall, gut microbiota consisting of complex communities of microorganisms that
colonise the intestine seem to have an major impact on health and disease (Gerritsen et
al., 2011) and as recently shown in a metagenome-wide association study, patients with
T2D are characterized by a moderate but statistically highly significant degree of gut
microbial dysbiosis (Qin et al., 2012).
So far, the above mentioned studies demonstrate that alteration of intestinal microbiota
may affect the host’s metabolic status. However most of the studies investigating the
effects of prebiotic or probiotic alterd microbiota were performed in animal models. To
understand the potential impact of probiotic bacterial strains on the composition of the
human gut microbiota and on the host’s metabolic and immunological status, further
carefully controlled studies in humans are required.
19
Hypothesis
The goal of the study was to test the hypothesis that L. reuteri-enriched microbiota
improve insulin sensitivity and insulin secretion in lean and obese glucose tolerant
subjects by improving GLP-2 and / or GLP-1 linked insulinotropic effects.
Specific aims
The specific aims were therefore:
To investigate the effects of L. reuteri-enriched gut microbiota in a prospective, doubleblind, placebo-controlled randomized trial over 8 weeks in human subjects on
I.
insulin sensitivity and β-cell function
II.
incretin concentrations
III. inflammatory status and reactive oxygen species
IV. ectopic fat distribution
20