Mitigating voltage sags by optimal placement of series compensation devices using genetic algorithm
Bạn đang xem bản rút gọn của tài liệu. Xem và tải ngay bản đầy đủ của tài liệu tại đây (3.44 MB, 159 trang )
MITIGATING VOLTAGE SAGS BY OPTIMAL
PLACEMENT OF SERIES COMPENSATION DEVICES
USING GENETIC ALGORITHM
YU ZHEMIN
NATIONAL UNIVERSITY OF SINGAPORE
2003
MITIGATING VOLTAGE SAGS BY OPTIMAL
PLACEMENT OF SERIES COMPENSATION DEVICES
USING GENETIC ALGORITHM
YU ZHEMIN
A THESIS SUBMITTED FOR
THE DEGREE OF MASTER OF ENGINEERING
DEPARTMENT OF ELECTRICAL AND COMPUTER ENGINEERING
NATIONAL UNIVERSITY OF SINGAPORE
2003
ACKNOWLEDGMENTS
The author takes this opportunity to place on record his sincere thanks and gratitude
towards his supervisor Associate Professor C. S. Chang, Department of Electrical and
Computer Engineering, National University of Singapore for his valuable suggestions,
continuous encouragements, timely advice and skilful guidance throughout the
research work and writing of the thesis.
The author would also like to thank his wonderful family, for their many years of
support and encouragement that prepared for his Master’s degree. Not forgetting his
dearest wife for her patience and constant support.
Also thankful to Mr. H. C. Seow, Senior Laboratory Technologist, Department of
Electrical and Computer Engineering, NUS for his timely assistance regarding
computer problems. Finally, special appreciations to his colleagues in the Power
System Laboratory, and all others who have helped in way or other during the entire
period of the research work.
i
TABLE OF CONTENTS
ACKNOWLEDGMENTS ............................................................................................. i
TABLE OF CONTENTS ............................................................................................. ii
LIST OF FIGURES .................................................................................................... vii
LIST OF TABLES ........................................................................................................ x
LIST OF PUBLICACTIONS..................................................................................... xii
ABSTRACT
..........................................................................................................xiii
CHAPTER 1
INTRODUCTION..........................................................................1-1
1.1
BACKGROUND OF THE RESEARCH.....................................................1-1
1.1.1
1.1.2
1.1.3
1.1.4
Power Quality Phenomena...................................................1-1
Definition of Voltage Sag ....................................................1-2
The Necessity of Mitigating Sag .........................................1-5
Previous Works on Voltage Sag Mitigation ........................1-6
1.2
OBJECTIVE OF THIS THESIS.............................................................1-11
1.3
ORGANIZATION OF THIS THESIS .....................................................1-12
CHAPTER 2
MITIGATION OF SAGS BY OPTIMAL PLACEMENT OF
COMPENSATION DEVICES......................................................2-1
2.1
DISTRIBUTED MITIGATION VS CENTRAL MITIGATION .....................2-1
ii
2.2
SELECTING SAG COMPENSATION DEVICES .......................................2-3
2.3
EVALUATING CANDIDATE SOLUTION ...............................................2-4
2.3.1 Step 1: Obtain System Sag Data ..........................................2-5
2.3.2 Step 2: Obtain Equipment Tolerance Performance .............2-6
2.3.3 Step 3: Evaluation and Optimization ...................................2-7
2.4
OPTIMIZATION BY HEURISTIC ALGORITHMS .....................................2-8
CHAPTER 3
MODELING OF THYRISTOR VOLTAGE REGULATOR....3-1
3.1
INTRODUCTION .................................................................................3-1
3.2
PRINCIPLE DESCRIPTION ...................................................................3-2
3.3
MERITS OF TVR ...............................................................................3-4
3.4
SIMULATION OF REGULATING CHARACTERISTIC ..............................3-5
3.4.1
3.4.2
3.4.3
3.4.4
3.5
Description of Simulation Model ........................................3-5
Signal Detection...................................................................3-6
Control Circuit .....................................................................3-7
Two Simulation Cases (One Phase Only)............................3-9
SIMULATION OF SAG MITIGATION IN DISTRIBUTION SYSTEM .........3-12
3.5.1
3.5.2
3.5.3
3.5.4
Modeling Description ........................................................3-12
Simulation of Single-line-to-ground Fault.........................3-14
Comparison Delta Connection to Star Connection............3-17
Switching Dynamic Process and Response Time..............3-22
3.6
HYSTERESIS LOOP CONTROL TO IMPROVE STABILITY ....................3-24
3.7
CONCLUSIONS.................................................................................3-31
CHAPTER 4
PQ IMPROVEMENT BY OPTIMAL PLACEMENT OF TVR ...
..........................................................................................................4-1
4.1
INTRODUCTION .................................................................................4-1
4.2
DESCRIPTION OF STUDY SYSTEM AND VOLTAGE SAG PROBLEM ......4-2
4.2.1 System Configuration and Technical Data ..........................4-2
4.2.2 Computation of Study System .............................................4-5
iii
4.3
REGULATING VOLTAGE BY TVR ......................................................4-8
4.3.1 Equivalent Model of TVR ...................................................4-8
4.3.2 Installation and Effect of TVR...........................................4-12
4.4
FORMULATION OF OBJECTIVE FUNCTION .......................................4-14
4.5
SEARCHING OPTIMAL SOLUTION ....................................................4-18
4.6
PROGRAMMING AND RESULTS ........................................................4-22
4.7
DISCUSSIONS ABOUT APPLICATION OF GA ....................................4-26
4.7.1 Problem of Stagnancy and Stop Criteria............................4-26
4.7.2 Parameters Selection of GA...............................................4-27
4.8
CONCLUSIONS.................................................................................4-29
CHAPTER 5
STOCHASTIC ECONOMIC ASSESSMENT OF VOLTAGE
SAG MITIGATION.......................................................................5-1
5.1
INTRODUCTION .................................................................................5-1
5.2
PLACEMENT OF DVR AND TVR FOR VOLTAGE SAG MITIGATION ...5-2
5.2.1 Placement of DVR and TVR ...............................................5-2
5.2.2 Equivalent Model of DVR...................................................5-3
5.3
METHODS OF ECONOMIC ANALYSIS FOR SAG MITIGATION SOLUTION ..
.........................................................................................................5-5
5.3.1 Selection of Economic Analysis Tool .................................5-5
5.3.2 Cost Function Using Equivalent First Cost Method............5-6
5.3.3 Conflict Between Cim and Cr ...............................................5-7
5.4
COST OF SAG MITIGATION SOLUTION - Cim .....................................5-7
5.5
COST TO CONSUMERS AFTER INSTALLATION OF COMPENSATION
DEVICES – C r ....................................................................................5-9
5.5.1 Difficulties of Traditional Method.......................................5-9
5.5.2 Proposed Weighted Sampling Method...............................5-10
5.5.3 Voltage Seen by Individual Consumers During Voltage Sags
at PCC ................................................................................5-13
5.6
SEARCHING FOR OPTIMUM PLACEMENT.........................................5-14
5.6.1 Definition of Objective Function.......................................5-14
5.6.2 Sectionalized Coding of Solution ......................................5-15
iv
5.6.3 Reversion of GA Strings....................................................5-17
5.7
CONCLUSIONS AND DISCUSSIONS ...................................................5-19
CHAPTER 6
CASE STUDIES AND RESULT ANALYSIS.............................6-1
6.1
INTRODUCTION .................................................................................6-1
6.2
DATA OF CASE STUDIES ...................................................................6-1
6.2.1 Sag Data...............................................................................6-1
6.2.2 Customer Tolerance Characteristics ....................................6-4
6.2.3 Combination of Data for Case Studies ................................6-4
6.3
NUMERICAL RESULTS AND ANALYSIS ..............................................6-5
6.4
PERFORMANCE COMPARISON ...........................................................6-9
6.4.1 Performance Under Various Initial Conditions ...................6-9
6.4.2 Performance Under Various Coding System.....................6-10
6.5
CONCLUSIONS.................................................................................6-12
CHAPTER 7
CONCLUSIONS AND FUTURE WORK ...................................7-1
7.1
CONCLUSIONS...................................................................................7-1
7.2
CONTRIBUTIONS FROM THE PROJECT ...............................................7-3
7.3
RECOMMENDATIONS OF FUTURE WORK ...........................................7-4
APPENDIX A DYNAMIC VOLTAGE RESTORER......................................... A-1
A.1
BASIC PRINCIPLE ............................................................................. A-1
A.2
VOLTAGE SOURCE INVERTER (VSI) ................................................ A-2
APPENDIX B GENETIC ALGORITHM ........................................................... B-1
B.1
INTRODUCTION ................................................................................ B-1
B.2
BASIC CONCEPTS ............................................................................. B-1
v
APPENDIX C MATLAB MODELS OF TVR..................................................... C-1
APPENDIX D BUS ADMITTANCE MATRIXES OF STUDY SYSTEM....... C-1
REFERENCES ......................................................................................................Ref-1
vi
LIST OF FIGURES
Figure 1.1 Typical waveform of sag .........................................................................1-2
Figure 1.2 Voltage divider model for a voltage sag .................................................1-4
Figure 1.3 Percentages of PQ events observed by semiconductor companies .........1-5
Figure 1.4 Establishment of the sag problem and various ways of mitigation ........1-6
Figure 1.5 Effect of DVR to a sag caused by three-phase fault ...............................1-9
Figure 2.1 Central mitigation and distributed mitigation ..........................................2-2
Figure 2.2 Problem-solving flow chart for sags .......................................................2-4
Figure 2.3 Scatter diagram of sags obtained by one year of monitoring at an industrial
site ...........................................................................................................2-6
Figure 2.4 Example of the range of ASD sag tolerances .........................................2-7
Figure 3.1 TVR circuit (one-phase only) ..................................................................3-2
Figure 3.2 Simulation block diagram of TVR (one-phase).......................................3-5
Figure 3.3 Control pulse generation of TVR.............................................................3-8
Figure 3.4 Control logic circuit of TVR....................................................................3-8
Figure 3.5 Regulating characteristic of TVR in Case (1)........................................3-10
Figure 3.6 Regulating characteristic of TVR in Case (2)........................................3-12
Figure 3.7 TVR in distribution system to protect a sensitive load ..........................3-13
Figure 3.8 Voltage regulation ability of TVR in a SLG fault (Delta connection)...3-15
Figure 3.9 Voltage regulation ability of TVR in a SLG fault shown in rms value .......
(Delta connection)..................................................................................3-17
Figure 3.10 Phasor diagram of sag at the two sides of the Y/d11 transformer .........3-18
Figure 3.11 Comparison of delta connected TVR and star connected TVR .............3-19
Figure 3.12 Voltage regulation by star connected TVR............................................3-21
vii
Figure 3.13 Switching process and response time of half cycle rms detection.........3-23
Figure 3.14 Response time of one cycle rms detection .............................................3-23
Figure 3.15 Hysteresis loop control of TVR .............................................................3-25
Figure 3.16 Block diagram of hysteresis loop control ..............................................3-26
Figure 3.17 Comparison of hysteresis and non-hysteresis control under flicker noise....
................................................................................................................3-27
Figure 3.18 Pulse generation under different control methods .................................3-28
Figure 3.19 Pulse under different control methods ...................................................3-29
Figure 3.20 Comparison of hysteresis and non-hysteresis control under Gaussian noise
................................................................................................................3-30
Figure 4.1 Connection of study system .....................................................................4-2
Figure 4.2 Voltage magnitudes of the study system .................................................4-7
Figure 4.3 Equivalent model of TVR ........................................................................4-9
Figure 4.4 Installation of TVR and the effect to the system ...................................4-13
Figure 4.5 Function for f min and f max ....................................................................4-17
Figure 4.6 A typical GA string................................................................................4-19
Figure 4.7 Flow chart of GA optimization for TVR placement ..............................4-21
Figure 4.8 Optimal TVR placement and voltage distribution .................................4-22
Figure 4.9 Convergence performance .....................................................................4-23
Figure 4.10 TVR placement and voltage distribution for two sub-optimal solutions......
................................................................................................................4-25
Figure 4.11 Performance comparison under various values of Pc (fixed Pm = 0.01 ) .....
................................................................................................................4-28
Figure 4.12 Performance comparison under various values of Pm (fixed Pc = 0.75 ) .....
................................................................................................................4-28
Figure 5.1 Placement of DVR and TVR ...................................................................5-2
viii
Figure 5.2 Equivalent model of DVR .......................................................................5-3
Figure 5.3 Converting to current-source model ........................................................5-4
Figure 5.4 Minimizing Csag,t ......................................................................................5-7
Figure 5.5 Sag susceptibility curve ........................................................................5-12
Figure 5.6 The step function....................................................................................5-12
Figure 5.7 Example of the plain GA coding ...........................................................5-15
Figure 5.8 Example of the sectionalized GA coding...............................................5-16
Figure 5.9 Flowchart of the program.......................................................................5-18
Figure 6.1 Comparison of mitigation solutions.........................................................6-8
Figure 6.2
Convergence with different initial solutions...........................................6-9
Figure 6.3
Typical convergence performance ........................................................6-11
Figure A.1 Dynamic Voltage Restorer ..................................................................... A-1
Figure B.1 Operators of GA...................................................................................... B-2
Figure C.1 Single-phase model of TVR.................................................................... C-3
Figure C.2 Three-phase model of TVR .................................................................... C-4
ix
LIST OF TABLES
Table 1.1
Categories and typical characteristics of power system electromagnetic
phenomena ...............................................................................................1-3
Table 3.1
Switching status vs regulation voltage (3-tap TVR, Blank means OFF)......
..................................................................................................................3-3
Table 3.2
TVR output line voltage under star and delta connection......................3-22
Table 3.3
Parameters of hysteresis loop.................................................................3-25
Table 4.1
Data of the feeder lines ............................................................................4-3
Table 4.2
Data of the consumers..............................................................................4-4
Table 4.3
Voltage magnitudes of the study system .................................................4-6
Table 4.4
Information of heavy loads ......................................................................4-8
Table 4.5
Relationship between Vs and Vo ............................................................4-10
Table 4.6
Optimal TVR placement scheme ...........................................................4-23
Table 4.7
The improved voltages...........................................................................4-23
Table 4.8
TVR placement scheme for two sub-optimal solutions.........................4-25
Table 5.1
Probability density of sag data at pcc ....................................................5-10
Table 6.1
Sag1 Data .................................................................................................6-2
Table 6.2
Sag2 Data .................................................................................................6-2
Table 6.3
Tolerance setting of the customers...........................................................6-3
Table 6.4
Data composition for case studies............................................................6-4
Table 6.5
Parameters of the program .......................................................................6-5
Table 6.6
Results of case studies .............................................................................6-7
Table 6.7
Running time of plain and sectionalized coding......................................6-8
Table 6.8
Near-optimal initial solution ..................................................................6-10
x
Table D.1
Bus admittance matrix of the study system ............................................ D-2
Table D.2
Bus admittance matrix of the study system under the optimal TVR
placement ................................................................................................ D-6
xi
LIST OF PUBLICATIONS
[1]
C. S. Chang, Yu Zhemin,
“Multiobjective Control of Thyristor Voltage
Regulator for Power Quality Improvement”, Proceedings, International Power
Quality Conference, IPQC2002, Volume 1, 2002, Page(s): 273-279.
[2]
C. S. Chang, Yu Zhemin, “Optimal Placement of Thyristor Voltage Regulators
Using Genetic Algorithm For Power Quality Improvement”, Proceedings,
International Power Quality Conference, IPQC2002, Volume 2, 2002, Page(s):
407-413.
[3]
C. S. Chang, Yu Zhemin, “Distributed Mitigation of Voltage Sag by Optimal
Placement of Series Compensation Devices Based on Stochastic Assessment”
has been approved for publication in the IEEE Transactions on Power
Systems.
xii
ABSTRACT
This thesis deals with the mitigation of voltage sag, which is the most common powerquality problem experienced in power systems. This thesis presents a method of
optimal placement of two series compensation devices, namely: the Dynamic Voltage
Restorer (DVR) and the Thyristor Voltage Regulator (TVR). The DVR is a very
effective compensation device, but relatively little research was reported about its
optimal placement. The TVR is a relatively new circuit using thyristors for voltage
regulation. A computer model using MATLAB Simulink is developed for simulating
the TVR and for demonstrating its effectiveness for sag mitigation. In order to reduce
the effect of noise as switching on error, hysteresis control has been proposed and
demonstrated.
The late part of this project is devoted to the optimal placement of series compensation
devices for sag mitigation in two case studies, which are performed on a 34-node
supply system. In the simple case where sags are caused by predictable events such as
sudden load changes, the optimal placement of TVRs is achieved by optimizing of an
objective function that incorporates fuzzy membership functions of voltage profiles
and device cost.
In consideration of stochastic sag events occurring at the point of common coupling,
an algorithm dealing with the optimal mix and placement of DVR and TVR is
xiii
proposed. A cost function with two cost components, namely: the device cost and cost
to the consumers after the implementation of the devices is formulated to represent the
total power quality cost. A trade-off is made during optimization between these two
conflicting cost components. A probability-based technique known as the Weighted
Sampling is developed to provide a comprehensive representation of all cost penalties
due to voltage sags on individual consumers.
As the optimization involves many variables, such as location, type and parameters of
the devices (regulation ranges, power ratings), the heuristic-search approach of genetic
algorithm (GA) is adopted. Continuities and derivatives of the objective functions do
not restrict GA. An innovative coding system is developed to shorten the GA strings
and increase the GA’s speed for achieving high-quality solutions.
xiv
Chapter 1
Introduction
CHAPTER 1
1.1
INTRODUCTION
BACKGROUND OF THE RESEARCH
Power Quality (PQ) has become an important topic due to the fact that more and more
expensive and sensitive equipment is employed. Accordingly, the PQ problems may
cause consumers a great loss of time and revenue if the PQ problems are not handled
in a prompt and proper manner. An important paper has brought the attention of the
PQ problem [1], which claims that PQ-related problems cost $26 billion annually in
U.S. alone.
Therefore, the economic reason is the main initiative for extensive
research in PQ area.
1.1.1
Power Quality Phenomena
Though the definition of Power Quality is still debatable, many researchers concern the
categorization of this problem. In terms of both the definition and the categorization of
Power Quality, there are discrepancies existing among various Standard Organizations,
such as IEC [2] [3] and IEEE [4]. As one of the most reputable organizations, IEEE
Standard 1159-1995 IEEE Recommended Practice for Monitoring Electric Power
1-1
Chapter 1
Introduction
Quality adopts the Electro Magnetic Compatibility approach to describe power quality
phenomena and its categorization, which is shown in Table 1.1. In the tabulated
categories, a particular PQ problem known as voltage sag, also referred to as dip, is the
focus of this thesis.
1.1.2
Definition of Voltage Sag
Magnitude and duration are two important terms used to characterize voltage sag. In
this thesis, the voltage sag magnitude is defined as the remaining net root-mean-square
(rms) voltage in per-unit or percent of the system nominal voltage. According to Table
1.1, a voltage sag is defined as a short period of voltage dip of magnitude down to
0.1~0.9pu for a duration from 0.5 cycle up to 1 minute.
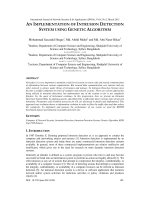
A typical voltage sag
waveform is shown in Figure 1.1.
Figure 1.1
Typical waveform of sag [5]
1-2
Chapter 1
Table 1.1
Introduction
Categories and typical characteristics of power system electromagnetic
phenomena
Categories
1.0 Transients
1.1 Impulsive
1.1.1 Nanosecond
1.1.2 Microsecond
1.1.3 Millisecond
1.2 Oscillatory
1.2.1 Low frequency
1.2.2 Medium frequency
1.2.3 High frequency
2.0 Short duration variations
2.1 Instantaneous
2.1.1 Sag
2.1.2 Swell
2.2 Momentary
2.2.1 Interruption
2.2.2 Sag
2.2.3 Swell
2.3 Temporary
2.3.1 Interruption
2.3.2 Sag
2.3.3 Swell
3.0 Long duration variations
3.1 Interruption, sustained
3.2 Undervoltages
3.3 Overvoltages
4.0 Voltage imbalance
5.0 Waveform distortion
5.1 DC offset
5.2 Harmonics
5.3 Interharmonics
5.4 Notching
5.5 Noises
6.0 Voltage fluctuations
7.0 Power frequency variations
Typical spectral
content
Typical duration
5 ns rise
1 µs rise
0.1 ms rise
< 50 ns
50 ns - 1 ms
> 1 ms
< 5kHz
5-500 kHz
0.5-5 MHz
0.3 - 50 ms
20 µs
5 µs
0-4 pu
0-8 pu
0-4 pu
0.5-30 cycles
0.5-30 cycles
0.1-0.9 pu
1.1-1.8 pu
0.5 cycles-3 s
30 cycles-3 s
30 cycles-3 s
< 0.1 pu
0.1-0.9 pu
1.1-1.4 pu
3 s-1 min
3 s-1 min
3 s-1 min
< 0.1 pu
0.1-0.9 pu
1.1-1.2 pu
> 1 min
> 1 min
> 1 min
steady state
0.0 pu
0.8-0.9 pu
1.1-1.2 pu
0.5-2%
steady state
steady state
steady state
steady state
steady state
intermittent
< 10s
0-0.1%
0-20%
0-2%
0-100th H
0-6 kHz
broad-band
< 25 Hz
Typical voltage
magnitude
0-1%
0.1-7%
1-3
Chapter 1
Introduction
It is known that most voltage sags are related to short-circuit caused by insulation
failures, line faults due to lightning, or other natural causes. In addition, sag can also
be caused by a sudden change of load, such as starting a large motor and operating
welder and furnace [6] [7]. The above problem can be analyzed using a voltage
divider model as illustrated in Figure 1.2.
Vsag
ZF
E
Fault
ZS
Load
pcc
Figure 1.2
Voltage divider model for a voltage sag [6]
As shown in the above figure, when the load current is neglected, the voltage at the
point-of-common (pcc) during the sag drops to:
Vsag =
ZF
E
ZS + ZF
(1.1)
1-4
Chapter 1
Introduction
However, with unbalanced faults, sag analysis should consider the impact of phaseimbalance and phase jumps [6]. In addition, the re-closing sequence of circuit breaker
also affects the sag duration and frequency.
1.1.3
The Necessity of Mitigating Sag
The voltage sag problem has been shown to occur more frequently than other PQ
related problems such as harmonics and voltage swell [8] [9]. The statistical result of
such a comparison is shown in Figure 1.3. Modern electronic appliances are very
sensitive to voltage sag. Usually, the trip event occurs when voltage sag exceeds the
withstanding threshold of the equipment, which may result in a significant loss of time
and revenue due to production outage and equipment damage. In addition to the above
loss, restoration from a disruption may incur other costs [10].
Figure 1.3
Percentages of PQ events observed by semiconductor companies [9]
It is important to note that voltage sag is different from supply interruption. The latter
is due to a complete separation of a load from the source, whereas the former is a
1-5
Chapter 1
Introduction
sudden voltage drop when the load remains connected to the supply. Individually, the
damage caused by an interruption is more serious than the damage caused by a voltage
sag. Statistically, the accumulated damage due to voltage sag may exceed the damage
caused by interruption because there are far more voltage sag events than interruption
events [5].
1.1.4
Previous Works on Voltage Sag Mitigation
Short-circuit or other causes
Power system
System-Equipment
Interface
Equipment
Figure 1.4
Reduce number and
duration of events
Improve system
design
Installation of
mitigation devices
Improvement of
equipment immunity
Establishment of the sag problem and various ways of mitigation [11]
Various solutions have been proposed to mitigate voltage sag due to its high frequency
of occurrence. Technically, it is possible to improve the design of equipment so that it
will not trip even under the most severe voltage sag [6]. However, such an approach is
too expensive to implement. Up to date, methods of mitigating voltage sags have been
widely investigated, and they can be classified into three broad categories.
The
1-6
Chapter 1
Introduction
classification is dependent on the mechanism leading to an equipment trip [6] [11]
(Figure 1.4).
(1)
Changes in the power system
Power Quality can be improved from the supplier’s side through:
(i)
Reducing the number of faults;
(ii)
Reducing the fault-clearing time;
(iii)
Providing more redundancy by load transfer, parallel and loop systems
and site generator, etc [12].
However, these measures tend to be very expensive so their costs have to be
weighted against the consequence of equipment trips.
(2)
Installing mitigation devices at the system-equipment interface
Motor-generator set. It consists of a utility-powered electric motor
driving an AC generator that supplies voltage to the load. The inertia of
the rotating machines inherently provides some sag compensation with
the addition of a flywheel [13]. The ride-through time of such a set is
several seconds. However, the capital cost and operation losses are
very high, which make it an expensive solution.
1-7
Chapter 1
Introduction
Switch controlled reactors and capacitors, e.g., Fault Current Limiters,
Thyristor Controlled Resonant Reactors, Thyristor Controlled Series
Capacitors (TCSCs), Static Var Compensators [14]-[16]
Transformer-based devices such as ferro-resonant transformers,
transformers with electronic tap changers [6]
Inverter-based devices that contain a voltage source inverter. A voltage
source inverter is a power electronic device capable of generating a
sinusoidal voltage at any required frequency, magnitude and phase
angle. Some examples of this kind of devices are: Uninterruptible
Power Supplies, Dynamic Voltage Restorer, Static Compensator. They
are known as “Power Conditioning Equipment” [6] [17].
Refer to
Appendix A for a description of the Dynamic Voltage Restorer.
(3)
Improving equipment immunity
Improvement of equipment immunity is probably the most effective solution
against voltage sag in the long term [6].
The equipment with high sag-
immunity can withstand severe sags. Thus the number of equipment trips due
to sag can be reduced accordingly. However, two important issues must be
considered regarding this approach. First, this approach is not feasible as the
equipment sensitivity to the voltage sag cannot be easily changed [11]. Second,
it is very expensive to improve the sag immunity for installed equipment.
1-8
Chapter 1
Introduction
Category (2) has undergone rapid development because it effectively solves sag
problems. For example, it has been found that limiting short circuit current through
Fault Current Limiter may reduce voltage sag amplitude dramatically during the fault
[14]. It has also been found that the use of a Static Compensator can also reduce the
impact from voltage sag [18]. However, the application of the above two approaches
are quite limited because these compensators are not primarily designed and
implemented for sag mitigation. On top of that, the high power loss is the main
disadvantage of these approaches.
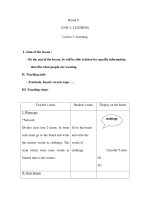
Supply voltage (kV)
Injected voltage (kV)
Load voltage (kV)
Figure 1.5
Time (sec)
Effect of DVR to a sag caused by three-phase fault [19]
The dynamic voltage restorer (DVR) is another sag compensation device which has
been developed for the main purpose of sag compensation. The effectiveness of this
1-9