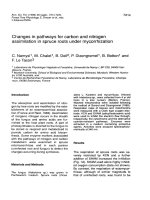
Energy technology perspectives pathways for low carbon transport
Bạn đang xem bản rút gọn của tài liệu. Xem và tải ngay bản đầy đủ của tài liệu tại đây (7.46 MB, 32 trang )
Energy Technology Perspectives
Pathways for low-carbon transport
John
John DULAC
DULAC
International
International Energy
Energy Agency
Agency
University
University of
of Leeds
Leeds ITS
ITS
77 July
July 2015
2015
© OECD/IEA 2013
2015
IEA Energy Technology Activities
Where are we today?
Where do we need to go?
How do we get there?
© OECD/IEA 2014
Energy Technology Perspectives
Comprehensive, long-term analysis of trends and energy technology potential
to 2050
Three main scenarios:
6DS: limited changes
4DS: current strategies for energy efficiency extended to 2050
2DS: CO2 emission mitigation scenario
Find out more: www.iea.org/etp
© OECD/IEA 2014
Carbon intensity of supply is stuck
Energy Sector Carbon Intensity Index (ESCII)
Meaningful progress at a global scale has yet to be demonstrated
Source: IEA ETP 2015
© OECD/IEA 2014
A transformation is needed…
Contribution by technology area to CO2 reductions (6DS to 2DS)
...and we to have the tools to develop a strategy and be proactive
Source: IEA ETP 2015
© OECD/IEA 2014
A transformation is needed…
Contribution by sector to CO2 reductions (6DS to 2DS)
Transport represents 20% of CO2 savings in the 2DS
Source: IEA ETP 2015
© OECD/IEA 2014
The IEA Mobility Model
MoMo: project history
2003
World Business Council for Sustainable Development and the
Sustainable Mobility Project (SMP) transport model
2004
SMP model developed further as IEA MoMo
2006-
Deeper analysis of vehicle technology potential, including plug-in
2008
hybrid electric vehicles
Elasticities of travel and ownership with respect to GDP and oil prices
Integration of significant historical data in MoMo
Development of scenarios for the IEA Energy Technology Perspectives
(ETP) project in 2008
2008-
Improved user friendliness and detailed modular approach
2012
Expanded coverage of countries and regions
Development of modal shift scenarios
Vehicle, fuel and infrastructure costs associated to scenario
2013+
Progressive transition to systems dynamics platform
Assessment of urban transport activity and potential
© OECD/IEA 2014
The IEA Mobility Model
MoMo: what is it?
Analytical tool used to elaborate projections of transport activity, energy demand and CO 2 emissions
Core of transport analysis in ETP
Essential tool for transport-related activities on…
energy efficiency: Global Fuel Economy Initiative (GFEI)
energy technology: Electric Vehicle Initiative (EVI)
cooperative efforts: Railway Handbook on Energy Consumption and CO 2 emissions with International Union of Railways
© OECD/IEA 2014
The IEA Mobility Model
MoMo: what is it?
Spreadsheet model of global transport
Mainly focus on vehicles and energy – also covers emissions, safety, infrastructure
and materials
Based on hypotheses on GDP and population growth, vehicle fuel economy, fuel
costs, travel demand, and vehicle and fuel market shares
World divided in 29 regions, including several specific countries
Contains large amount of data on technology and fuel pathways
Full evaluation of life cycle GHG emissions
Valuation of transport expenditures: vehicles, fuels and infrastructure
Module on material requirements for LDV manufacturing
© OECD/IEA 2014
The IEA Mobility Model
MoMo: key modelling steps
GDP, population,
Vehicle scrappage
structure of the transport
system
Transport activity (pkm, tkm,
vkm) and vehicle stock
New vehicle registrations
by age and by powertrain
Energy consumption per
Fuel prices
Pollutant
emissions
Vehicle price by
Emission factors
Energy use
CO2 emissions
Emission factors
km
powertrain
Generation of transport activity (pkm, tkm, vkm) and vehicle stock
Evaluation of new vehicle sales by powertrain and characterisation of vehicles by vintage
Calculation of energy use
Estimation of CO2 and pollutant emissions
© OECD/IEA 2014
The IEA Mobility Model
MoMo: analytical capability (1/2)
LDVs and freight trucks
Stock/sales model has been developed
Activity, intensity and energy use are estimated
CO2 emissions are calculated (well-to-wheel and tank-to-wheel, using ETP modelling framework)
Pollutant emissions (CO, VOCs, PM, lead and NO x) estimated
Vehicle and fuel costs are tracked
Buses and 2/3 wheelers
Rail and air
MoMo tracks stock, stock efficiency, travel, energy use and emissions
Total travel activity, energy intensities, energy use and emissions are tracked
Shipping
To date, MoMo tracks sectorial energy use and emissions
© OECD/IEA 2014
The IEA Mobility Model
MoMo: analytical capability (2/2)
MoMo has a user interface that allows
What-if scenario building
Back casting
Use of elasticities for ownership and mileage
Mode shift scenario building for passenger travel
MoMo also estimates material requirements and emissions:
Analysis of future vehicle sales (e.g. fuel cells) and how they impact materials requirements (e.g. precious metals)
Full life-cycle analysis for GHG emissions from LDVs (including manufacturing)
Recent MoMo developments include
Urban/non-urban travel splits applying data from global set of mobility surveys
Land transport infrastructure requirements in support of travel demand growth
Fuel cost, T&D, storage and distribution infrastructure assessment
Cost estimations from vehicle, fuel and infrastructure investments
© OECD/IEA 2014
The IEA Mobility Model
MoMo: who supports this work?
© OECD/IEA 2014
Energy consumption in transport
2012
1973
Transport
Transport
•
•
•
•
18% of TPES, mostly using oil (94%)
36% of global crude oil supply
19% of TPES, mostly using oil (93%)
55% of global crude oil supply
Source: IEA Key World Energy Statistics 2014
© OECD/IEA 2014
Energy consumption in transport
Global transport energy consumption by mode
Road transport accounts for ¾ of transport energy use
Source: IEA Key World Energy Statistics 2014
© OECD/IEA 2014
Energy consumption in transport
Global transport energy consumption by fuel type in 2012
Despite fuel economy measures and alternative fuels introductions, transport is still highly
dependent on oil.
Source: IEA Key World Energy Statistics 2014
© OECD/IEA 2014
Transport energy outlook to 2050
Transport energy forecasts by region
Global transport energy use could increase as much as 75% by 2050 without concerted action.
Source: IEA Mobility Model
© OECD/IEA 2014
Shifting mobility demand growth
Passenger light-duty vehicle growth to 2050 (6DS)
Passenger vehicle market will continue to drive transport market as non-OECD countries continue
to grow.
Source: IEA Mobility Model
© OECD/IEA 2014
Avoid, Shift and Improve Approach
Transport CO2 reduction potential by contribution
6DS
Scenarios to low(er)-carbon transport
•
•
•
Avoid unnecessary travel
Shift to more efficient modes
Improve the energy efficiency of each mode
Source: IEA ETP 2014
© OECD/IEA 2014
Transpor technology paradigm shift
Global portfolio of PLDV technologies (2DS)
EVs, PHEVs and FCEVs account for nearly ¾ of new vehicle sales in 2050 under the 2DS.
Source: IEA Mobility Model
© OECD/IEA 2014
Global transport expenditures to 2050
Global transport expenditures to 2050 (vehicles, fuel, infrastructure)
‘Avoid, shift and improve’ approach could reduce global transport expenditures by USD 70 trillion to
2050.
Source: IEA ETP 2012
© OECD/IEA 2014
Moving forward sustainably
Avoid and Shift
High-density environments and good transit use less energy
Time frame to alter urban design is often long
Structural change = behavioural change
© OECD/IEA 2014
Infrastructure and transport growth
Infrastructure and carrying capacity index (road and rail)
Rail carries more than 20% of global land transport activity using 2% of total infrastructural
km.*
*Activity is passenger and freight-tonne km. Infrastructural km include road paved lane-km and track-km.
Source: IEA Mobility Model, UIC (2013) and IRF (2013)
© OECD/IEA 2014
Moving forward sustainably
Improve
Market pull (short-term)
Technology push (longer
term)
Risk of rebound effect: need
for integrated measures
Source: GFEI (2013)
© OECD/IEA 2014
Transport electrification trends
Electric vehicle and global PLDV sales
Global electric vehicle sales topped 125 000 in 2012.
Despite progress, this still represents a tiny fraction of PLDV sales.
Source: IEA Mobility Model
Source: ETP 2014
© OECD/IEA 2014