International Financial Market and Korean Economy Monetary approaches in the long run
Bạn đang xem bản rút gọn của tài liệu. Xem và tải ngay bản đầy đủ của tài liệu tại đây (671.89 KB, 64 trang )
International Financial market and Korean Economy
Prepared by Seok-Kyun HUR
Monetary Approaches in the Long Run
Introduction
In the long run, prices and exchange rates will always
adjust so that the purchasing power of each currency
remains comparable over baskets of goods in different
countries.
This hypothesis provides another key building block in the
theory of how exchange rates are determined.
The theory we develop here has two parts. The first part
involves the theory of purchasing power, which links the
exchange rate to price levels in each country in the long
run.
In the second part of the chapter, we explore how price
levels are related to monetary conditions in each country.
1 Exchange Rates and Prices in the Long Run:
Purchasing Power Parity and Goods Market Equilibrium
Just as arbitrage occurs in the international market for
financial assets, it also occurs in the international markets for
goods.
The result of goods market arbitrage is that the prices of
goods in different countries expressed in a common currency
tend to be equalized.
Applied to a single good, this idea is referred to as the law of
one price; applied to an entire basket of goods, it is called
the theory of purchasing power parity.
The Law of One Price
The law of one price (LOOP) states that in the absence of trade
frictions (such as transport costs and tariffs), and under
conditions of free competition and price flexibility (where no
individual sellers or buyers have power to manipulate prices and
prices can freely adjust), identical goods sold in different
locations must sell for the same price when prices are expressed
in a common currency.
By definition, in a market equilibrium there are no arbitrage
opportunities. If diamonds can be freely moved between New
York and Amsterdam, both markets must offer the same price.
Economists refer to this situation in the two locations as an
integrated market.
The Law of One Price
We can mathematically state the law of one price as follows, for
the case of any good g sold in two locations:
g
US / EUR
q
Relative price of good g
in Europe versus U.S.
= ( E$ / € P ) /
g
EUR
European price
of good g in $
g
US
P
U.S. price
of good g in $
g
US / EUR
q
expresses the rate at which goods can be exchanged: it
tells us how many units of the U.S. good are needed to purchase
one unit of the same good in Europe.
E$ / € expresses the rate at which currencies can be exchanged
($/€).
The Law of One Price
We can rearrange the equation for price equality
g
E$ / € PEUR
= PUSg
to show that the exchange rate must equal the ratio of the goods’
prices expressed in the two currencies:
g
E$ / € = PUSg / PEUR
Exchange
rate
Ratio of
goods? prices
Purchasing Power Parity
The principle of purchasing power parity (PPP) is the
macroeconomic counterpart to the microeconomic law of one
price (LOOP). To express PPP algebraically, we can compute the
relative price of the two baskets of goods in each location:
qUS / EUR = ( E$ / € PEUR ) / PUS
Relative price
of basket
in Europe
versus U.S.
European price
of basket
expressed
in $
U.S. price
of basket
expressed
in $
There is no arbitrage when the basket is the same price in both
locations qUS/EUR = 1. PPP holds when price levels in two countries
are equal when expressed in a common currency. This statement
about equality of price levels is also called absolute PPP.
The Real Exchange Rate
The relative price of the baskets is one of the most important
variables in international macroeconomics, and it has a special
name: it is known as the real exchange rate.
The U.S. real exchange rate qUS/EUR = E$/€ PEUR/PUS tells us how
many U.S. baskets are needed to purchase one European basket;
it is the price of the European basket in terms of the U.S. basket.
The exchange rate for currencies is a nominal concept. The real
exchange rate is a real concept; it says how many U.S. baskets
can be exchanged for one European basket.
The Real Exchange Rate
The real exchange rate has some terminology similar to that used
with the nominal exchange rate:
■ If the real exchange rate rises (more Home goods are needed in
exchange for Foreign goods), we say Home has experienced a
real depreciation.
■ If the real exchange rate falls (fewer Home goods are needed
in exchange for Foreign goods), we say Home has experienced
a real appreciation.
Absolute PPP and the Real Exchange Rate
Purchasing power parity states that the real exchange rate is
equal to 1.
■ If the real exchange rate qUS/EUR is below 1 by x%, then
Foreign goods are relatively cheap, x% cheaper than Home
goods. In this case, the Home currency (the dollar) is said to be
strong, the euro is weak, and we say the euro is undervalued by
x%.
■ If the real exchange rate qUS/EUR is above 1 by x%, then Foreign
goods are relatively expensive, x% more expensive than Home
goods. In this case, the Home currency (the dollar) is said to be
weak, the euro is strong, and we say the euro is overvalued by
x%.
Absolute PPP, Prices, and the Nominal Exchange Rate
We can rearrange the no-arbitrage equation for the equality of
g
g
price levels,
allow us to solve for the
E$ / € PEUR
= toPUS
exchange rate that would be implied by absolute PPP:
Absolute PPP:
(14-1)
E$ / € = PUS / PEUR
Exchange rate
Ratio of price levels
Purchasing power parity implies that the exchange rate at which
two currencies trade equals the relative price levels of the two
countries.
Relative PPP, Inflation, and Exchange Rate Depreciation
• The rate of change of the price level is known as the rate of
inflation, or simply inflation.
• We now examine the implications of PPP for the study of
inflation.
• On the left-hand side of equation 11-1, the rate of change of the
exchange rate in Home is the rate of exchange rate depreciation
in Home given by
∆E$ / € ,t
E$ / € ,t
=
E$ / € ,t +1 − E$ / € ,t
E$ / € ,t
Rate of depreciation of the nominal exchange rate
Relative PPP, Inflation, and Exchange Rate Depreciation
On the right of Equation (14-1), the rate of change of the ratio of
two price levels equals the rate of change of the numerator minus
the rate of change of the denominator:
∆( PUS / PEUR ) ∆PUS ,t ∆PEUR ,t
=
−
PUS ,t
PEUR ,t
( PUS / PEUR )
PUS ,t +1 − PUS ,t PEUR ,t +1 − PEUR ,t
−
= πUS − π EUR
=
P
P
US ,t
,t
EUR
Rate of inflation in U.S.
πUS ,t
Rate of inflation in Europe
π EUR ,t
where the terms in brackets are the inflation rates in each
location, denoted πUS and πEUR, respectively.
Relative PPP, Inflation, and Exchange Rate Depreciation
If Equation (14-1) holds for levels of exchange rates and prices,
then it must also hold for rates of change in these variables. By
combining the last two expressions, we obtain
∆E$ / € ,t
E$ / € ,t
= πUS ,t − π EUR ,t
(14-2)
Inflation differential
Rate of depreciation
of the nominal exchange rate
This way of expressing PPP is called relative PPP, and it implies
that the rate of depreciation of the nominal exchange rate equals
the difference between the inflation rates of two countries (the
inflation differential).
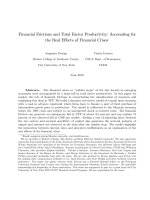
APPLICATION
Evidence for PPP in the Long Run and Short Run
FIGURE 14-2 (1 of 2)
Inflation Differentials and the Exchange Rate, 1975–2005
This scatterplot shows the relationship between the rate of exchange rate depreciation against the
U.S. dollar (the vertical axis) and the inflation differential against the United States (horizontal
axis) over the long run, based on data for a sample of 82 countries.
APPLICATION
Evidence for PPP in the Long Run and Short Run
FIGURE 14-2 (2 of 2)
Inflation Differentials and the Exchange Rate, 1975–2005 (continued)
The correlation between the two variables is strong and bears a close resemblance to the
theoretical prediction of PPP that all data points would appear on the 45-degree line.
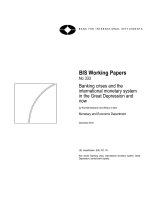
APPLICATION
Evidence for PPP in the Long Run and Short Run
FIGURE 14-3
Exchange Rates and Relative
Price Levels Data for the United
States and United Kingdom for
1975 to 2009 show that the
exchange rate and relative price
levels do not always move
together in the short run. Relative
price levels tend to change slowly
and have a small range of
movement; exchange rates move
more abruptly and experience
large fluctuations. Therefore,
relative PPP does not hold in the
short run. However, it is a better
guide to the long run, and we can
see that the two series do tend to
drift together over the decades.
How Slow Is Convergence to PPP?
• Research shows that price differences—the deviations from
PPP—can be quite persistent. Estimates suggest that these
deviations may die out at a rate of about 15% per year. This
kind of measure is often called a speed of convergence.
• Approximately half of any PPP deviation still remains after
four years: economists would refer to this as a four-year halflife.
• Such estimates provide a rule of thumb that is useful as a guide
to forecasting real exchange rates.
What Explains Deviations from PPP?
Economists have found a variety of reasons why PPP fails in the
short run:
■ Transaction costs. Include costs of transportation, tariffs, duties,
and other costs due to shipping and delays associated with
developing distribution networks and satisfying legal and
regulatory requirements in foreign markets. On average, they are
more than 20% of the price of goods traded internationally.
■ Nontraded goods. Some goods are inherently nontradable; they
have infinitely high transaction costs. Most goods and services fall
somewhere between tradable and nontradable.
What Explains Deviations from PPP?
■ Imperfect competition and legal obstacles. Many goods are not
simple undifferentiated commodities, as LOOP and PPP assume,
but are differentiated products with brand names, copyrights, and
legal protection. Such differentiated goods create conditions of
imperfect competition because firms have some power to set the
price of their good. With this kind of market power, firms can
charge different prices not just across brands but also across
countries.
■ Price stickiness. Prices do not or cannot adjust quickly and
flexibly to changes in market conditions.
An Example of REER
The Big Mac Index
For more than 20 years, The Economist newspaper has engaged in
a whimsical attempt to judge PPP theory based a well-known,
globally uniform consumer good: the McDonald’s Big Mac. The
over- or undervaluation of a currency against the U.S. dollar is
gauged by comparing the relative prices of a burger in a common
currency, and expressing the difference as a percentage deviation
from one:
Home of the undervalued
burger?
Big Mac
E
P
$/local currency local
Big Mac
−1
Big Mac Index = q
−1 =
Big
Mac
P
US
TABLE 14-1 (1 of 3)
The Big Mac Index The table shows the price of a Big Mac in July 2009 in local currency
(column 1) and converted to U.S. dollars (column 2) using the actual exchange rate (column 4).
The dollar price can then be compared with the average price of a Big Mac in the United States
($3.22 in column 1, row 1). The difference (column 5) is a measure of the overvaluation (+) or
undervaluation (−) of the local currency against the U.S. dollar. The exchange rate against the
dollar implied by PPP (column 3) is the hypothetical price of dollars in local currency that would
have equalized burger prices, which may be compared with the actual observed exchange rate
(column 4).
2 Money, Prices, and Exchange Rates in the Long Run:
Money Market Equilibrium in a Simple Model
In the long run the exchange rate is determined by the ratio of
the price levels in two countries. But this prompts a question:
What determines those price levels?
Monetary theory supplies an answer: in the long run, price
levels are determined in each country by the relative demand
and supply of money.
This section recaps the essential elements of monetary theory
and shows how they fit into our theory of exchange rates in the
long run.
What Is Money?
Economists think of money as performing three key functions in
an economy:
1. Money is a store of value because it can be used to buy goods
and services in the future. If the opportunity cost of holding
money is low, we will hold money more willingly than we
hold other assets (stocks, bonds, etc.).
2. Money also gives us a unit of account in which all prices in
the economy are quoted.
3. Money is a medium of exchange that allows us to buy and sell
goods and services without the need to engage in inefficient
barter (direct swaps of goods). Money is the most liquid asset
of all.
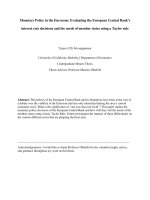
The Measurement of Money
FIGURE 14-4
The Measurement of Money
This figure shows the major
kinds of monetary aggregates
(currency, M0, M1, and M2)
for the United States from
2004 to 2010. Normally, bank
reserves are very close to zero,
so M0 and currency are
virtually identical, but reserves
spiked up during the financial
crisis in 2008, as private banks
sold securities to the Fed and
stored up the cash proceeds in
their Fed reserve accounts as a
precautionary hoard of
liquidity.