Standard Test Methods forNotched Bar Impact Testing of Metallic Material
Bạn đang xem bản rút gọn của tài liệu. Xem và tải ngay bản đầy đủ của tài liệu tại đây (561.99 KB, 28 trang )
An American National Standard
Designation: E23 – 07a´1
Standard Test Methods for
Notched Bar Impact Testing of Metallic Materials1
This standard is issued under the fixed designation E23; the number immediately following the designation indicates the year of original
adoption or, in the case of revision, the year of last revision. A number in parentheses indicates the year of last reapproval. A superscript
epsilon (´) indicates an editorial change since the last revision or reapproval.
This standard has been approved for use by agencies of the Department of Defense.
´1 NOTE—Editorial changes made throughout in September 2007.
E399 Test Method for Linear-Elastic Plane-Strain Fracture
Toughness K Ic of Metallic Materials
E604 Test Method for Dynamic Tear Testing of Metallic
Materials
E691 Practice for Conducting an Interlaboratory Study to
Determine the Precision of a Test Method
E1313 Guide for Recommended Formats for Data Records
Used in Computerization of Mechanical Test Data for
Metals (Discontinued 2000)3
1. Scope
1.1 These test methods describe notched-bar impact testing
of metallic materials by the Charpy (simple-beam) test and the
Izod (cantilever-beam) test. They give the requirements for:
test specimens, test procedures, test reports, test machines (see
Annex A1) verifying Charpy impact machines (see Annex A2),
optional test specimen configurations (see Annex A3), precracking Charpy V-notch specimens (see Annex A4), designation of test specimen orientation (see Annex A5), and determining the percent of shear fracture on the surface of broken
impact specimens (see Annex A6). In addition, information is
provided on the significance of notched-bar impact testing (see
Appendix X1), methods of measuring the center of strike (see
Appendix X2).
1.2 These test methods do not address the problems associated with impact testing at temperatures below –196 °C (–320
°F, 77 K).
1.3 The values stated in SI units are to be regarded as the
standard. Inch-pound units are provided for information only.
1.4 This standard does not purport to address all of the
safety concerns, if any, associated with its use. It is the
responsibility of the user of this standard to establish appropriate safety and health practices and determine the applicability of regulatory limitations prior to use. Specific precautionary statements are given in Section 5.
3. Summary of Test Method
3.1 The essential features of an impact test are: a suitable
specimen (specimens of several different types are recognized),
a set of anvils, and specimen supports on which the test
specimen is placed to receive the blow of the moving mass, a
moving mass that has sufficient energy to break the specimen
placed in its path, and a device for measuring the energy
absorbed by the broken specimen.
4. Significance and Use
4.1 These test methods of impact testing relate specifically
to the behavior of metal when subjected to a single application
of a force resulting in multi-axial stresses associated with a
notch, coupled with high rates of loading and in some cases
with high or low temperatures. For some materials and
temperatures the results of impact tests on notched specimens,
when correlated with service experience, have been found to
predict the likelihood of brittle fracture accurately. Further
information on significance appears in Appendix X1.
2. Referenced Documents
2.1 ASTM Standards:2
B925 Practices for Production and Preparation of Powder
Metallurgy (PM) Test Specimens
E177 Practice for Use of the Terms Precision and Bias in
ASTM Test Methods
5. Precautions in Operation of Machine
5.1 Safety precautions should be taken to protect personnel
from the swinging pendulum, flying broken specimens, and
hazards associated with specimen warming and cooling media.
1
These test methods are under the jurisdiction of ASTM Committee E28 on
Mechanical Testing and are the direct responsibility of Subcommittee E28.07 on
Impact Testing.
Current edition approved June 1, 2007. Published July 2007. Originally approved
in 1933. Last previous edition approved 2007 as E23 – 07. DOI: 10.1520/E002307AE01.
2
For referenced ASTM standards, visit the ASTM website, www.astm.org, or
contact ASTM Customer Service at For Annual Book of ASTM
Standards volume information, refer to the standard’s Document Summary page on
the ASTM website.
6. Apparatus
6.1 General Requirements:
6.1.1 The testing machine shall be a pendulum type of rigid
construction.
3
Withdrawn. The last approved version of this historical standard is referenced
on www.astm.org.
Copyright © ASTM International, 100 Barr Harbor Drive, PO Box C700, West Conshohocken, PA 19428-2959, United States.
1
E23 – 07a´1
may not be equally satisfactory for soft nonferrous metals and
hardened steels; therefore, many types of specimens are
recognized. In general, sharper and deeper notches are required
to distinguish differences in very ductile materials or when
using low testing velocities.
7.1.3 The specimens shown in Figs. 1 and 2 are those most
widely used and most generally satisfactory. They are particularly suitable for ferrous metals, excepting cast iron.4
7.1.4 The specimen commonly found suitable for die-cast
alloys is shown in Fig. 3.
7.1.5 The specimens commonly found suitable for Powder
Metallurgy (P/M) materials are shown in Figs. 4 and 5. P/M
impact test specimens shall be produced following the procedure in Practice B925. The impact test results of these materials
are affected by specimen orientation. Therefore,
6.1.2 The testing machine shall be designed and built to
conform with the requirements given in Annex A1.
6.2 Inspection and Verification
6.2.1 Inspection procedures to verify impact machines directly are provided in A2.2 and A2.3. The items listed in A2.2
must be inspected annually.
6.2.2 The procedures to verify Charpy V-notch machines
indirectly, using verification specimens, are given in A2.4.
Charpy impact machines must be verified directly and indirectly annually.
7. Test Specimens
7.1 Configuration and Orientation:
7.1.1 Specimens shall be taken from the material as specified by the applicable specification. Specimen orientation
should be designated according to the terminology given in
Annex A5.
7.1.2 The type of specimen chosen depends largely upon the
characteristics of the material to be tested. A given specimen
Notch length to edge
Adjacent sides shall be at
Cross-section dimensions
Length of specimen (L)
Centering of notch (L/2)
Angel of notch
Radius of notch
Ligament Length:
Type A specimen
Type B and C specimen
Finish requirements
4
Report of Subcommittee XV on Impact Testing of Committee A-3 on Cast Iron,
Proceedings, ASTM, Vol 33 Part 1, 1933.
90 62°
90° 6 10 min
6 0.075 mm
+0, −2.5 mm
6 1 mm
61°
60.025 mm
60.025 mm
60.025 mm
60.075 mm
2 µm on notched surface and opposite face; 4 µm on other two surfaces
FIG. 1 Charpy (Simple-Beam) Impact Test Specimens, Types A, B, and C
2
E23 – 07a´1
NOTE 1—Permissible variations shall be as follows:
Notch length to edge
Cross-section dimensions
Length of specimen
Angle of notch
Radius of notch
Ligament Length
Adjacent sides shall be at
Finish requirements
90 62°
60.025 mm
+0, −2.5 mm
61°
60.025 mm
60.025 mm
90° 6 10 min
2 µm on notched surface and opposite face; 4 µm on other two surfaces
FIG. 2 Izod (Cantilever-Beam) Impact Test Specimen, Type D
NOTE 1—Two Izod specimens may be cut from this bar.
NOTE 2—Blow shall be struck on narrowest face.
FIG. 3 Izod Impact Test Bar for Die Castings Alloys
3
E23 – 07a´1
Dimensions
L- Overall Length
W-Width
T-Thickness
mm
in.
55.0 6 1.0
10.00 6 0.13
10.00 6 0.13
2.16 6 0.04
0.394 6 0.005
0.394 6 0.005
NOTE 1—Adjacent sides shall be 90°6 10 min.
FIG. 4 Unnotched Charpy (Simple Beam) Impact Test Specimen for P/M Structural Materials
Dimensions
L- Overall Length
W-Width
T-Thickness
mm
in.
75.0 6 1.5†
10.00 6 0.13
10.00 6 0.13
2.95 6 0.06
0.394 6 0.005
0.394 6 0.005
NOTE 1—Adjacent sides shall be 90°6 10 min.
† Editorially corrected in August 2007.
FIG. 5 Izod (Cantilever-Beam) Impact Test Specimen for P/M Structural Materials
7.2.2 Notches shall be smoothly machined but polishing has
proven generally unnecessary. However, since variations in
notch dimensions will seriously affect the results of the tests,
adhering to the tolerances given in Fig. 1 is necessary (Appendix X1.2 illustrates the effects from varying notch dimensions
on Type A specimens). In keyhole specimens, the round hole
shall be carefully drilled with a slow feed rate. The slot may be
cut by any feasible method, but care must be exercised in
cutting the slot to ensure that the surface of the drilled hole
opposite the slot is not damaged.
7.2.3 Identification marks shall only be placed in the following locations on specimens: either of the 10-mm square
ends; the side of the specimen that faces up when the specimen
unless otherwise specified, the position of the specimen in
the machine shall be such that the pendulum will strike a
surface that is parallel to the compacting direction. For P/M
materials the impact test results are reported as unnotched
absorbed impact energy.
7.1.6 Sub-size and supplementary specimen recommendations are given in Annex A3.
7.2 Specimen Machining:
7.2.1 When heat-treated materials are being evaluated, the
specimen shall be finish machined, including notching, after
the final heat treatment, unless it can be demonstrated that the
impact properties of specimens machined before heat treatment
are identical to those machined after heat treatment.
4
E23 – 07a´1
structure, a transition in fracture mode occurs over a temperature range that depends on the chemical composition and
microstructure of the material. Test temperatures may be
chosen to characterize material behavior at fixed values, or
over a range of temperatures to characterize the transition
region, lower shelf, or upper shelf behavior, or all of these. The
choice of test temperature is the responsibility of the user of
this test method and will depend on the specific application.
For tests performed at room temperature, a temperature of 20
6 5°C (68 6 9°F) is recommended.
8.2.2 The temperature of a specimen can change significantly during the interval it is removed from the temperature
conditioning environment, transferred to the impact machine,
and the fracture event is completed (see Note 5). When using
a heating or cooling medium near its boiling point, use data
from the references in Note 5 or calibration data with thermocouples to confirm that the specimen is within the stated
temperature tolerances when the striker contacts the specimen.
If excessive adiabatic heating is expected, monitor the specimen temperature near the notch during fracture.
8.2.3 Verify temperature-measuring equipment at least every six months. If liquid-in-glass thermometers are used, an
initial verification shall be sufficient, however, the device shall
be inspected for problems, such as the separation of liquid, at
least twice annually.
8.2.4 Hold the specimen at the desired temperature within 6
1 °C (6 2 °F) in the temperature conditioning environment
(see 8.2.4.1 and 8.2.4.2). Any method of heating or cooling or
transferring the specimen to the anvils may be used provided
the temperature of the specimen immediately prior to fracture
is essentially the same as the holding temperature (see Note 5).
The maximum change in the temperature of the specimen
allowed for the interval between the temperature conditioning
treatment and impact is not specified here, because it is
dependent on the material being tested and the application. The
user of nontraditional or lesser used temperature conditioning
and transfer methods (or sample sizes) shall show that the
temperature change for the specimen prior to impact is
comparable to or less than the temperature change for a
standard size specimen of the same material that has been
thermally conditioned in a commonly used medium (oil, air,
nitrogen, acetone, methanol), and transferred for impact within
5 seconds (see Note 5). Three temperature conditioning and
transfer methods used in the past are: liquid bath thermal
conditioning and transfer to the specimen supports with centering tongs; furnace thermal conditioning and robotic transfer
to the specimen supports; placement of the specimen on the
supports followed by in situ heating and cooling.
8.2.4.1 For liquid bath cooling or heating use a suitable
container, which has a grid or another type of specimen
positioning fixture. Cover the specimens, when immersed, with
at least 25 mm (1 in.) of the liquid, and position so that the
notch area is not closer than 25 mm (1 in.) to the sides or
bottom of the container, and no part of the specimen is in
contact with the container. Place the device used to measure the
temperature of the bath in the center of a group of the
specimens. Agitate the bath and hold at the desired temperature
within 6 1°C (6 2°F). Thermally condition the specimens for
is positioned in the anvils (see Note 1); or the side of the
specimen opposite the notch. No markings, on any side of the
specimen, shall be within 15 mm of the center line of the notch.
An electrostatic pencil may be used for identification purposes,
but caution must be taken to avoid excessive heat.
NOTE 1—Careful consideration should be given before placing identification marks on the side of the specimen to be placed up when positioned
in the anvils. If the test operator is not careful, the specimen may be placed
in the machine with the identification marking resting on the specimen
supports. Under these circumstances, the absorbed energy value obtained
may be unreliable.
8. Procedure
8.1 Preparation of the Apparatus:
8.1.1 Perform a routine procedure for checking impact
machines at the beginning of each day, each shift, or just prior
to testing on a machine used intermittently. It is recommended
that the results of these routine checks be kept in a log book for
the machine. After the testing machine has been ascertained to
comply with Annex A1 and Annex A2, carry out the routine
check as follows:
8.1.1.1 Visually examine the striker and anvils for obvious
damage and wear.
8.1.1.2 Check the zero position of the machine by using the
following procedure: raise the pendulum to the latched position, move the pointer to near the maximum capacity of the
range being used, release the pendulum, and read the indicated
value. The pointer should indicate zero on machines reading
directly in energy. On machines reading in degrees, the reading
should correspond to zero on the conversion chart furnished by
the machine manufacturer.
NOTE 2—On machines that do not compensate for windage and friction
losses, the pointer will not indicate zero. In this case, the indicated values,
when converted to energy, shall be corrected for frictional losses that are
assumed to be proportional to the arc of swing.
8.1.1.3 To ensure that friction and windage losses are within
allowable tolerances, the following procedure is recommended: raise the pendulum to the latched position, move the
pointer to the negative side of zero, release the pendulum and
allow it to cycle five times (a forward and a backward swing
together count as one swing), prior to the sixth forward swing,
set the pointer to between 5 and 10 % of the scale capacity of
the dial, after the sixth forward swing (eleven half swings),
record the value indicated by the pointer, convert the reading to
energy (if necessary), divide it by 11 (half swings), then divide
by the maximum scale value being used and multiply it by 100
to get the percent friction. The result, friction and windage loss,
shall not exceed 0.4 % of scale range capacity being tested and
should not change by more than 10 % of friction measurements
previously made on the machine. If the friction and windage
loss value does exceed 0.4 % or is significantly different from
previous measurements, check the indicating mechanism, the
latch height, and the bearings for wear and damage. However,
if the machine has not been used recently, let the pendulum
swing for 50 to 100 cycles, and repeat the friction test before
undertaking repairs to the machine.
8.2 Test Temperature Considerations:
8.2.1 The temperature of testing affects the impact properties of most materials. For materials with a body centered cubic
5
E23 – 07a´1
at least 5 min before testing, unless a shorter thermal conditioning time can be shown to be valid by measurements with
thermocouples. Leave the mechanism (tongs, for example)
used to handle the specimens in the bath for at least 5 min
before testing, and return the mechanism to the bath between
tests.
8.2.4.2 When using a gas medium, position the specimens
so that the gas circulates around them and hold the gas at the
desired temperature within 6 1°C (6 2°F) for at least 30 min.
Leave the mechanism used to remove the specimen from the
medium in the medium except when handling the specimens.
8.3 Charpy Test Procedure:
8.3.1 The Charpy test procedure may be summarized as
follows: the test specimen is thermally conditioned and positioned on the specimen supports against the anvils; the pendulum is released without vibration, and the specimen is impacted
by the striker. Information is obtained from the machine and
from the broken specimen.
8.3.2 To position a test specimen in the machine, it is
recommended that self-centering tongs similar to those shown
in Fig. 6 be used (see A1.10.1). The tongs illustrated in Fig. 6
are for centering V-notch specimens. If keyhole specimens are
used, modification of the tong design may be necessary. If an
end-centering device is used, caution must be taken to ensure
that low-energy high-strength specimens will not rebound off
this device into the pendulum and cause erroneously high
recorded values. Many such devices are permanent fixtures of
machines, and if the clearance between the end of a specimen
in the test position and the centering device is not approximately 13 mm (0.5 in.), the broken specimens may rebound
into the pendulum.
8.3.3 To conduct the test, prepare the machine by raising the
pendulum to the latched position, set the energy indicator at the
maximum scale reading, or initialize the digital display, or
both, position the specimen on the anvils, and release the
pendulum. If a liquid bath or gas medium is being used for
NOTE 3—Temperatures up to +260°C (+500°F) may be obtained with
certain oils, but “flash-point” temperatures must be carefully observed.
NOTE 4—For testing at temperatures down to –196°C (–320 °F, 77 °K),
standard testing procedures have been found to be adequate for most
metals.
NOTE 5—A study has shown that a specimen heated to 100 C in water
can cool 10 C in the 5 s allowed for transfer to the specimen supports (1)5.
Other studies, using cooling media that are above their boiling points at
room temperature have also shown large changes in specimen temperature
during the transfer of specimens to the machine anvils. In addition, some
materials change temperature dramatically during impact testing at
cryogenic temperatures due to adiabatic heating (2).
5
The boldface numbers given in parentheses refer to a list of references at the
end of the text.
NOTE 1—Unless otherwise shown, permissible variation shall be 61 mm (0.04 in.).
Specimen Depth, mm (in.)
Base Width (A), mm (in.)
Height (B), mm (in.)
10 (0.394)
5 (0.197)
3 (0.118)
1.60 to 1.70 (0.063 to 0.067)
0.74 to 0.80 (0.029 to 0.033)
0.45 to 0.51 (0.016 to 0.020)
1.52 to 1.65 (0.060 to 0.065)
0.69 to 0.81 (0.027 to 0.032)
0.36 to 0.48 (0.014 to 0.019)
FIG. 6 Centering Tongs for V-Notch Charpy Specimens
6
E23 – 07a´1
thermal conditioning, perform the following sequence in less
than 5 s (for standard 10 3 10 3 55 mm (0.394 3 0.394 3
2.165 in.) specimens, see 8.2.4). Remove the test specimen
from its cooling (or heating) medium with centering tongs that
have been temperature conditioned with the test specimen,
place the specimen in the test position, and, release the
pendulum smoothly. If a test specimen has been removed from
the temperature conditioning bath and it is questionable that the
test can be conducted within the 5 s time frame, return the
specimen to the bath for the time required in 8.2 before testing.
8.3.3.1 If a fractured impact specimen does not separate into
two pieces, report it as unbroken (see 9.2.2 for separation
instructions). Unbroken specimens with absorbed energies of
less than 80 % of the machine capacity may be averaged with
values from broken specimens. If the individual values are not
listed, report the percent of unbroken specimens with the
average. If the absorbed energy exceeds 80 % of the machine
capacity and the specimen passes completely between the
anvils, report the value as approximate (see 10.1) do not
average it with other values. If an unbroken specimen does not
pass between the machine anvils, (for example, it stops the
pendulum), the result shall be reported as exceeding the
machine capacity. A specimen shall never be struck more than
once.
8.3.3.2 If a specimen jams in the machine, disregard the
results and check the machine thoroughly for damage or
misalignment, which would affect its calibration.
8.3.3.3 To prevent recording an erroneous value, caused by
jarring the indicator when locking the pendulum in its upright
(ready) position, read the value for each test from the indicator
prior to locking the pendulum for the next test.
8.4 Izod Test Procedure:
8.4.1 The Izod test procedure may be summarized as
follows: the test specimen is positioned in the specimenholding fixture and the pendulum is released without vibration.
Information is obtained from the machine and from the broken
specimen. The details are described as follows:
8.4.2 Testing at temperatures other than room temperature is
difficult because the specimen-holding fixture for Izod specimens is often part of the base of the machine and cannot be
readily cooled (or heated). Consequently, Izod testing is not
recommended at other than room temperature.
8.4.3 Clamp the specimen firmly in the support vise so that
the centerline of the notch is in the plane of the top of the vise
within 0.125 mm (0.005 in.). Set the energy indicator at the
maximum scale reading, and release the pendulum smoothly.
Sections 8.3.3.1-8.3.3.3 inclusively, also apply when testing
Izod specimens.
used in the past include optical encoders and strain gaged strikers.
9.2 Lateral expansion measurement methods must take into
account the fact that the fracture path seldom bisects the point
of maximum expansion on both sides of a specimen. One half
of a broken specimen may include the maximum expansion for
both sides, one side only, or neither. Therefore, the expansion
on each side of each specimen half must be measured relative
to the plane defined by the undeformed portion on the side of
the specimen, as shown in Fig. 7. For example, if A1 is greater
than A2, and A3 is less than A4, then the lateral expansion is the
sum of A1 + A 4.
9.2.1 Before making any expansion measurements, it is
essential that the two specimen halves are visually examined
for burrs that may have formed during impact testing; if the
burrs will influence the lateral expansion measurements, they
must be removed (by rubbing on emery cloth or any other
suitable method), making sure that the protrusions to be
measured are not rubbed during the removal of the burr. Then,
examine each fracture surface to ascertain that the protrusions
have not been damaged by contacting an anvil, a machine
mounting surface, etc. Lateral expansion shall not be measured
on a specimen with this type of damage.
9.2.2 Lateral expansion measurements shall be reported as
follows. The lateral expansion of an unbroken specimen can be
reported as broken if the specimen can be separated by pushing
the hinged halves together once and then pulling them apart
without further fatiguing the specimen, and the lateral expansion measured for the unbroken specimen (prior to bending) is
equal to or greater than that measured for the separated halves.
In the case where a specimen cannot be separated into two
halves, the lateral expansion can be measured as long as the
shear lips can be accessed without interference from the hinged
ligament that has been deformed during testing. The specimen
should be reported as unbroken.
9.2.3 Lateral expansion may be measured easily by using a
gage like the one shown in Fig. 8 (assembly and details shown
in Fig. 9). Using this type of gage the measurement is made
with the following procedure: orient the specimen halves so
that the compression sides are facing each another, take one
half of the fractured specimen and press it against the anvil and
9. Information Obtainable from Impact Tests
9.1 The absorbed energy shall be taken as the difference
between the energy in the striking member at the instant of
impact with the specimen and the energy remaining after
breaking the specimen. This value is determined by the
machine’s scale reading which has been corrected for windage
and friction losses.
FIG. 7 Halves of Broken Charpy V-Notch Impact Specimen
Illustrating the Measurement of Lateral Expansion, Dimensions
A1, A2, A3, A4 and Original Width, Dimension W
NOTE 6—Alternative means for energy measurement are acceptable
provided the accuracy of such methods can be demonstrated. Methods
7
E23 – 07a´1
FIG. 8 Lateral Expansion Gage for Charpy Impact Specimens
FIG. 9 Assembly and Details for Lateral Expansion Gage
dial gage plunger and record the reading, make a similar
measurement on the other half (same side) of the fractured
specimen and disregard the lower of the two values, do the
same for the other side of the fractured specimen, report the
sum of the maximum expansions for the 2 sides as the lateral
expansion for the specimen.
9.3 The percentage of shear fracture on the fracture surfaces of impact specimens may be determined using a variety
of methods. The acceptable methods are defined in Annex A6.
For each method, the user must distinguish between regions
formed by ductile stable crack growth mechanisms, and
regions formed by brittle fast crack propagation (unstable crack
growth mechanisms). The typical zones of fracture appearance
are shown in Fig. 10, where the “flat fracture” region is the
region in which unstable crack growth occurs on a microsecond time scale.
8
E23 – 07a´1
10.2.2 Test temperature,
10.2.3 Absorbed energy, and
10.2.4 Any other contractual requirements.
10.3 For other than commercial acceptance testing the
following information is often reported in addition to the
information in 10.2:
10.3.1 Lateral expansion,
10.3.2 Unbroken specimens,
10.3.3 Fracture appearance (% shear, See Note A6.1),
10.3.4 Specimen orientation, and
10.3.5 Specimen location.
NOTE 7—A recommended format for computerization of notched bar
impact test data is available in Practice E1313.
NOTE 8—When the test temperature is specified as room temperature,
report the actual temperature.
11. Precision and Bias
11.1 An Interlaboratory study used CVN specimens of low
energy and of high energy to find sources of variation in the
CVN absorbed energy. Data from 29 laboratories were included with each laboratory testing one set of five specimens of
each energy level. Except being limited to only two energy
levels (by availability of reference specimens), Practice E691
was followed for the design and analysis of the data, the details
are given in ASTM Research Report NO. RR:E28-1014.6
11.2 Precision—The Precision information given below (in
units of J and ft·lbf) is for the average CVN absorbed energy of
five test determinations at each laboratory for each material.
NOTE 1—The shear of ductile fracture regions on the fracture surface
include the fracture initiation region, the two shear lips, and the region of
final fracture. The flat or radial fracture region is a region of less ductile
unstable crack growth.
FIG. 10 Determination of Percent Shear Fracture
The percent shear area on the fracture surface of a Charpy
impact specimen is typically calculated as the difference
between the total fractured area and the area of flat fracture.
The measurement methods described here provide estimates
for the area of the macroscopically flat fracture region (directly
or indirectly), but do not consider details of the fracture mode
for this “ flat” region of unstable fracture. The flat fracture
region could be 100 percent cleavage, a mixture of cleavage
and ductile-dimple fracture morphologies, or other combinations of ductile-brittle fracture morphologies. Estimates of
ductility within the unstable crack growth region are beyond
the scope of these methods.
Material
Absorbed Energy
95 % Repeatability Limit
95 % Reproducibility Limits
Low Energy
J
ft-lbf
15.9
2.4
2.7
11.7
1.7
2.0
High Energy
J
ft-lbf
96.2
8.3
9.2
71.0
6.1
6.8
The terms repeatability and reproducibility limit are used as
defined in Practice E177. The respective standard deviations
among test results may be obtained by dividing the above
limits by 2.8.
11.3 Bias— Bias cannot be defined for CVN absorbed
energy. The physical simplicity of the pendulum design is
complicated by complex energy loss mechanisms within the
machine and the specimen. Therefore, there is no absolute
standard to which the measured values can be compared.
10. Report
10.1 Absorbed energy values above 80 % of the scale range
are inaccurate and shall be reported as approximate. Ideally an
impact test would be conducted at a constant impact velocity.
In a pendulum-type test, the velocity decreases as the fracture
progresses. For specimens that have impact energies approaching 80 % of the capacity of the pendulum, the velocity of the
pendulum decreases (to about 45 % of the initial velocity)
during fracture to the point that accurate impact energies are no
longer obtained.
10.2 For commercial acceptance testing, report the following information (for each specimen tested):
10.2.1 Specimen type (and size if not the full-size specimen),
12. Keywords
12.1 Charpy test; fracture appearance; Izod test; impact test;
notched specimens; pendulum machine
6
Supporting data have been filed at ASTM International Headquarters and may
be obtained by requesting Research Report RR: E28–1014.
9
E23 – 07a´1
ANNEXES
(Mandatory Information)
A1. GENERAL REQUIREMENTS FOR IMPACT MACHINES
initial position shall operate freely and permit release of the
pendulum without initial impulse, retardation, or side vibration. If the same lever used to release the pendulum is also used
to engage the brake, means shall be provided for preventing the
brake from being accidentally engaged.
A1.1 The machine frame shall be equipped with a bubble
level or a machined surface suitable for establishing levelness
of the axis of pendulum bearings or, alternatively, the levelness
of the axis of rotation of the pendulum may be measured
directly. The machine shall be level to within 3:1000 and
securely bolted to a concrete floor not less than 150 mm (6 in.)
thick or, when this is not practical, the machine shall be bolted
to a foundation having a mass not less than 40 times that of the
pendulum. The bolts shall be tightened as specified by the
machine manufacturer.
A1.9 Specimen clearance is needed to ensure satisfactory
results when testing materials of different strengths and compositions. The test specimen shall exit the machine with a
minimum of interference. Pendulums used on Charpy machines are of three basic designs, as shown in Fig. A1.1.
A1.9.1 When using a C-type pendulum or a compound
pendulum, the broken specimen will not rebound into the
pendulum and slow it down if the clearance at the end of the
specimen is at least 13 mm (0.5 in.) or if the specimen is
deflected out of the machine by some arrangement such as that
shown in Fig. A1.1.
A1.9.2 When using the U-type pendulum, means shall be
provided to prevent the broken specimen from rebounding
against the pendulum (see Fig. A1.1). In most U-type pendulum machines, steel shrouds should be designed and installed
to the following requirements: (a) have a thickness of approximately 1.5 mm (0.06 in.), (b) have a minimum hardness of 45
HRC, (c) have a radius of less than 1.5 mm (0.06 in.) at the
underside corners, and (d) be so positioned that the clearance
between them and the pendulum overhang (both top and sides)
does not exceed 1.5 mm (0.06 in.).
A1.2 A scale or digital display, graduated in degrees or
energy, on which readings can be estimated in increments of
0.25 % of the energy range or less shall be furnished for the
machine.
A1.2.1 The scales and digital displays may be compensated
for windage and pendulum friction. The error in the scale
reading at any point shall not exceed 0.2 % of the range or
0.4 % of the reading, whichever is larger. (See A2.3.8.)
A1.3 The total friction and windage losses of the machine
during the swing in the striking direction shall not exceed
0.75 % of the scale range capacity, and pendulum energy loss
from friction in the indicating mechanism shall not exceed
0.25 % of scale range capacity. See A2.3.8 for friction and
windage loss calculations.
A1.4 The position of the pendulum, when hanging freely,
shall be such that the striker is within 2.5 mm (0.10 in.) from
the test specimen. When the indicator has been positioned to
read zero energy in a free swing, it shall read within 0.2 % of
scale range when the striker of the pendulum is held against the
test specimen. The plane of swing of the pendulum shall be
perpendicular to the transverse axis of the Charpy specimen
anvils or Izod vise within 3:1000.
NOTE A1.1—In machines where the opening within the pendulum
permits clearance between the ends of a specimen (resting on the
specimen supports) and the shrouds, and this clearance is at least 13 mm
(0.5 in.), the requirements (a) and (d) need not apply.
A1.10 Charpy Apparatus:
A1.10.1 Means shall be provided (see Fig. A1.2) to locate
and support the test specimen against two anvil blocks in such
a position that the center of the notch can be located within
0.25 mm (0.010 in.) of the midpoint between the anvils (see
8.3.2).
A1.10.2 The supports and striker shall be of the forms and
dimensions shown in Fig. A1.2. Other dimensions of the
pendulum and supports should be such as to minimize interference between the pendulum and broken specimens.
A1.10.3 The center line of the striker shall advance in the
plane that is within 0.40 mm (0.016 in.) of the midpoint
between the supporting edges of the anvils. The striker shall be
perpendicular to the longitudinal axis of the specimen within
5:1000. The striker shall be parallel within 1:1000 to the face
of a perfectly square test specimen held against the anvils.
A1.5 Transverse play of the pendulum at the striker shall
not exceed 0.75 mm (0.030 in.) under a transverse force of 4 %
of the effective weight of the pendulum applied at the center of
strike. Radial play of the pendulum bearings shall not exceed
0.075 mm (0.003 in.).
A1.6 The impact velocity (tangential velocity) of the
pendulum at the center of the strike shall not be less than 3 nor
more than 6 m/s (not less than 10 nor more than 20 ft/s).
A1.7 The height of the center of strike in the latched
position, above its free hanging position, shall be within 0.4 %
of the range capacity divided by the supporting force, measured as described in A2.3.5.1 If windage and friction are
compensated for by increasing the height of drop, the height of
drop may be increased by not more than 1 %.
A1.11 Izod Apparatus:
A1.11.1 Means shall be provided (see Fig. A1.3) for clamping the specimen in such a position that the face of the
specimen is parallel to the striker within 1:1000. The edges of
A1.8 The mechanism for releasing the pendulum from its
10
E23 – 07a´1
FIG. A1.1 Typical Pendulums and Anvils for Charpy Machines, Shown with Modifications to Minimize Jamming
the clamping surfaces shall be sharp angles of 90 6 1° with
radii less than 0.40 mm (0.016 in.). The clamping surfaces shall
be smooth with a 2 µm (63 µin.) finish or better, and shall
clamp the specimen firmly at the notch with the clamping force
applied in the direction of impact. For rectangular specimens,
the clamping surfaces shall be flat and parallel within 0.025
mm (0.001in.). For cylindrical specimens, the clamping surfaces shall be contoured to match the specimen and each
surface shall contact a minimum of p/2 rad (90°) of the
specimen circumference.
A1.11.2 The dimensions of the striker and its position
relative to the specimen clamps shall be as shown in Fig. A1.3.
11
E23 – 07a´1
Note1–Anvils shall be manufactured with a surface finish of 0.1 µm or better on surfaces A and B above the anvil supports when mounted on the machine.
Note 2– Striker shall be manufactured with a surface finish of 0.1 µm or better along the front radius and along both sides.
Note 3–All dimensional tolerances shall be 60.05 mm unless otherwise specified.
FIG. A1.2 Charpy Striker
12
E23 – 07a´1
NOTE 1—All dimensional tolerances shall be 60.05 mm unless otherwise specified.
NOTE 2—The clamping surfaces of A and B shall be flat and parallel
within 0.025 mm .
NOTE 3— Surface finish on striker and vise shall be 2 µm.
NOTE 4—Striker width must be greater than that of the specimen being
tested.
FIG. A1.3 Izod (Cantilever-Beam) Impact Test
A2. VERIFICATION OF PENDULUM IMPACT MACHINES
is not intended that parts not subjected to wear (such as
pendulum and scale linearity) are to be directly verified each
year unless a problem is evident. Only the items cited in A2.2
are required to be inspected annually. Other parts of the
machine shall be directly verified at least once, when the
machine is new, or when parts are replaced.
A2.1.3 Charpy machines do not require immediate indirect
verification after removal and replacement of the striker or
anvils, or both, that were on the machine when it was verified
provided the following safeguards are implemented: (1) an
organizational procedure for the change is developed and
followed, (2) high-strength low-energy quality control specimens, (See A2.4.1.1 for guidance in breaking energy range for
these specimens), are tested prior to removal and immediately
after installation of the previously verified striker or anvils, or
both within the 365 day verification period, (3) the results of
the before and after tests of the quality control specimens are
within 1.4 Joules (1.0 ft-lbf) of each other, (4) the results of the
comparisons are kept in a log book, and (5) before reattachment, the striker and anvils are visually inspected for wear and
A2.1 The verification of impact machines has two parts: direct verification, which consists of inspecting the machine to
ensure that the requirements of this annex and Annex A1 are
met, and indirect verification, which entails the testing of
verification specimens.
A2.1.1 Izod machines are verified by direct verification
annually.
A2.1.2 Charpy machines shall be verified directly and
indirectly annually. Data is valid only when produced within
365 days following the date of the most recent successful
verification test. Charpy machines shall also be verified immediately after replacing parts that may affect the measured
energy, after making repairs or adjustments, after they have
been moved, or whenever there is reason to doubt the accuracy
of the results, without regard to the time interval. These
restrictions include cases where parts, which may affect the
measured energy, are removed from the machine and then
reinstalled without modification (with the exception of when
the striker or anvils are removed to permit use of a different
striker or set of anvils and then are reinstalled, see A2.1.3). It
13
E23 – 07a´1
A2.3.4 Determine the Center of Strike—For Charpy machines the center of strike of the pendulum is determined using
a half-width specimen (10 3 5 3 55 mm) in the test position.
With the striker in contact with the specimen, a line marked
along the top edge of the specimen on the striker will indicate
the center of strike. For Izod machines, the center of strike may
be considered to be the contact line when the pendulum is
brought into contact with a specimen in the normal testing
position.
A2.3.5 Determine the Potential Energy—The following
procedure shall be used when the center of strike of the
pendulum is coincident with the radial line from the centerline
of the pendulum bearings (herein called the axis of rotation) to
the center of gravity (see Appendix X2). If the center of strike
is more than 1.0 mm (0.04 in.) from this line, suitable
corrections in elevation of the center of strike must be made in
A2.3.8.1 and A2.3.9, so that elevations set or measured
correspond to what they would be if the center of strike were
on this line. The potential energy of the system is equal to the
height from which the pendulum falls, as determined in
A2.3.5.2, times the supporting force, as determined in A2.3.5.1
A2.3.5.1 To measure the supporting force, support the
pendulum horizontally to within 15:1000 with two supports,
one at the bearings (or center of rotation) and the other at the
center of strike on the striker (see Fig. A2.1). Then arrange the
support at the striker to react upon some suitable weighing
device such as a platform scale or balance, and determine the
weight to within 0.4 %. Take care to minimize friction at either
point of support. Make contact with the striker through a round
rod crossing the center of strike. The supporting force is the
scale reading minus the weights of the supporting rod and any
shims that may be used to maintain the pendulum in a
horizontal position.
A2.3.5.2 Determine the height of pendulum drop for compliance with the requirement of A1.7. On Charpy machines
determine the height from the top edge of a half-width (or
center of a full-width) specimen to the elevated position of the
center of strike to 0.1 %. On Izod machines determine the
height from a distance 22.66 mm (0.892 in.) above the vise to
the release position of the center of strike to 0.1 %. The height
may be determined by direct measurement of the elevation of
the center of strike or by calculation from the change in angle
of the pendulum using the following formulas (see Fig. A2.1):
dimensionally verified to assure that they meet the required
tolerances of Fig. A1.2. The use of certified impact verification
specimens is not required and internal quality control specimens are permitted.
A2.2 Direct Verification of Parts Requiring Annual Inspection:
A2.2.1 Inspect the specimen supports, anvils, and striker
and replace any of these parts that show signs of wear. A
straight edge or radius gage can be used to discern differences
between the used and unused portions of these parts to help
identify a worn condition (see Note A2.1).
NOTE A2.1—To measure the anvil or striker radii, the recommended
procedure is to make a replica (casting) of the region of interest and
measure cross sections of the replica. This can be done with the anvils and
striker in place on the machine or removed from the machine. Make a dam
with cardboard and tape surrounding the region of interest, then pour a
low-shrinkage casting compound into the dam (silicon rubber casting
compounds work well). Allow the casting to cure, remove the dam, and
slice cross sections through the region of interest with a razor. Use these
cross sections to make radii measurements on optical comparators or other
instruments.
A2.2.2 Ensure the bolts that attach the anvils and striker to
the machine are tightened to the manufacture’s specifications.
A2.2.3 Verify that the shrouds, if applicable, are properly
installed (see A1.9.2).
A2.2.4 The pendulum release mechanism, which releases
the pendulum from its initial position, shall comply with A1.8.
A2.2.5 Check the level of the machine in both directions
(see A1.1).
A2.2.6 Check that the foundation bolts are tightened to the
manufacturer’s specifications.
NOTE A2.2—Expansion bolts or fasteners with driven in inserts shall
not be used for foundations. These fasteners will work loose and/or tighten
up against the bottom of the machine indicating a false high torque value
when the bolts are tightened.
A2.2.7 Check the indicator zero and the friction loss of the
machine as described in 8.1.
A2.3 Direct Verification of Parts to be Verified at Least
Once:
A2.3.1 Charpy anvils and supports or Izod vises shall
conform to the dimensions shown in Fig. A1.2 or Fig. A1.3.
NOTE A2.3—The impact machine will be inaccurate to the extent that
some energy is used in deformation or movement of its component parts
or of the machine as a whole; this energy will be registered as used in
fracturing the specimen.
h 5 S ~1 – cos ~b!!
(A2.1)
h1 5 S ~1 – cos ~a!!
(A2.2)
A2.3.2 The striker shall conform to the dimensions shown
in Fig. A1.2 or Fig. A1.3. The mounting surfaces must be clean
and free of defects that would prevent a good fit. Check that the
striker complies with A1.10.3 (for Charpy tests) or A1.11.1 (for
Izod tests).
A2.3.3 The pendulum alignment shall comply with A1.4
and A1.5. If the side play in the pendulum or the radial play in
the bearings exceeds the specified limits, adjust or replace the
bearings.
where
h
= initial elevation of the striker, m (ft),
S
= length of the pendulum distance to the center of
strike, m (ft),
b = angle of fall,
h 1 = height of rise, m (ft), and
a = angle of rise.
A2.3.6 Determine the impact velocity, [v], of the machine,
neglecting friction, by means of the following equation:
14
E23 – 07a´1
where:
L = distance from the axis to the center of percussion, m
(ft),
g = local gravitational acceleration (accuracy of one part in
one thousand), m/s2 (ft/s2),
p = 3.1416, and
p = period of a complete swing (to and fro), s.
A2.3.8 Determination of the Friction Losses—The energy
loss from friction and windage of the pendulum and friction in
the recording mechanism, if not corrected, will be included in
the energy loss attributed to breaking the specimen and can
result in erroneously high measurements of absorbed energy.
For machines recording in degrees, frictional losses are usually
not compensated for by the machine manufacturer, whereas in
machines recording directly in energy, they are usually compensated for by increasing the starting height of the pendulum.
Determine energy losses from friction as follows:
A2.3.8.1 Without a specimen in the machine, and with the
indicator at the maximum energy reading, release the pendulum from its starting position and record the energy value
indicated. This value should indicate zero energy if frictional
losses have been corrected by the manufacturer. Now raise the
pendulum slowly until it just contacts the indicator at the value
obtained in the free swing. Secure the pendulum at this height
and determine the vertical distance from the center of strike to
the top of a half-width specimen positioned on the specimen
rest supports within 0.1 % (see A2.3.5). Determine the supporting force as in A2.3.5.1 and multiply by this vertical
distance. The difference in this value and the initial potential
energy is the total energy loss in the pendulum and indicator
combined. Without resetting the pointer, repeatedly release the
pendulum from its initial position until the pointer shows no
further movement. The energy loss determined by the final
position of the pointer is that due to the pendulum alone. The
frictional loss in the indicator alone is then the difference
between the combined indicator and pendulum losses and those
due to the pendulum alone.
A2.3.9 The indicating mechanism accuracy shall be
checked to ensure that it is recording accurately over the entire
range (see A1.2.1). Check it at graduation marks corresponding
to approximately 0, 10, 20, 30, 50, and 70 % of each range.
With the striker marked to indicate the center of strike, lift the
pendulum and set it in a position where the indicator reads, for
example, 13 J (10 ft·lbf). Secure the pendulum at this height
and determine the vertical distance from the center of strike to
the top of a half-width specimen positioned on the specimen
supports within 0.1 % (see A2.3.5). Determine the residual
energy by multiplying the height of the center of strike by the
supporting force, as described in A2.3.5.1. Increase this value
by the total frictional and windage losses for a free swing (see
A2.3.8.1) multiplied by the ratio of the angle of swing of the
pendulum from the latch to the energy value being evaluated to
the angle of swing of the pendulum from the latch to the zero
energy reading. Subtract the sum of the residual energy and
proportional frictional and windage loss from the potential
energy at the latched position (see A2.3.5). The indicator shall
agree with the energy calculated within the limits of A1.2.1.
Make similar calculations at other points of the scale. The
FIG. A2.1 Dimensions for Calculations
v 5 =2 gh
(A2.3)
where:
v = velocity, m/s (ft/s),
g = acceleration of gravity, 9.81 m/s2 (32.2 ft/s2), and
h = initial elevation of the striker, m (ft).
A2.3.7 The center of percussion shall be at a point within
1 % of the distance from the axis of rotation to the center of
strike in the specimen, to ensure that minimum force is
transmitted to the point of rotation. Determine the location of
the center of percussion as follows:
A2.3.7.1 Using a stop watch or some other suitable timemeasuring device, capable of measuring time to within 0.2 s,
swing the pendulum through a total angle not greater than 15°
and record the time for 100 complete cycles (to and fro). The
period of the pendulum then, is the time for 100 cycles divided
by 100.
A2.3.7.2 Determine the center of percussion by means of
the following equation:
L5
gp2
4p2
(A2.4)
15
E23 – 07a´1
indicating mechanism shall not overshoot or drop back with the
pendulum. Make test swings from various heights to check
visually the operation of the pointer over several portions of the
scale.
usually not a change in the last digit shown on the display because
resolution is a function of the angular position of the pendulum and
changes throughout the swing. For devices which incorporate a verification mode in which a live readout of absorbed energy is available, the
pendulum may be moved slowly in the area of 15 J to observe the smallest
change in the readout device (the resolution).
NOTE A2.4—Indicators that indicate in degrees shall be checked using
the above procedure. Degree readings from the scale shall be converted to
energy readings using the conversion formula or table normally used in
testing. In this way the formula or table can also be checked for windage
and friction corrections.
A2.4.3.2 The upper limit of the usable range of the machine
is equal to 80 % of the capacity of the machine.
A2.4.4 Only verification specimens that are within the
usable range of the impact machine shall be tested. To verify
the machine over its full usable range, test the lowest and
highest energy levels of verification specimens commercially
available that are within the machines’ usable range. If the ratio
of the highest and lowest certified values tested is greater than
four, testing of a third set of intermediate energy specimens is
required (if the specimens are commercially available).
A2.4 Indirect Verification:
A2.4.1 Indirect verification requires the testing of specimens with certified values to verify the accuracy of Charpy
impact machines.
A2.4.1.1 Verification specimens with certified values are
produced at low (13 to 20 J), high (88 to 136 J), and super-high
(176 to 244 J) energy levels. To meet the verification requirements, the average value determined for a set of verification
specimens at each energy level tested shall correspond to the
certified values of the verification specimens within 1.4 J (1.0
ft·lbf) or 5.0 %, whichever is greater.
A2.4.1.2 Other sources of verification specimens7 may be
used provided their reference value has been established on the
three reference machines owned, maintained, and operated by
NIST in Boulder, CO.
A2.4.2 The verified range of a Charpy impact machine is
described with reference to the lowest and highest energy
specimens tested on the machine. These values are determined
from tests on sets of verification specimens at two or more
levels of absorbed energy, except in the case where a Charpy
machine has a maximum capacity that is too low for two
energy levels to be tested. In this case, one level of absorbed
energy can be used for indirect verification.
A2.4.3 Determine the usable range of the impact testing
machine prior to testing verification specimens. The usable
range of an impact machine is dependent upon the resolution of
the scale or readout device at the low end and the capacity of
the machine at the high end.
A2.4.3.1 The resolution of the scale or readout device
establishes the lower limit of the usable range for the machine.
The lower limit is equal to 25 times the resolution of the scale
or readout device at 15 J (11 ft-lbf).
NOTE A2.7—Use the upper bound of the energy range given for the
low, high, and super-high verification specimens (20, 136, and 245 J
respectively) to determine the highest energy level verification specimens
that can be tested. Alternately, use the lower bound of the energy range
given for the verification specimens to determine the minimum energy
level for testing.
A2.4.4.1 If the low energy verification specimens were not
tested (tested only high and super-high), the lower limit of the
verified range shall be one half the energy of the lowest energy
verification set tested.
NOTE A2.8—For example, if the certified value of the high energy
specimens tested was 100 J, the lower limit would be 50 J.
A2.4.4.2 If the highest energy verification specimens available for a given Charpy machine capacity have not been tested,
the upper value of the verified range shall be 1.5 times the
certified value of the highest energy specimens tested.
NOTE A2.9—For example, if the machine being tested has a maximum
capacity of 325 J (240 ft-lbf) and only low and high energy verification
specimens were tested, the upper bound of the verified range would be 150
J (100 J * 1.5 = 150 J), assuming that the high energy samples tested had
a certified value of 100 J. To verify this machine over its full range, low,
high, and super-high verification specimens would have to be tested,
because super-high verification specimens can be tested on a machine with
a 325 J capacity (80 % of 325 J is 260 J, and the certified value of
super-high specimens never exceed 260 J). See Table A2.1.
TABLE A2.1 Verified Ranges for Various Machine Capacities
and Verification Specimens TestedA
NOTE A2.5—On analog scales, the resolution is the smallest change in
energy that can be discerned on the scale. This is usually 1⁄4 to 1⁄5 of the
difference between 2 adjacent marks on the scale at the 15 J (11 ft-lbf)
energy level.
NOTE A2.6—Digital readouts usually incorporate devices, such as
digital encoders, with a fixed discrete angular resolution. The resolution of
these types of readout devices is the smallest change in energy that can be
consistently measured at 15 J. The resolution of these types of devices is
Machine
Resolution
Capacity
J
J
80
160
325
400
400
400
7
Some sources for verification specimens maybe listed in the ASTM International Equipment Directory, www.astm.org.
0.10
0.20
0.25
0.30
0.15
0.15
Verification Specimens
Tested
Usable
Range
J
Low
High
Super-high
Verified
Range
J
2.5 to 64
5.0 to 128
6.25 to 260
7.5 to 320
3.75 to 320
3.75 to 320
X
X
X
...
X
X
...
X
X
X
X
X
...
...
X
X
...
X
2.5 to 64
5.0 to 128
6.25 to 260
50 to 320
3.75 to 150
3.75 to 320
A
In these examples, the high energy verification specimens are assumed to
have a certified value of 100 J.
16
E23 – 07a´1
A3. ADDITIONAL IMPACT TEST SPECIMEN CONFIGURATIONS
These are shown as Specimens X, Y, and Z in Figs. A3.2 and
A3.3. Specimen Z is sometimes called the Philpot specimen,
after the name of the original designer. For hard materials, the
machining of the flat surface struck by the pendulum is
sometimes omitted. Types Y and Z require a different vise from
that shown in Fig. A1.3, each half of the vise having a
semi-cylindrical recess that closely fits the clamped portion of
the specimen. As previously stated, the results cannot be
reliably compared with those obtained using specimens of
other sizes or shapes.
A3.1 Sub-Size Specimen—When the amount of material
available does not permit making the standard impact test
specimens shown in Figs. 1 and 2, smaller specimens may be
used, but the results obtained on different sizes of specimens
cannot be compared directly (X1.3). When Charpy specimens
other than the standard are necessary or specified, it is
recommended that they be selected from Fig. A3.1.
A3.2 Supplementary Specimens—For economy in preparation of test specimens, special specimens of round or rectangular cross section are sometimes used for cantilever beam test.
On sub-size specimens the length, notch angle, and notch radius are constant (see Fig. 1); depth (D), notch depth (N), and width (W) vary as indicated below.
NOTE 1—Circled specimen is the standard specimen (see Fig. 1).
NOTE 2—Permissible variations shall be as follows:
Cross-section dimensions
Radius of notch
Ligament length
Finish requirements
61 % or 60.075 mm, whichever is smaller
60.025 mm
60.025 mm
2 µm on notched surface and opposite face; 4 µm on other two surfaces
FIG. A3.1 Non-Standard Charpy (Simple-Beam) (Type A) Impact Test Specimens
17
E23 – 07a´1
NOTE 1—Permissible variations for type X specimens shall be as follows:
Notch length to edge
Adjacent sides shall be at
Ligament length of Type X specimen
906 2°
90°6 10 min
60.025 mm
NOTE 2—Permissible variations for both specimens shall be as follows:
Cross-section dimensions
Lengthwise dimensions
Angle of notch
Radius of notch
Notch diameter of Type Y specimen
60.025 mm
+0, −2.5 mm
61°
60.025 mm
60.025 mm
FIG. A3.2 Izod (Cantilever-Beam) Impact Test Specimens, Types X and Y
The flat shall be parallel to the longitudinal centerline of the specimen and shall be parallel to the bottom of the notch within 2:1000.
TYPE Z
NOTE 1—Permissible variations shall be as follows:
Notch length to longitudinal centerline
Cross-section dimensions
Length of specimen
Angle of notch
Radius of notch
Notch depth
906 2°
60.025 mm
+0, −2.5 mm
61°
60.025 mm
60.025 mm
FIG. A3.3 Izod (Cantilever-Beam) Impact Test Specimen (Philpot), Type Z
18
E23 – 07a´1
A4. PRECRACKING CHARPY V-NOTCH IMPACT SPECIMENS
stress distribution shall also be symmetrical about the plane of
the prospective crack; otherwise the crack will deviate unduly
from that plane and the test result will be significantly affected.
A4.3.2 The recommended fixture to be used is shown in Fig.
A4.1. The nominal span between support rollers shall be 4 D 6
0.2 D, where D is the depth of the specimen. The diameter of
the rollers shall be between D/2 and D. The radius of the ram
shall be between D/8 and D. This fixture is designed to
minimize frictional effects by allowing the support rollers to
rotate and move apart slightly as the specimen is loaded, thus
permitting rolling contact. The rollers are initially positioned
against stops that set the span length and are held in place by
low-tension springs (such as rubber bands). Fixtures, rolls, and
ram should be made of high hardness (greater than 40 HRC)
steels.
A4.1 Scope
A4.1.1 This annex describes the procedure for the fatigue
precracking of standard Charpy V-notch (CVN) impact specimens. The annex provides information on applications of
precracked Charpy impact testing and fatigue-precracking
procedures.
A4.2 Significance and Use
A4.2.1 Section 4 also applies to precracked Charpy V-notch
impact specimens.
A4.2.2 It has been found that fatigue-precracked CVN
specimens generally result in better correlations with other
impact toughness tests such as Test Method E604 and with
fracture toughness tests such as Test Method E399 than the
standard V-notch specimens (3,4,5,6,7,8). Also, the sharper
notch yields more conservative estimations of the notched
impact toughness and the transition temperature of the material
(9,10).
A4.4 Test Specimens
A4.4.1 The dimensions of the precracked Charpy specimen
are essentially those of type-A shown in Fig. 1. The notch
depth plus the fatigue crack extension length shall be designated as N as shown in Fig. A4.2. When the amount of material
available does not permit making the standard impact test
specimen, smaller specimens may be made by reducing the
A4.3 Apparatus
A4.3.1 The equipment for fatigue cracking shall be such
that the stress distribution is symmetrical through the specimen
thickness; otherwise, the crack will not grow uniformly. The
FIG. A4.1 Fatigue Precracking-Fixture Design
19
E23 – 07a´1
FIG. A4.2 Charpy (Simple-Beam, type A) Impact Test Specimen
for the material that will ensure an acceptable plastic-zone size
at the crack tip. It is also advisable to check this maximum load
to ensure that it is below the limit load for the material using
Eq A4.2. When the most advanced crack trace has almost
reached the first scribed line corresponding to approximately
two-thirds of the final crack length, reduce the maximum load
so that 0.6 Kmax is not exceeded.
A4.5.3 Fatigue cycling is begun, usually with a sinusoidal
waveform and near to the highest practical frequency. There is
no known marked frequency effect on fatigue precrack formation up to at least 100 Hz in the absence of adverse environments; however, frequencies of 15 to 30 Hz are typically used.
Carefully monitor the crack growth optically. A low-power
magnifying glass is useful in this regard. If crack growth is not
observed on one side when appreciable growth is observed on
the first, stop fatigue cycling to determine the cause and
remedy for the behavior. Simply turning the specimen around
in relation to the fixture will often solve the problem. When the
most advanced crack trace has reached the halfway mark, turn
the specimen around in relation to the fixture and complete the
fatigue cycling. Continue fatigue cycling until the surface
traces on both sides of the specimen indicate that the desired
overall length of notch plus crack is reached. The fatigue crack
should extend at least 1 mm beyond the tip of the V-notch but
no more than 3 mm. A fatigue crack extension of approximately 2 mm is recommended.
A4.5.4 When fatigue cracking is conducted at a temperature
T1 and testing will be conducted at a different temperature T2,
and T1 > T2, the maximum stress intensity must not exceed
60 % of the K max of the material at temperature T 1 multiplied
by the ratio of the yield stresses of the material at the
temperatures T1 and T2, respectively. Control of the plasticzone size during fatigue cracking is important when the fatigue
cracking is done at room temperature and the test is conducted
at lower temperatures. In this case, the maximum stress
intensity at room temperature must be kept to low values so
that the plastic-zone size corresponding to the maximum stress
intensity at low temperatures is smaller.
width; but the results obtained on different sizes of specimens
cannot be compared directly (see X1.3).
A4.4.2 The fatigue precracking is to be done with the
material in the same heat-treated condition as that in which it
will be impact tested. No intermediate treatments between
fatigue precracking and testing are allowed.
A4.4.3 Because of the relatively blunt machined V-notch in
the Charpy impact specimen, fatigue crack initiation can be
difficult. Early crack initiation can be promoted by pressing or
milling a sharper radius into the V-notch. Care must be taken to
ensure that excessive deformation at the crack tip is avoided.
A4.4.4 It is advisable to mark two pencil lines on each side
of the specimen normal to the anticipated paths of the surface
traces of the fatigue crack. The first line should indicate the
point at which approximately two-thirds of the crack extension
has been accomplished. At this point, the stress intensity
applied to the specimen should be reduced. The second line
should indicate the point of maximum crack extension. At this
point, fatigue precracking should be terminated.
A4.5 Fatigue Precracking Procedure
A4.5.1 Set up the test fixture so that the line of action of the
applied load shall pass midway between the support roll center
within 1 mm. Measure the span to within 1 % of the nominal
length. Locate the specimen with the crack tip midway
between the rolls within 1 mm of the span, and square to the
roll axes within 2°.
A4.5.2 Select the initial loads used during precracking so
that the remaining ligament remains undamaged by excessive
plasticity. If the load cycle is maintained constant, the maximum K (stress intensity) and the K range will increase with
crack length; care must be taken to ensure that the maximum K
value is not exceeded to prevent excessive plastic deformation
at the crack tip. This is done by continually shedding the load
as the fatigue crack extends. The maximum load to be used at
any instant can be calculated from Eq A4.1 and A4.2 while the
minimum load should be kept at 10 % of the maximum. Eq
A4.1 relates the maximum load to a stress intensity (K) value
20
E23 – 07a´1
TABLE A4.1 Calculations of f(N/D)
A4.6 Calculation
A4.6.1 Specimens shall be precracked in fatigue at load
values that will not exceed a maximum stress intensity, Kmax.
or three-point bend specimens use:
Pmax 5 [K max*W*D3/2# / [S*f ~N/D!#
(A4.1)
where:
P max
Kmax
= maximum load to be applied during precracking,
= maximum stress intensity = sys* (2*p* ry)1/2,
where r y = is the radius of the induced plastic
zone size which should be less than or equal to
0.5 mm,
D
= specimen depth,
W
= specimen width,
S
= span, and
f (N/D) = geometrical factor (see Table A4.1).
A4.6.2 See the appropriate section of Test Method E399 for
the f (N/D) calculation. Table A4.1 contains calculated values
for f (N/D) for CVN precracking. Eq A4.2 should be used to
ensure that the loads used in fatigue cracking are well below
the calculated limit load for the material.
PL 5 ~4/3! * [D* ~D – N!2*sys#/S
(A4.2)
where:
P L = limit load for the material.
A4.7 Crack Length Measurement
A4.7.1 After fracture, measure the initial notch plus fatigue
crack length, N, to the nearest 1 % at the following three
positions: at the center of the crack front and midway between
the center and the intersection of the crack front with the
specimen surfaces. Use the average of these three measurements as the crack length.
A4.7.2 If the difference between any two of the crack length
measurements exceeds 10 % of the average, or if part of the
crack front is closer to the machine notch root than 5 % of the
average, the specimen should be discarded. Also, if the length
of either surface trace of the crack is less than 80 % of the
average crack length, the specimen should be discarded.
N
(mm)
D
(mm)
N/D
f(N/D)
2.00
2.10
2.20
2.30
2.40
2.50
2.60
2.70
2.80
2.90
3.00
3.10
3.20
3.30
3.40
3.50
3.60
3.70
3.80
3.90
4.00
4.10
4.20
4.30
4.40
4.50
4.60
4.70
4.80
4.90
5.00
10.00
10.00
10.00
10.00
10.00
10.00
10.00
10.00
10.00
10.00
10.00
10.00
10.00
10.00
10.00
10.00
10.00
10.00
10.00
10.00
10.00
10.00
10.00
10.00
10.00
10.00
10.00
10.00
10.00
10.00
10.00
0.20
0.21
0.22
0.23
0.24
0.25
0.26
0.27
0.28
0.29
0.30
0.31
0.32
0.33
0.34
0.35
0.36
0.37
0.38
0.39
0.40
0.41
0.42
0.43
0.44
0.45
0.46
0.47
0.48
0.49
0.50
1.17
1.21
1.24
1.27
1.31
1.34
1.37
1.41
1.45
1.48
1.52
1.56
1.60
1.64
1.69
1.73
1.78
1.83
1.88
1.93
1.98
2.04
2.10
2.16
2.22
2.29
2.35
2.43
2.50
2.58
2.66
test temperatures, and energy absorption. Report the average
precrack length in addition to these Test Method E23 requirements.
A4.8.2 The following information may be provided as
supplementary information: lateral expansion, fracture appearance, and also, it would probably be useful to report energy
absorption normalized in some manner.
A4.8 Report
A4.8.1 Report the following information for each specimen
tested: type of specimen used (and size if not the standard size),
A5. SPECIMEN ORIENTATION
A5.1.4 Specimens parallel to the surface of wrought products, processed with the same degree of homogenous deformation along the L- and T axies may be called T specimens.
A5.1.5 Specimens normal to the uniform grain flow of
wrought products (or grain growth in cast products), whose
grain flow is exclusively in one direction, so that T- and S
specimens are equivalent, may be called S specimens.
A5.1 Designation of Specimen Axis:
A5.1.1 The L-axis is coincident with the main direction of
grain flow due to processing. This axis is usually referred to as
the longitudinal direction (see Fig. A5.1, Fig. A5.2, and Fig.
A5.3).
A5.1.2 The S-axis is coincident with the direction of the
main working force. This axis is usually referred to as the
short-transverse-direction.
A5.1.3 The T-axis is normal to the L- and S-axies. This axis
is usually referred to as the transverse direction.
A5.2 Designation of Notch Orientation:
21
E23 – 07a´1
A5.2.1 The notch orientation is designated by the direction
in which fracture propagates. This letter is separated from the
specimen-axis designation by a hyphen. In unique cases (Fig.
A5.3), when fracture propagates across two planes, two letters
are required to designate notch orientation.
FIG. A5.1 Fracture Planes Along Principal Axes
FIG. A5.2 Fracture Planes—Cylindrical Sections
FIG. A5.3 Fracture Planes not Along Principal Axes
A6. DETERMINATION OF THE PROPORTION OF SHEAR FRACTURE SURFACE
A6.1 These fracture-appearance methods are based on the
concept that 100% shear (ductile) fracture occurs above the
transition-temperature range and cleavage (brittle) fracture
occurs below the range. This concept appears to be appropriate,
at least for body-centered-cubic iron-based alloys that undergo
a distinct ductile to brittle transition, but interpretation is
complicated in materials that exhibit mixed mode fracture
during unstable crack growth. In the transition-temperature
range, fracture is initiated at the root of the notch by fibrous
tearing. A short distance from the notch, unstable crack growth
occurs as the fracture mechanism changes to cleavage or mixed
mode mechanism, which often results in distinct radial markings in the central portion of the specimen (indicative of fast,
unstable fracture). After several microseconds the unstable
crack growth arrests. Final fracture occurs at the remaining
ligament and at the sides of the specimen in a ductile manner.
22
E23 – 07a´1
As shear-lips are formed at the sides of the specimen, the
plastic hinge at the remaining ligament ruptures. In the ideal
case, a “picture frame” of fibrous (ductile) fracture surrounds a
relatively flat area of cleavage (brittle) fracture.
The five methods used below may be used to determine the
percentage of ductile fracture on the surface of impact specimens. It is recommended that the user qualitatively characterize the fracture mode of the flat fracture zone, and provide a
description of how the shear measurements were made. The
accuracy of the methods are grouped in order of increasing
precision. In the case where a specimen does not separate into
two halves during the impact test and the fracture occurs
without any evidence of cleavage (brittle) fracture, the percent
shear fracture can be considered to be 100% and the specimen
should be reported as unbroken.
method A6.1.4), (2) the error using method A6.1.2 was random and, (3)
The typical variation in independent measurements using method A6.1.4
was on the order of 5 to 10 % for microalloyed 1040 steels.
A6.1.1 Measure the length and width of the flat fracture
region of the fracture surface, as shown in Fig. 10, and
determine the percent shear from either Table A6.1 or Table
A6.2 depending on the units of measurement.
A6.1.2 Compare the appearance of the fracture of the
specimen with a fracture appearance chart such as that shown
in Fig. A6.1.
A6.1.3 Magnify the fracture surface and compare it to a
precalibrated overlay chart or measure the percent shear
fracture by means of a planimeter.
A6.1.4 Photograph the fracture surface at a suitable magnification and measure the percent shear fracture by means of a
planimeter.
A6.1.5 Capture a digital image of the fracture surface and
measure the percent shear fracture using image analysis
software.
NOTE A6.1—Round robin data (five U.S. companies, 1990) estimates
of the percent shear for five quenched and tempered 8219 steels and four
microalloyed 1040 steels indicated the following: (1) results using method
A6.1.1 systematically underestimated the percent shear (compared with
TABLE A6.1 Percent Shear for Measurements Made in Millimetres
NOTE 1—100 % shear is to be reported when either A or B is zero.
Dimension A, mm
Dimension
B, mm
1.0
1.5
2.0
2.5
3.0
3.5
4.0
4.5
5.0
5.5
6.0
6.5
7.0
7.5
8.0
8.5
9.0
9.5
10
1.0
1.5
2.0
2.5
3.0
3.5
4.0
4.5
5.0
5.5
6.0
6.5
7.0
7.5
8.0
99
98
98
97
96
96
95
94
94
93
92
92
91
91
90
98
97
96
95
94
93
92
92
91
90
89
88
87
86
85
98
96
95
94
92
91
90
89
88
86
85
84
82
81
80
97
95
94
92
91
89
88
86
85
83
81
80
78
77
75
96
94
92
91
89
87
85
83
81
79
77
76
74
72
70
96
93
91
89
87
85
82
80
78
76
74
72
69
67
65
95
92
90
88
85
82
80
77
75
72
70
67
65
62
60
94
92
89
86
83
80
77
75
72
69
66
63
61
58
55
94
91
88
84
81
78
75
72
69
66
62
59
56
53
50
93
90
86
83
79
76
72
69
66
62
59
55
52
48
45
92
89
85
81
77
74
70
66
62
59
55
51
47
44
40
92
88
84
80
76
72
67
63
59
55
51
47
43
39
35
91
87
82
78
74
69
65
61
56
52
47
43
39
34
30
91
86
81
77
72
67
62
58
53
48
44
39
34
30
25
90
85
80
75
70
65
60
55
50
45
40
35
30
25
20
89
84
79
73
68
63
57
52
47
42
36
31
26
20
15
89
83
77
72
66
61
55
49
44
38
33
27
21
16
10
88
82
76
70
64
58
52
46
41
35
29
23
17
11
5
88
81
75
69
62
56
50
44
37
31
25
19
12
6
0
23
E23 – 07a´1
TABLE A6.2 Percent Shear for Measurements Made in Inches
NOTE 1—100 % shear is to be reported when either A or B is zero.
Dimension A, in.
Dimension
B, in.
0.05
0.10
0.12
0.14
0.16
0.18
0.20
0.22
0.24
0.26
0.28
0.30
0.32
0.34
0.36
0.38
0.40
0.05
0.10
0.12
0.14
0.16
0.18
0.20
0.22
0.24
0.26
0.28
0.30
0.31
98
96
95
94
94
93
92
91
90
90
89
88
88
96
92
90
89
87
85
84
82
81
79
77
76
75
95
90
88
86
85
83
81
79
77
75
73
71
70
94
89
86
84
82
80
77
75
73
71
68
66
65
94
87
85
82
79
77
74
72
69
67
64
61
60
93
85
83
80
77
74
72
68
65
62
59
56
55
92
84
81
77
74
72
68
65
61
58
55
52
50
91
82
79
75
72
68
65
61
57
54
50
47
45
90
81
77
73
69
65
61
57
54
50
46
42
40
90
79
75
71
67
62
58
54
50
46
41
37
35
89
77
73
68
64
59
55
50
46
41
37
32
30
88
76
71
66
61
56
52
47
42
37
32
27
25
87
74
69
64
59
54
48
43
38
33
28
23
20
86
73
67
62
56
51
45
40
34
29
23
18
18
85
71
65
59
53
48
42
36
30
25
18
13
10
85
69
63
57
51
45
39
33
27
20
14
9
5
84
68
61
55
48
42
36
29
23
16
10
3
0
(a) Fracture Appearance Charts and Percent Shear Fracture Comparator
(b) Guide for Estimating Fracture Appearance
FIG. A6.1 Fracture Appearance
24
E23 – 07a´1
APPENDIXES
(Nonmandatory Information)
X1. NOTES ON SIGNIFICANCE OF NOTCHED-BAR IMPACT TESTING
which it initiates a sudden and complete failure of the brittle
type. Some metals can be deformed in a ductile manner even
down to very low temperatures, while others may crack. This
difference in behavior can be best understood by considering
the cohesive strength of a material (or the property that holds
it together) and its relation to the yield point. In cases of brittle
fracture, the cohesive strength is exceeded before significant
plastic deformation occurs and the fracture appears crystalline.
In cases of the ductile or shear type of failure, considerable
deformation precedes the final fracture and the broken surface
appears fibrous instead of crystalline. In intermediate cases, the
fracture comes after a moderate amount of deformation and is
part crystalline and part fibrous in appearance.
X1.2.2 When a notched bar is loaded, there is a normal
stress across the base of the notch which tends to initiate
fracture. The property that keeps it from cleaving, or holds it
together, is the “cohesive strength”. The bar fractures when the
normal stress exceeds the cohesive strength. When this occurs
without the bar deforming it is the condition for brittle fracture.
X1.2.3 In testing, though not in service because of side
effects, it happens more commonly that plastic deformation
precedes fracture. In addition to the normal stress, the applied
load also sets up shear stresses which are about 45° to the
normal stress. The elastic behavior terminates as soon as the
shear stress exceeds the shear strength of the material and
deformation or plastic yielding sets in. This is the condition for
ductile failure.
X1.2.4 This behavior, whether brittle or ductile, depends on
whether the normal stress exceeds the cohesive strength before
the shear stress exceeds the shear strength. Several important
facts of notch behavior follow from this. If the notch is made
sharper or more drastic, the normal stress at the root of the
notch will be increased in relation to the shear stress and the
bar will be more prone to brittle fracture (see Table X1.1).
Also, as the speed of deformation increases, the shear strength
increases and the likelihood of brittle fracture increases. On the
other hand, by raising the temperature, leaving the notch and
X1.1 Notch Behavior:
X1.1.1 The Charpy V-notch (CVN) impact test has been
used extensively in mechanical testing of steel products, in
research, and in procurement specifications for over three
decades. Where correlations with fracture mechanics parameters are available, it is possible to specify CVN toughness
values that would ensure elastic-plastic or plastic behavior for
fracture of fatigue cracked specimens subjected to minimum
operating temperatures and maximum in service rates of
loading.
X1.1.2 The notch behavior of the face-centered cubic metals and alloys, a large group of nonferrous materials and the
austenitic steels can be judged from their common tensile
properties. If they are brittle in tension, they will be brittle
when notched, while if they are ductile in tension they will be
ductile when notched, except for unusually sharp or deep
notches (much more severe than the standard Charpy or Izod
specimens). Even low temperatures do not alter this characteristic of these materials. In contrast, the behavior of the ferritic
steels under notch conditions cannot be predicted from their
properties as revealed by the tension test. For the study of these
materials the Charpy and Izod type tests are accordingly very
useful. Some metals that display normal ductility in the tension
test may nevertheless break in brittle fashion when tested or
when used in the notched condition. Notched conditions
include constraints to deformation in directions perpendicular
to the major stress, or multi axial stresses, and stress concentrations. It is in this field that the Charpy and Izod tests prove
useful for determining the susceptibility of a steel to notchbrittle behavior though they cannot be directly used to appraise
the serviceability of a structure.
X1.2 Notch Effect:
X1.2.1 The notch results in a combination of multi axial
stresses associated with restraints to deformation in directions
perpendicular to the major stress, and a stress concentration at
the base of the notch. A severely notched condition is generally
not desirable, and it becomes of real concern in those cases in
TABLE X1.1 Effect of Varying Notch Dimensions on Standard Specimens
High-Energy
Specimens, J (ft·lbf)
Specimen with standard dimensions
Depth of notch, 2.13 mm (0.084 in.)A
Depth of notch, 2.04 mm (0.0805 in.)A
Depth of notch, 1.97 mm (0.0775 in.)A
Depth of notch, 1.88 mm (0.074 in.)A
Radius at base of notch 0.13 mm (0.005
in.)B
Radius at base of notch 0.38 mm (0.015
in.)B
103.0
3.8)
97.9
101.8
104.1
107.9
98.0
6 5.2 (76.0 6
(72.2)
(75.1)
(76.8)
(79.6)
(72.3)
108.5 (80.0)
Medium-Energy
Specimens, J (ft·lbf)
60.3
2.2)
56.0
57.2
61.4
62.4
56.5
6 3.0 (44.5 6
(41.3)
(42.2)
(45.3)
(46.0)
(41.7)
64.3 (47.4)
A
Standard 2.0 6 0.025 mm (0.079 6 0.001 in.).
Standard 0.25 6 0.025 mm (0.010 6 0.001 in.).
B
25
Low-Energy
Specimens, J (ft·lbf)
16.9
1.0)
15.5
16.8
17.2
17.4
14.6
6 1.4 (12.5 6
(11.4)
(12.4)
(12.7)
(12.8)
(10.8)
21.4 (15.8)


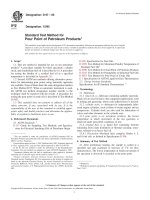
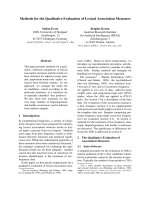
![Standard Test Method for Compressive Strength of Hydraulic Cement Mortars (Using 2-in. or [50-mm] Cube Specimens)](https://media.store123doc.com/images/document/14/rc/yi/medium_yil1395845738.jpg)