TUYỂN tập cái bài THI HSG BAR CHARTS GRAPHS TABLES ôn THI HSG
Bạn đang xem bản rút gọn của tài liệu. Xem và tải ngay bản đầy đủ của tài liệu tại đây (552.41 KB, 20 trang )
TUYỂN TẬP :
MỘT SỐ DẠNG BÀI VỀ GRAPHS,BAR CHARTS,PIE CHARTS ,TABLES.
Biên soạn:Phạm Trung Kiên.
(Sinh viên nghành Ngôn ngữ Anh )
I.Quy tắc “Vàng” khi làm bài.
1.Phân bố thời gian làm bài hợp lí:
+ 2-3 phút phân tích đề và vạch ý tưởng
+ 10 phút để viết bài.
+ 2-3 phút để kiểm tra lại bài làm
2. Kiểm tra kĩ càng số liệu trong bài.
3.Viết ít nhất là 150 từ.( Khoảng 15 dòng)
4.So sánh,đối chiếu với thông tin trong bảng biểu,không nên chỉ tập trung vào một
ý.
5.Nếu có nhiều hơn một biểu đồ hoặc kết hợp với các dang biểu đồ khác.Kết hợp
thông tin các biểu đồ lại.
6. Chắc chắn bài viết gồm ba phần: 1 đoạn mở bài, 1-2 đoạn văn thân bài và 1 đoạn
kết luận.
II.Cách viết bài của từng dạng.
1.Graphs.
*Một vài gợi ý cho viết mở bài:
- The graph shows/illustrates the trends in….. between… and….
-The graph shows/illustrates how the sales have differed/changed….
- The graph gives/provides/reveals/presents information about (the
differences/changes….)
*Dùng một số từ đồng nghĩa:
+rise (v): climb,go up,increase,improve,jump,leap,move upward…..
+ rise (n): increase, climb, surge (in), leap…
+fall (v): collapse, decline, decrease , deteriorate, dip, dive, fall (back), plummet...
+ fall (n): decline,dip, deterioration…
+ fluctuate (noun: fluctuation): be erratic, be fitful, vary, rise,..
+ flat: no change, constant….
*Thêm một số trạng từ phù hợp: dramatically (đột ngột) , erratically (thất thường)
,gradually (dần dần), slowly (chậm) , steadily (nhanh chóng),…
*Cụm từ chỉ thời gian:
-between…and…
-from….to…..
-at…/by…./in….
-over the latter half of the year/century/decade/period.
-over the next past/previous fived day/weeks/months/years/decades.
* So sánh và đối chiếu.
-So sánh sử dụng với từ: + …increased more than….
+ there was a greater increase in… than..
-Sử dụng liên từ:while/whilst/whereas/but
-Sử dụng từ nối:however/in contrast/by comparison/meanwhile/on the other hand..
* Dự báo-Tiên đoán:
-It is predicted/forecast(ed)/estimated/expected that….will……
-…will….
-…will have….by…
-…. is/are set to
*Dùng thì hiện tại hoàn thành để nói về sự việc xảy ra trong quá khứ cho tới hiện
tại: …has risen,etc.
*Viết kết bài:Chỉ cần 1 câu.Sử dụng một số cụm từ dưới đây:
Generally,…; Generally speaking…; All in all…. ; On average….; Overall…..
2.Bar charts:
* Nên sử dụng cả thì quá khứ đơn hoặc thì hiện tại đơn để miêu tả dữ liệu.
*Cố gắng tổng hợp dữ liệu và nhóm chúng lại hơn là viết riêng lẻ từng cái một
The (factors) can be divided into main groups…
-Đặt tên nhóm:… namely those related to….and those (connected) with….
- So sánh hai nhóm:… of the two,the former is the larger.
-Chỉ lấy ra những ý quan trọng trong nhóm: with…being the most popular with 40
per cent.
*Một số cụm từ dùng cho so sánh/đối chiếu:
- more/less than…
-(bigger) than….
- (not) as big as..
-twice as big/much as….
-rather than….
* Để trích dẫn nội dung của cuộc khảo sát.Ta dùng mẫu câu sau:
- ….. percent quoted/cited/considered… as important…
-…. ame top/bottom/second/next,followed by…at…and…respectively
3.Pie charts
*Bước 1: tìm ra những yếu tố KHÔNG thay đổi. (đưa vào thân bài đoạn 1)
*Bước 2: tìm ra các yếu tố thay đổi (đưa vào thân bài đoạn thứ 2)
*Nếu đề bài cho cả hai dạng là pie chart và graph hoặc pie chart và bar chart.Liên
hệ thông tin giữa cả hai và liên kết lại.
4.Tables.
Bước 1:Cấu trúc của bài viết nên được chia thành gồm mở bài, thân bài và kết
bài.
Bước 2:Trước khi bắt đầu viết, nên gạch chân và tìm ra một vài con số ấn tượng
– key number. Chọn ra số lớn nhất và bé nhất trong mỗi loại trên bảng đồ trong
mỗi cột hoặc mỗi dòng. Nếu bảng đồ được hiển thị theo năm, nên tìm xu hướng
thay đổi lớn nhất trong 1 thời gian. Khi đó dạng bài “Table” tương tự giống bài
“Line Graph”.
Bước 3:Cấu trúc ngữ pháp thường được sử dụng là: các dạng so sánh (hơn nhất,
bằng, hoặc hơn). Chú ý về cách sử dụng thời thì trong bài viết. Nếu là biểu đồ
bảng biểu thị các năm trong quá khứ, phải sử dụng quá khứ đơn hay thông tin
của đề bài mang tính chất dự đoán thì phải sử dụng thì tương lai; nếu không nói
rõ thời gian thì sử dụng thì hiện tại đơn
Bước 4:Không nên miêu tả từng loại. từng đối tượng bởi giám khảo chấm thi
muốn nhìn thấy sự so sánh giữa các loại trong bài viết.
III.Một số dạng bài trong đề thi Học sinh giỏi các cấp.
Đề 1:
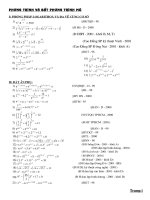
The bar graph below shows the amount of carbon emissions in different countries
during three different years. Summarize the information by selecting and reporting
the main features, and make comparisons where relevant.(150 – 200 words)
Carbon Emissions by Countries
(thousand metric tonnes)
1975
1990
2010
1600000
1400000
1200000
1000000
800000
600000
400000
200000
0
USA
Germany
UK
China
Canada
India
__________________________________________________________________
__________________________________________________________________
__________________________________________________________________
__________________________________________________________________
__________________________________________________________________
__________________________________________________________________
__________________________________________________________________
__________________________________________________________________
__________________________________________________________________
__________________________________________________________________
__________________________________________________________________
__________________________________________________________________
__________________________________________________________________
__________________________________________________________________
Đề 2:
The charts give information about two genres of TV programmes watched by men
and women and four different age groups in Australia.
Summarise the information by selecting and reporting the main features, and make
comparisons where relevant.
Write at least 150 words.
__________________________________________________________________
__________________________________________________________________
__________________________________________________________________
__________________________________________________________________
__________________________________________________________________
__________________________________________________________________
__________________________________________________________________
__________________________________________________________________
__________________________________________________________________
__________________________________________________________________
__________________________________________________________________
__________________________________________________________________
__________________________________________________________________
__________________________________________________________________
Đề 3:
The graph below shows the differences in wheat exports over three different areas.
Write a report for a university lecturer describing the information shown below.
Write at least 150 words.
__________________________________________________________________
__________________________________________________________________
__________________________________________________________________
__________________________________________________________________
__________________________________________________________________
__________________________________________________________________
__________________________________________________________________
__________________________________________________________________
__________________________________________________________________
__________________________________________________________________
__________________________________________________________________
__________________________________________________________________
__________________________________________________________________
__________________________________________________________________
Đề 4
The chart below shows information about Heart Attacks by Age and Gender in
USA. Summarize the information by selecting and reporting the main features, and
make comparisons where relevant. You should write at least 150 words.
__________________________________________________________________
__________________________________________________________________
__________________________________________________________________
__________________________________________________________________
__________________________________________________________________
__________________________________________________________________
__________________________________________________________________
__________________________________________________________________
__________________________________________________________________
__________________________________________________________________
__________________________________________________________________
__________________________________________________________________
__________________________________________________________________
__________________________________________________________________
Đề 5
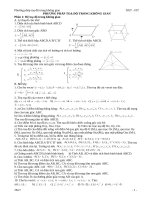
The bar chart below gives information about the percentage of the population
living in urban areas in different parts of the world. Summarise the information by
selecting and reporting the main features and make comparision where relevant.
100
89
90
90
84
76
80
70
66
62
60
1950
50
2007
40
2050
30
20
10
0
Africa
Asia
Europe
Latin America
North America
Oceania
__________________________________________________________________
__________________________________________________________________
__________________________________________________________________
__________________________________________________________________
__________________________________________________________________
__________________________________________________________________
__________________________________________________________________
__________________________________________________________________
__________________________________________________________________
__________________________________________________________________
__________________________________________________________________
__________________________________________________________________
__________________________________________________________________
__________________________________________________________________
Đề 6.
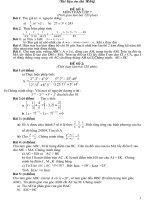
The chart below shows the amount of leisure time enjoyed by men and women of
different employment status.
Write a report describing the information shown below. (20 points)
You should write at least 150 words.
Leisure time in a typical week: by sex and employment status, 1998 - 1999
90
Hours of leisure time
80
70
60
50
Males
40
Females
30
20
10
0
Employed
full-time
Employed Unemployed
part- time
Retired
Housewives
__________________________________________________________________
__________________________________________________________________
__________________________________________________________________
__________________________________________________________________
__________________________________________________________________
__________________________________________________________________
__________________________________________________________________
__________________________________________________________________
__________________________________________________________________
__________________________________________________________________
__________________________________________________________________
__________________________________________________________________
__________________________________________________________________
__________________________________________________________________
Đề 7:
The charts give information about two genres of TV programmes watched by
men and women and four different age groups in Australia.
Summarise the information by selecting and reporting the main features, and
make comparisons where relevant.
Write at least 150 words.
__________________________________________________________________
__________________________________________________________________
__________________________________________________________________
__________________________________________________________________
__________________________________________________________________
__________________________________________________________________
__________________________________________________________________
__________________________________________________________________
__________________________________________________________________
__________________________________________________________________
__________________________________________________________________
__________________________________________________________________
__________________________________________________________________
__________________________________________________________________
Đề 8
The bar chart below gives information about the number of students studying
Computer Science at a UK university between 2010 and 2012.
Summarize the information by selecting and reporting the main features, and make
comparisons where relevant.
Write at least 150 words.
__________________________________________________________________
__________________________________________________________________
__________________________________________________________________
__________________________________________________________________
__________________________________________________________________
__________________________________________________________________
__________________________________________________________________
__________________________________________________________________
__________________________________________________________________
__________________________________________________________________
__________________________________________________________________
__________________________________________________________________
__________________________________________________________________
__________________________________________________________________
Đề 9:
The chart below shows UK and USA energy consumption in 2006.
Summarize the information by selecting and reporting the main features, and make
comparisons where relevant.
You should write at least 150 words.
_________________________________________________________________
__________________________________________________________________
__________________________________________________________________
__________________________________________________________________
__________________________________________________________________
__________________________________________________________________
__________________________________________________________________
__________________________________________________________________
__________________________________________________________________
__________________________________________________________________
__________________________________________________________________
__________________________________________________________________
__________________________________________________________________
__________________________________________________________________
__________________________________________________________________
Đề 10:
This graph below shows the immigration into the United States from 1861 to 2010.
Write a report (of 150 words) on the changes over the period of 150 years. You
may add comments and reasons to enliven your report.
_________________________________________________________________
__________________________________________________________________
__________________________________________________________________
__________________________________________________________________
__________________________________________________________________
__________________________________________________________________
__________________________________________________________________
__________________________________________________________________
__________________________________________________________________
__________________________________________________________________
__________________________________________________________________
__________________________________________________________________
__________________________________________________________________
__________________________________________________________________
__________________________________________________________________
******************************************************************
Tài liệu chỉ mang tính chất tham khảo.Học sinh nếu có đóng góp hoặc thắc mắc về
tài liệu này vui lòng liên hệ qua địa chỉ facebook: Bài tập Tiếng Anh Cho Học
Sinh Vùng Cao Việt Bắc.
Chúc các bạn đạt kết quả cao trong kì thi sắp tới!