chắc năng của không gian xanh
Bạn đang xem bản rút gọn của tài liệu. Xem và tải ngay bản đầy đủ của tài liệu tại đây (1.96 MB, 14 trang )
Richardson et al. BMC Public Health 2010, 10:240
/>
Open Access
RESEARCH ARTICLE
The association between green space and
cause-specific mortality in urban New Zealand: an
ecological analysis of green space utility
Research article
Elizabeth Richardson1, Jamie Pearce1, Richard Mitchell*2, Peter Day3 and Simon Kingham3
Abstract
Background: There is mounting international evidence that exposure to green environments is associated with health
benefits, including lower mortality rates. Consequently, it has been suggested that the uneven distribution of such
environments may contribute to health inequalities. Possible causative mechanisms behind the green space and
health relationship include the provision of physical activity opportunities, facilitation of social contact and the
restorative effects of nature. In the New Zealand context we investigated whether there was a socioeconomic gradient
in green space exposure and whether green space exposure was associated with cause-specific mortality
(cardiovascular disease and lung cancer). We subsequently asked what is the mechanism(s) by which green space
availability may influence mortality outcomes, by contrasting health associations for different types of green space.
Methods: This was an observational study on a population of 1,546,405 living in 1009 small urban areas in New
Zealand. A neighbourhood-level classification was developed to distinguish between usable (i.e., visitable) and nonusable green space (i.e., visible but not visitable) in the urban areas. Negative binomial regression models were fitted to
examine the association between quartiles of area-level green space availability and risk of mortality from
cardiovascular disease (n = 9,484; 1996 - 2005) and from lung cancer (n = 2,603; 1996 - 2005), after control for age, sex,
socio-economic deprivation, smoking, air pollution and population density.
Results: Deprived neighbourhoods were relatively disadvantaged in total green space availability (11% less total green
space for a one standard deviation increase in NZDep2001 deprivation score, p < 0.001), but had marginally more
usable green space (2% more for a one standard deviation increase in deprivation score, p = 0.002). No significant
associations between usable or total green space and mortality were observed after adjustment for confounders.
Conclusion: Contrary to expectations we found no evidence that green space influenced cardiovascular disease
mortality in New Zealand, suggesting that green space and health relationships may vary according to national,
societal or environmental context. Hence we were unable to infer the mechanism in the relationship. Our inability to
adjust for individual-level factors with a significant influence on cardiovascular disease and lung cancer mortality risk
(e.g., diet and alcohol consumption) will have limited the ability of the analyses to detect green space effects, if present.
Additionally, green space variation may have lesser relevance for health in New Zealand because green space is
generally more abundant and there is less social and spatial variation in its availability than found in other contexts.
Background
Whilst individual characteristics are undoubtedly an
important determinant of population health in an area,
research has found that the residential environment has a
significant independent influence on health outcomes [1].
* Correspondence:
2
Section of Public Health and Health Policy, Faculty of Medicine, University of
Glasgow, Glasgow, UK
A potentially important contextual factor that has
recently attracted interest is that of access to natural environments, or 'green space' [2]. Green environments are
associated with better self-perceived health [3-6], lower
blood pressure [7], lower levels of overweight and obesity
[8], lower levels of physician-assessed morbidity [9], as
well as lower mortality risks [10]. Evidence for these associations has been found in a number of countries: the
Full list of author information is available at the end of the article
© 2010 Richardson et al; licensee BioMed Central Ltd. This is an Open Access article distributed under the terms of the Creative Com-
BioMed Central mons Attribution License ( which permits unrestricted use, distribution, and reproduction in any medium, provided the original work is properly cited.
Richardson et al. BMC Public Health 2010, 10:240
/>
Netherlands [3,4], England [5], Australia [6], the USA [7],
Scotland [8], and Japan [11]. In New Zealand no association was found between access to parks and individuallevel BMI or physical activity levels [12] although the
relationship has not been investigated for other types of
green space or health outcomes.
Three key mechanisms have been proposed to explain
how green space might influence health [2]. First, green
space provides opportunities for physical activity (PA)
[13,14], and increased PA levels are associated with
reduced risks of physical and mental illnesses [15-17]. For
instance, enhanced physical activity explained the association between green space and physical health in Adelaide, Australia [6]. Second, green space may benefit
health by facilitating social contacts, for example through
providing opportunities to meet others or participate in
group activities [2,18]. Maas et al. [18] found that a lack of
social contact partly mediated the association between
low green space neighbourhoods and poor health in the
Netherlands. If physical activity promotion or facilitation
of social contact are key mechanisms in the relationship
we would expect health to be more strongly related to the
availability of green space that is usable (e.g., parks) than
to all green space in general.
Third, exposure to green space can promote recovery
from attention fatigue [19,20], and stress [21], and stress
has been implicated in the aetiology of common chronic
physical and mental illnesses [2,22]. These restorative
benefits have been reported for subjects with only visual
contact with green space [7,23], as well as those also having physical contact [7,24]. If these restorative psychosocial effects are the key mediators between green space
and health we would expect health to be related to total
green space availability, whether usable or not (e.g., agricultural land). Identifying whether health benefits are
more strongly associated with usable or total green space
will inform the causative mechanism debate and the
development of public health policies and intervention
strategies. Although creating a dichotomy between these
potential mechanisms makes a useful framework for
study it should be noted that they are not mutually exclusive. For instance, restorative and physical activity benefits may combine when exercising in green surroundings
[24].
There is concern that locational access to health-promoting community resources, such as green space, is
lower in socioeconomically deprived areas, and may be
contributing to widening geographical inequalities in
health [25]. There is some evidence that socioeconomically deprived communities have poorer green space
availability than more affluent areas [26,27], which may
partly explain the lower levels of physical activity in
deprived communities [28]. In New Zealand, however,
deprived communities in urban areas have better access
Page 2 of 14
to parks [29,30], but the socio-spatial patterning has not
been investigated for usable green space in general, or
total green space. Quantifying variations in usable and
total green space exposure may therefore assist in understanding and addressing health inequalities.
We conducted a New Zealand-based study to contribute to the evidence base on the association between green
space and health, and the underlying mechanisms that
may bring about this relationship. Much of the existing
evidence about green space and health has stemmed from
European nations, with relatively similar social, economic
and physical environments. We developed a novel and
accurate neighbourhood-level measure of green space for
urban areas of New Zealand, which differentiated
between usable and non-usable types. The classification
enabled us to address three research questions: (a) is
there a socioeconomic gradient in green space exposure;
(b) is there an association between green space availability and cause-specific mortality; and (c) what is the mechanism(s) by which green space availability may influence
mortality outcomes?
We purposefully selected two causes of mortality with
differing aetiologies: cardiovascular disease and lung cancer. Cardiovascular disease (CVD) is a leading cause of
death in New Zealand, and has certain risk factors (inactivity and stress) which might be partly ameliorated by
green space. Indeed, physical activity has been strongly
associated with a reduced risk of CVD mortality in many
studies [16]. Lung cancer (LC) is the most common cause
of cancer mortality in New Zealand, but smoking is the
main risk factor, and its relationship with physical activity
is, at best, small [31]. We therefore hypothesised that
CVD would be associated with green space whereas lung
cancer mortality would not.
Methods
Using a geographical information system (GIS) we developed a classification of green space for small areas across
New Zealand that distinguished between usable and nonusable areas. We calculated the percentage coverage of
these green space types for each urban neighbourhood
and then investigated their patterning across the socioeconomic gradient and their relationships with causespecific mortality, after adjusting for relevant confounders.
Green space classification
Spatial land cover data sets for New Zealand were sought
and processed using ArcMap GIS software (ESRI, Redlands, CA) to produce the green space classification. For
the purposes of distinguishing usable and non-usable
green space across the country we required data with
both a good level of attribute information and national
coverage. Three New Zealand-wide spatial data sets (with
Richardson et al. BMC Public Health 2010, 10:240
/>
land areas represented as polygons) were obtained and
integrated (Table 1). The Land Cover Data Base (LCDB2)
data set gave contiguous national coverage but had the
lowest resolution and provided the least attribute information; hence we augmented this data set with two more
detailed but less contiguous data sets from the Department of Conservation (DOC) and Land Information New
Zealand (LINZ). Our definition of green space included
natural areas (e.g., parks, beaches, and fields) but
excluded aquatic areas (e.g., lakes and the sea) as these
are not generally treated as green space in the literature.
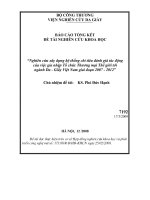
The decision tree developed to produce our green space
classification is shown in Figure 1.
We began our classification process with the most
informative data set: the DOC conservation area boundaries. Attribute information provided the legal status of
each conservation area and permitted identification of
usable green space (e.g., 'Scenic Reserve'), non-usable
Page 3 of 14
green space (e.g., 'Sanctuary Area') and other land (e.g.,
'Administration Purpose').
The next most informative data set, the LINZ Core
Records System, was then used to identify further green
space areas from the remaining unclassified land. Attribute information for the 'purpose' of each LINZ parcel
was used to identify usable and non-usable green space.
Finally, the LCDB2 was used to identify any remaining
unclassified areas. Usable green space was defined as
'urban parkland/open space', 'beaches', and any non-commercial forestry ('indigenous forest', 'deciduous hardwoods', or 'other exotic forest') that was either adjacent to
other usable green space or was within 10 m of a road
(i.e., accessible). Non-usable green space was defined as
all other natural areas, including agricultural land, salt
marsh, and commercial forestry.
Census Area Units (CAUs) were used as our small area
geography for the analysis. CAUs are the second smallest
census geography in New Zealand, and the smallest areal
Figure 1 Flowchart illustration of usable and non-usable green space classification system.
Richardson et al. BMC Public Health 2010, 10:240
/>
Page 4 of 14
Table 1: Data set specifications for green space classification.
Data set
Spatial resolution
Details
Department of Conservation (DOC)
Conservation Boundaries data set (2003)
High
Legal boundaries of land administered by
the DOC, and of land of interest to but not
administered by the DOC. Attributes
include legal designation (including
specific Act) and site name.
Land Information New Zealand's (LINZ)
Core Records System (2004)
High
Legal boundaries of land parcels across
New Zealand, derived from the Core
Records System's Survey, Title and
Addresses data sets. Attributes include the
purpose of any Statutory Actions on the
parcels, although these purposes are not
standardised, and are occasionally
ambiguous.
Ministry for the Environment Land Cover
Database 2 (LCDB2) (2001)
Lower resolution (intended scale 1: 50,000,
minimum mapping unit = 1 ha).
61 land cover classes, derived from
supervised and manual classification of
Landsat 7 ETM+ satellite imagery and
verified using some ground data. Specific
land cover class provided as an attribute.
unit for which mortality data are disseminated. We
restricted our analyses to urban areas because 71% of the
New Zealand population lives in these areas (2.7 million
people) [32]. We selected 1009 CAUs from the 2001 Census that were classified by Statistics New Zealand as
being 'main urban areas' [32]. Using an intersect operation in ArcMap we then calculated the proportion of total
and usable green space coverage within each CAU. These
1009 CAUs had a mean population in 2001 of 2630 and a
mean area of 5 km2. As this area was equivalent to that of
a circle with a radius of approximately 1.3 km our measure represented green spaces within relatively easy walking or cycling distance of CAU residents. Restricting our
analyses to urban areas therefore had practical benefits
for exposure classification, as green spaces within larger
rural CAUs would be more widely dispersed, and would
not all be within walking or cycling distance.
Health data
We obtained anonymised, individual-level mortality data
(including information on age, sex and domicile of residence at death) for every registered death between 1996
and 2005 from the New Zealand Ministry of Health. Individual deaths were matched to CAUs. Cardiovascular disease (CVD) and lung cancer (LC) mortality counts were
generated by sex, age-group (15-44, 45-54, 55-64) and
CAU. Analyses using more age-groups did not alter the
results obtained. Denominator age-group and sex-specific population counts were extracted for each CAU
from the 2001 census. The analysis was restricted to
adults under 65 in order to study premature mortality.
The total study population was 1,546,405 (in 2001), with
9,484 deaths from CVD and 2,603 from LC over the 10year period.
Confounders
In order to account for the strong influence of socioeconomic deprivation on the selected health outcomes we
extracted area-level New Zealand Deprivation Index
(NZDep2001) scores for the CAUs [33]. The NZDep2001
combines CAU-level census data on income, employment, communication, support, transport, qualifications,
living space and home ownership [33]. The scores are
scaled to have a mean of 1000 and a standard deviation of
100 index points. Smoking is an important risk factor for
both CVD and LC, hence we adjusted for smoking by
extracting counts of regular smokers from the 1996 and
2006 censuses and calculating an average percent smokers measure for each CAU.
We controlled for air pollution as a potential confounder, because greener places tend to be less polluted
due to the reduced amount of land available to pollutiongenerating processes (e.g., traffic, domestic heating, and
industry). We used a validated CAU-level measure of particulate matter with a median diameter less than 10 μm
(PM10), the development of which is described elsewhere
[34]. We also adjusted for population density (persons per
hectare) as a measure of urbanity, because the green
space and health relationship may vary with urbanity
[3,5].
Richardson et al. BMC Public Health 2010, 10:240
/>
Analysis
Due to over-dispersion (i.e., greater variance in the mortality data than expected), negative binomial regression
models were used to model the relationship between
CVD and LC mortality and the availability of different
types of green space. The models were adjusted by agegroup,
sex,
area-level
socioeconomic
status
(NZDep2001), area-level smoking rate, area-level PM10
and population density. The age- and sex-specific population count in each CAU was entered as the exposure variable.
Incidence rate ratios (IRRs) and 95% confidence intervals (CIs) were calculated for quartile measures of green
space availability (total and usable). The baseline model
(model 1) adjusted for the confounding effects of agegroup and sex in the relationship between green space
availability quartiles and cause-specific mortality. Model
2 additionally controlled for area deprivation
(NZDep2001 quintiles derived specifically for the subset
of CAUs), model 3 for smoking rate (quartiles), model 4
for the air pollutant PM10 (quintiles), and model 5 for
population density (quintiles).
Results
Green space classification
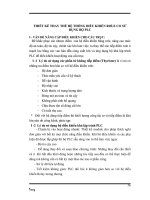
An example of the classification is shown in Figure 2. The
classification included green spaces ranging in size from
large parks to the numerous small 'Recreation Reserves',
some at less than 0.02 ha (200 m2). These small areas,
found largely in built-up areas, were designated by the
DOC for local recreation and sporting activities. CAUs in
the main urban areas had a mean of 42% total green space
coverage (range 0 to 100%), and 17% usable green space
coverage (range 0 to 79%).
Socioeconomic gradient
Socioeconomic gradients in green space availability were
observed (Figure 3). Figure 3 shows a clear and marked
association such that mean total green space availability
fell with increasing socioeconomic deprivation. The
NZDep2001 score was a significant predictor of percent
total green space (ordinary least squares (OLS) regression
coefficient = -0.11; p < 0.001). In other words, a one standard deviation increase in deprivation score was associated with 11% less total green space. However, the
association between deprivation and usable green space
was in the opposite direction; greater deprivation was
associated with a greater quantity of usable green space
(OLS coefficient = 0.02; p = 0.003).
Associations with mortality
Results of the investigation into the relationship between
green space and mortality in New Zealand are presented
in Tables 2 and 3. Population density quintiles were not
Page 5 of 14
significant predictors in any green space and mortality
relationships, and did not substantively affect the results
(model 5), hence these results are not presented.
After controlling for all available confounders we found
no relationship between availability of total green space
and CVD mortality (Table a2a, model 4). For usable green
space availability, all CVD mortality IRRs were lower than
1.0 after accounting for deprivation (models 2 to 4, Table
b2b), suggesting mortality rates that were slightly
reduced, although not significantly so. Thus, in our study
we found no evidence that CVD mortality was related to
availability of either total or usable green space in New
Zealand CAUs.
Elevated IRRs were found for the relationship between
total green space and lung cancer mortality (Table a3a),
but wide confidence intervals rendered the findings nonsignificant. For usable green space, no significant relationship with lung cancer mortality was found, and the
IRRs were inconsistent in direction (Table b3b).
Discussion
This New Zealand study examined the association
between green space and mortality using ecological analytical methods. It is the first study to aim to explore the
relative importance of causative mechanisms through
contrasting relationships between green space and mortality for differing types of green space. We successfully
aggregated three data sets to produce a high resolution
classification that distinguished usable from non-usable
green space. Our classification is the first comprehensive
model for New Zealand that differentiates between functional types of green space. Compared with other available national classifications (e.g., the LCDB2) our
classification permits the identification of smaller areas of
green space that may have local importance and healthrelevance.
An important finding from this research was that
opposing socioeconomic gradients were observed for the
availability of total and usable green space: deprived
neighbourhoods were relatively disadvantaged in total
green space availability, but had relatively more usable
green space. Total green space availability increased
markedly with socioeconomic affluence, presumably
because the larger, less densely populated and hence
greener CAUs on the urban periphery tend to be more
affluent. Much of this green space will be agricultural,
and therefore classified as non-usable. In contrast, CAUs
in densely populated inner-city areas typically have less
undeveloped land, but most if not all of the available
green space will be usable, hence the reverse socioeconomic gradient we observed for usable green space. This
finding concurs with other work that found deprived
communities in New Zealand have better geographical
access to parks than more affluent areas [29,30].
Richardson et al. BMC Public Health 2010, 10:240
/>
Page 6 of 14
Figure 2 Extract of the green space classification. An example of the green space classification for an area in the north east of Christchurch, New
Zealand (approximate location indicated by dot on inset map). Map annotation gives the attribute information available for each area, showing that
some are identifiable by name (e.g., Burwood Park) while others are identifiable only by the type of land use (e.g. 'park').
Richardson et al. BMC Public Health 2010, 10:240
/>
Page 7 of 14
Figure 3 Green space availability by socioeconomic deprivation. Mean green space availability by level of socioeconomic deprivation
(NZDep2001 quintile). Bars indicate 95% CIs around the mean.
Our study found no evidence that either total or usable
green space availability was related to either cardiovascular disease or lung cancer mortality. The single other
known study of green space and mortality found similarly
that lung cancer mortality was not associated with green
space exposure, but that cardiovascular disease mortality
was significantly reduced in greener areas [10]. Additionally, studies that have included related morbidity outcomes have reported protective associations of green
space with blood pressure [7], obesity and overweight [8],
and coronary heart disease [9]. However, other work
from New Zealand has found no relationship between
green space and BMI [12], which, in conjunction with our
work, may indicate that green space and health relationships in New Zealand differ from those found in other
countries.
There are a number of possible explanations for why
New Zealand findings might differ. Firstly, there may be a
lack of variation in exposure to green space in New Zealand, compared with other countries studied. Average
total green space for New Zealand's 'main urban area'
CAUs (42%) ranks them similar to the 'slightly urban'
areas of Maas et al. [35], indicating that urban areas of
New Zealand are greener than those in the Netherlands.
Secondly, public green spaces may be less important for
health in New Zealand because private gardens tend to be
larger, at least when compared with the UK [36,37]. Private gardens were not included in our green space measures because none of the three land cover data sets we
used had included them (only large gardens of at least 1
ha would be identified in the LCDB2 data set). Thirdly,
aquatic areas ('blue space') may have greater importance
for health in New Zealand than elsewhere, as a high proportion of the population (65%) lives within 5 km of the
sea [38]. A measure combining green and blue space may
therefore be more closely associated with better health
than green space alone.
Finally, green space quality may be a better predictor of
health than quantity [3,4]. For example, Annear et al. [39]
found that residents of an area perceived to have a poor
quality physical and social environment engaged in leisure time physical activity less frequently than those living in a higher quality area of the same city. Our measure
of green space availability was an objective area-based
measure, whereas attributes such as aesthetic quality and
perceived safety may also influence the relationship
Richardson et al. BMC Public Health 2010, 10:240
/>
Page 8 of 14
Table 2: Incidence rate ratios (95% confidence intervals) for cardiovascular disease mortality predicted from (a) total and
(b) usable green space availability.
(a) Total green space
Model 1
(Baseline)
Model 2
(+ area deprivation)
Model 3
(+ smoking rate)
Model 4
(+ air pollution)
1 (least)
1.00
1.00
1.00
1.00
2
1.04 (0.97 to 1.12)
1.03 (0.97 to 1.09)
1.02 (0.96 to 1.08)
1.02 (0.96 to 1.08)
3
1.00 (0.93 to 1.08)
1.06 (1.00 to 1.13)
1.03 (0.97 to 1.09)
1.01 (0.94 to 1.07)
4 (most)
0.86 (0.79 to 0.94)
1.16 (1.07 to 1.25)
1.07 (0.99 to 1.16)
1.01 (0.91 to 1.11)
Male
1.00
1.00
1.00
1.00
Female
0.41 (0.39 to 0.43)
0.40 (0.39 to 0.42)
0.40 (0.39 to 0.42)
0.40 (0.39 to 0.42)
55 to 64
1.00
1.00
1.00
1.00
45 to 54
0.36 (0.33 to 0.38)
0.35 (0.34 to 0.37)
0.35 (0.34 to 0.37)
0.35 (0.34 to 0.37)
15 to 44
0.06 (0.06 to 0.07)
0.06 (0.06 to 0.06)
0.06 (0.06 to 0.06)
0.06 (0.06 to 0.06)
1 (least)
1.00
1.00
1.00
2
1.45 (1.33 to 1.59)
1.31 (1.19 to 1.44)
1.31 (1.20 to 1.44)
3
1.89 (1.74 to 2.06)
1.51 (1.36 to 1.68)
1.52 (1.37 to 1.69)
4
2.45 (2.26 to 2.66)
1.77 (1.58 to 1.99)
1.78 (1.59 to 2.00)
5 (most)
3.83 (3.53 to 4.15)
2.48 (2.20 to 2.80)
2.48 (2.20 to 2.81)
1 (least)
1.00
1.00
2
1.23 (1.13 to 1.34)
1.23 (1.14 to 1.34)
Green space
availability quartile
Sex
Age group
Area deprivation
(NZDep2001)
Smoking rate
Richardson et al. BMC Public Health 2010, 10:240
/>
Page 9 of 14
Table 2: Incidence rate ratios (95% confidence intervals) for cardiovascular disease mortality predicted from (a) total and
(b) usable green space availability. (Continued)
3
1.35 (1.22 to 1.48)
1.35 (1.22 to 1.48)
4 (most)
1.68 (1.51 to 1.87)
1.66 (1.49 to 1.85)
Air pollution (PM10)
1 (least)
1.00
2
0.97 (0.89 to 1.06)
3
0.89 (0.81 to 0.98)
4
0.92 (0.83 to 1.01)
5 (most)
0.92 (0.84 to 1.01)
(b) Usable green space
Green space
availability quartile
1 (least)
1.00
1.00
1.00
1.00
2
1.03 (0.95 to 1.12)
0.95 (0.89 to 1.02)
0.96 (0.90 to 1.03)
0.97 (0.91 to 1.04)
3
1.09 (1.01 to 1.18)
0.95 (0.89 to 1.02)
0.97 (0.90 to 1.03)
0.97 (0.91 to 1.04)
4 (most)
1.07 (0.99 to 1.16)
0.94 (0.88 to 1.01)
0.96 (0.90 to 1.03)
0.96 (0.90 to 1.03)
Male
1.00
1.00
1.00
1.00
Female
0.41 (0.39 to 0.44)
0.40 (0.38 to 0.42)
0.40 (0.39 to 0.42)
0.40 (0.39 to 0.42)
55 to 64
1.00
1.00
1.00
1.00
45 to 54
0.36 (0.33 to 0.38)
0.35 (0.34 to 0.37)
0.35 (0.34 to 0.37)
0.35 (0.34 to 0.37)
15 to 44
0.06 (0.06 to 0.07)
0.06 (0.05 to 0.06)
0.06 (0.06 to 0.06)
0.06 (0.06 to 0.06)
1 (least)
1.00
1.00
1.00
2
1.43 (1.31 to 1.56)
1.30 (1.18 to 1.42)
1.31 (1.20 to 1.44)
Sex
Age group
Area deprivation
(NZDep2001)
Richardson et al. BMC Public Health 2010, 10:240
/>
Page 10 of 14
Table 2: Incidence rate ratios (95% confidence intervals) for cardiovascular disease mortality predicted from (a) total and
(b) usable green space availability. (Continued)
3
1.86 (1.72 to 2.02)
1.49 (1.35 to 1.65)
1.53 (1.38 to 1.69)
4
2.39 (2.21 to 2.59)
1.74 (1.56 to 1.94)
1.79 (1.60 to 2.00)
5 (most)
3.72 (3.44 to 4.03)
2.42 (2.16 to 2.72)
2.49 (2.22 to 2.81)
1 (least)
1.00
1.00
2
1.24 (1.14 to 1.35)
1.24 (1.14 to 1.34)
3
1.37 (1.24 to 1.51)
1.35 (1.22 to 1.48)
4 (most)
1.71 (1.54 to 1.90)
1.66 (1.49 to 1.85)
Smoking rate
Air pollution (PM10)
1 (least)
1.00
2
0.98 (0.90 to 1.06)
3
0.90 (0.83 to 0.97)
4
0.92 (0.85 to 1.00)
5 (most)
0.92 (0.85 to 1.00)
All models adjusted for sex and age-group. Area-level confounders added sequentially in models 2, 3 and 4.
between green space and health [8]. Measuring these
qualities would not be possible for a national scale classification such as ours, but their importance should be
investigated further, in localised studies. Regardless of
their availability to residents, lower quality areas of green
space may be less conducive to facilitating physical activity or a restorative experience [3,4].
Our third objective was to investigate the mechanism
by which green space may influence mortality outcomes,
by contrasting mortality associations for usable and total
green space. However, we found no evidence that either
type of green space influenced mortality outcomes in
New Zealand, hence cannot make inference as to the
likely mechanism. Repeating the analyses for contexts in
which health associations have been found, and for which
usable and non-usable green space types can be differentiated, would provide a useful insight into the mechanism
behind the relationship.
Our study had limitations. First, to produce a national
classification as objectively as possible we automated the
process. Misclassifications were identified using local
knowledge and addressed in the automation process, but
given the national-level coverage of the dataset it was not
possible to correct all minor inconsistencies. Private gardens were necessarily omitted, as discussed above.
Second, the number of non-significant results in the
expected direction, for cardiovascular disease in particular, suggested that the models may have lacked the statistical power to detect subtle trends. Residual confounding
by unmeasured risk factors that are likely to have a substantial influence on cardiovascular disease (e.g., diet,
BMI, alcohol consumption) may have larger influences on
the risk of CVD mortality than exposure to green space.
Detection of a small effect is difficult, however we did
deploy the largest data set available for the investigation
of this topic.
Third, we investigated available green space within
each CAU but did not consider the health relevance of
green space across a wider area to account for travel to
green space areas (e.g., using a buffer around each CAU).
Table 3: Incidence rate ratios (95% confidence intervals) for lung cancer mortality predicted from (a) total and (b) usable
green space availability.
(a) Total green space
Model 1
(Baseline)
Model 2
(+ area deprivation)
Model 3
(+ smoking rate)
Model 4
(+ air pollution)
1 (least)
1.00
1.00
1.00
1.00
2
1.11 (0.99 to 1.24)
1.08 (0.98 to 1.20)
1.07 (0.97 to 1.19)
1.11 (0.99 to 1.23)
3
1.02 (0.90 to 1.14)
1.09 (0.98 to 1.22)
1.05 (0.94 to 1.17)
1.09 (0.97 to 1.22)
4 (most)
0.91 (0.79 to 1.05)
1.23 (1.07 to 1.41)
1.10 (0.95 to 1.26)
1.12 (0.94 to 1.32)
Male
1.00
1.00
1.00
1.00
Female
0.79 (0.72 to 0.86)
0.78 (0.72 to 0.84)
0.77 (0.71 to 0.84)
0.77 (0.71 to 0.84)
55 to 64
1.00
1.00
1.00
1.00
45 to 54
0.27 (0.25 to 0.30)
0.27 (0.25 to 0.30)
0.27 (0.25 to 0.30)
0.27 (0.25 to 0.30)
15 to 44
0.02 (0.02 to 0.02)
0.02 (0.02 to 0.02)
0.02 (0.02 to 0.02)
0.02 (0.02 to 0.02)
1 (least)
1.00
1.00
1.00
2
1.32 (1.13 to 1.54)
1.13 (0.96 to 1.33)
1.12 (0.94 to 1.32)
3
1.98 (1.71 to 2.29)
1.39 (1.15 to 1.67)
1.38 (1.14 to 1.66)
4
2.52 (2.19 to 2.91)
1.52 (1.24 to 1.87)
1.51 (1.23 to 1.85)
5 (most)
3.64 (3.16 to 4.19)
1.93 (1.56 to 2.40)
2.00 (1.60 to 2.48)
1 (least)
1.00
1.00
2
1.33 (1.14 to 1.55)
1.32 (1.13 to 1.53)
Green space
availability quartile
Sex
Age group
Area deprivation
(NZDep2001)
Smoking rate
Table 3: Incidence rate ratios (95% confidence intervals) for lung cancer mortality predicted from (a) total and (b) usable
green space availability. (Continued)
3
1.64 (1.37 to 1.96)
1.62 (1.36 to 1.94)
4 (most)
2.09 (1.72 to 2.54)
2.02 (1.66 to 2.46)
Air pollution (PM10)
1 (least)
1.00
2
0.89 (0.76 to 1.03)
3
0.87 (0.75 to 1.02)
4
0.99 (0.84 to 1.16)
5 (most)
1.04 (0.88 to 1.23)
(b) Usable green space
Green space
availability quartile
1 (least)
1.00
1.00
1.00
1.00
2
1.06 (0.93 to 1.20)
0.95 (0.84 to 1.08)
0.98 (0.86 to 1.10)
0.99 (0.88 to 1.12)
3
1.11 (0.97 to 1.26)
0.97 (0.86 to 1.09)
0.98 (0.87 to 1.10)
1.00 (0.89 to 1.13)
4 (most)
1.10 (0.97 to 1.25)
0.97 (0.85 to 1.09)
0.99 (0.88 to 1.11)
1.02 (0.90 to 1.15)
Male
1.00
1.00
1.00
1.00
Female
0.79 (0.72 to 0.86)
0.77 (0.71 to 0.84)
0.77 (0.71 to 0.84)
0.77 (0.71 to 0.84)
55 to 64
1.00
1.00
1.00
1.00
45 to 54
0.27 (0.25 to 0.30)
0.27 (0.25 to 0.30)
0.27 (0.25 to 0.30)
0.27 (0.25 to 0.30)
15 to 44
0.02 (0.02 to 0.02)
0.02 (0.02 to 0.02)
0.02 (0.02 to 0.02)
0.02 (0.02 to 0.02)
1 (least)
1.00
1.00
1.00
2
1.30 (1.11 to 1.51)
1.12 (0.95 to 1.32)
1.11 (0.94 to 1.31)
Sex
Age group
Area deprivation
(NZDep2001)
Richardson et al. BMC Public Health 2010, 10:240
/>
Page 13 of 14
Table 3: Incidence rate ratios (95% confidence intervals) for lung cancer mortality predicted from (a) total and (b) usable
green space availability. (Continued)
3
1.94 (1.68 to 2.24)
1.36 (1.13 to 1.63)
1.36 (1.13 to 1.64)
4
2.45 (2.12 to 2.82)
1.49 (1.22 to 1.81)
1.48 (1.21 to 1.81)
5 (most)
3.51 (3.06 to 4.03)
1.88 (1.53 to 2.31)
1.94 (1.57 to 2.40)
1 (least)
1.00
1.00
2
1.35 (1.16 to 1.57)
1.33 (1.14 to 1.55)
3
1.67 (1.40 to 1.99)
1.65 (1.39 to 1.97)
4 (most)
2.14 (1.76 to 2.59)
2.06 (1.70 to 2.50)
Smoking rate
Air pollution (PM10)
1 (least)
1.00
2
0.87 (0.76 to 1.00)
3
0.85 (0.74 to 0.98)
4
0.95 (0.83 to 1.09)
5 (most)
0.99 (0.86 to 1.13)
All models adjusted for sex and age-group. Area-level confounders added sequentially in models 2, 3 and 4.
However, in an ecological study such as this, with no
means of quantifying individual exposure to green space
outside of the CAU of residence, any attempt to include
green space across a wider area would have been subject
to similar exposure misclassification issues. As such, the
measure of green space we used (% coverage per CAU)
captured the green spaces that most residents were likely
to experience most often, but cannot be considered a
comprehensive measure of green space exposure.
Finally, the distinction between usable and non-usable
green space in our classification was relatively coarse,
whereas finer level green space type differences may have
relevance for health. For example, a large regional park
may be used by people from a wide catchment area, but
used infrequently, whereas a small local park may serve a
smaller catchment area but be used more frequently.
Such distinctions could not be made reliably in our classification, but future work could usefully explore the health
implications of different green space types.
Conclusion
We developed a novel classification of green space types,
based on the utility of each space (usable or non-usable),
and found different socioeconomic gradients in exposure
to usable and total green space. We found that public
green space availability in New Zealand may not be as
important a determinant of health as found elsewhere.
Importantly these findings emphasise that green space
and health relationships are likely to vary on a nation-bynation basis. Further investigation of the national variations that contribute to the differences will help inform
the wider green space and health debate.
Competing interests
The authors declare that they have no competing interests.
Authors' contributions
RM, JP and SK conceived the study. PD and ER acquired and processed datasets. ER conducted the analyses and drafted the manuscript. All authors participated in design and coordination of the study, and all read and approved the
final manuscript.
Richardson et al. BMC Public Health 2010, 10:240
/>
Acknowledgements
We thank the Department of Conservation, Land Information New Zealand,
and the Ministry for the Environment for access to their land use datasets. We
also thank the Ministry of Health for access to the individual-level mortality
records. We are grateful to three reviewers whose constructive comments have
helped to improve the manuscript. This study was supported by a research
grant from the Geography Department, University of Canterbury, Christchurch.
PD is funded through the GeoHealth Laboratory, a collaboration with the Ministry of Health. In the initial stages of the study, RM was the recipient of an
Erskine Fellowship from the University of Canterbury, New Zealand.
Author Details
1School of GeoSciences, The University of Edinburgh, Edinburgh, UK, 2Section
of Public Health and Health Policy, Faculty of Medicine, University of Glasgow,
Glasgow, UK and 3GeoHealth Laboratory, Department of Geography,
University of Canterbury, Christchurch, New Zealand
Received: 28 September 2009 Accepted: 11 May 2010
Published: 11 May 2010
©
This
BMC
2010
is
article
Public
an
Richardson
Open
Health
is available
Access
2010,
et al;
from:
article
10:240
licensee
/>distributed
BioMed under
Centralthe
Ltd.
terms of the Creative Commons Attribution License ( which permits unrestricted use, distribution, and reproduction in any medium, provided the original work is properly cited.
References
1. Mitchell R, Gleave S, Bartley M, Wiggins R: Do attitude and area influence
health? A multilevel approach to health inequalities. Health Place 2000,
6:67-69.
2. Health Council of the Netherlands, RMNO: Nature and health: the influence
of nature on social, psychological and physical well-being The Hague: Health
Council of the Netherlands and RMNO; 2004. Publication no. 2004/09
3. Maas J, Verheij RA, Groenewegen PP, de Vries S, Spreeuwenberg P: Green
space, urbanity, and health: how strong is the relation? J Epidemiol
Community Health 2006, 60:587-592.
4. de Vries S, Verheij RA, Groenewegen PP, Spreeuwenberg P: Natural
environments - Healthy environments? An exploratory analysis of the
relationship between greenspace and health. Environ Plan A 2003,
35(10):1717-1731.
5. Mitchell R, Popham F: Greenspace, urbanity and health: Relationships in
England. J Epidemiol Community Health 2007, 61(8):681-683.
6. Sugiyama T, Leslie E, Giles-Corti B, Owen N: Associations of
neighbourhood greenness with physical and mental health: do
walking, social coherence and local social interaction explain the
relationships? J Epidemiol Community Health 2008, 62(5):e9.
7. Hartig T, Evans GW, Jamner LD, Davis DS, Gärling T: Tracking restoration
in natural and urban field settings. J Environ Psychol 2003, 23:109-123.
8. Ellaway A, Macintyre S, Bonnefoy X: Graffiti, greenery, and obesity in
adults: secondary analysis of European cross sectional survey. Br Med J
2005, 331:611-612.
9. Maas J, Verheij RA, de Vries S, Spreeuwenberg P, Schellevis FG,
Groenewegen PP: Morbidity is related to a green living environment. J
Epidemiol Community Health 2009.
10. Mitchell R, Popham F: Effect of exposure to natural environment on
health inequalities: an observational population study. Lancet 2008,
372:1655-1660.
11. Takano T, Nakamura K, Watanabe M: Urban residential environments
and senior citizens' longevity in megacity areas: the importance of
walkable green spaces. J Epidemiol Community Health 2002,
56(12):913-918.
12. Witten K, Hiscock R, Pearce J, Blakely T: Neighbourhood access to open
spaces and the physical activity of residents: a national study. Prev Med
2008, 47(3):299-303.
13. Humpel N: Environmental factors associated with adults' participation
in physical activity. Am J Prev Med 2002, 22(3):188-199.
14. Bedimo-Rung AL, Mowen AJ, Cohen DA: The significance of parks to
physical activity and public health: a conceptual model. Am J Prev Med
2005, 28:159-168.
15. US Surgeon General: Physical Activity and Health. A report of the Surgeon
General Washington DC: Center for Disease Control and Prevention; 1996.
16. Nocon M, Hiemann T, Müller-Riemenschneider F, Thalau F, Roll S, Willich
SN: Association of physical activity with all-cause and cardiovascular
mortality: a systematic review and meta-analysis. European Journal of
Cardiovascular Prevention & Rehabilitation 2008, 15(3):239-246.
17. WHO: Preventing Chronic Diseases: a Vital Investment Geneva: World Health
Organization; 2005.
Page 14 of 14
18. Maas J, van Dillen SME, Verheij RA, Groenewegen PP: Social contacts as a
possible mechanism behind the relation between green space and
health. Health Place 2009, 15(2):586-595.
19. Kaplan R, Kaplan S: The experience of nature. A psychological perspective
Cambridge: Cambridge University Press; 1989.
20. Hartig T, Mang M, Evans GW: Restorative effects of natural environment
experiences. Environ Behav 1991, 23(1):3-26.
21. Ulrich RS: Aesthetic and affective response to natural environment. In
Behavior and the Natural Environment Edited by: Altman I, Wohlwill JF. New
York: Plenum Press; 1983:85-125.
22. Taylor SE, Repetti RL, Seeman T: Health psychology: what is an
unhealthy environment and how does it get under the skin? Annu Rev
Psychol 1997, 48(1):411-447.
23. Ulrich RS: View through a window may influence recovery from
surgery. Science 1984, 224(4647):420-421.
24. Pretty J, Peacock J, Sellens M, Griffin M: The mental and physical health
outcomes of green exercise. Int J Environ Health Res 2005, 15(5):319-337.
25. Lynch JW, Smith GD, Kaplan GA, House JS: Income inequality and
mortality: importance to health of individual income, psychosocial
environment, or material conditions. BMJ 2000, 320(7243):1200-1204.
26. Estabrooks P, Lee R, Gyurcsik N: Resources for physical activity
participation: does availability and accessibility differ by
neighbourhood socioeconomic status? Ann Behav Med 2003,
25:100-104.
27. Comber A, Brunsdon C, Green E: Using a GIS-based network analysis to
determine urban greenspace accessibility for different ethnic and
religious groups. Landsc Urban Plan 2008, 86(1):103-114.
28. Gidlow C, Johnston LH, Crone D, Ellis N, James D: A systematic review of
the relationship between socio-economic position and physical
activity. Health Educ J 2006, 65(4):338-367.
29. Pearce J, Witten K, Hiscock R, Blakely T: Are socially disadvantaged
neighbourhoods deprived of health-related community resources? Int
J Epidemiol 2007, 36:348-355.
30. Pearce J, Witten K, Hiscock R, Blakely T: Regional and urban - rural
variations in the association of neighbourhood deprivation with
community resource access: a national study. Environ Plan A 2008,
40(10):2469-2489.
31. Friedenreich CM: Physical activity and cancer prevention: from
observational to intervention research. Cancer Epidemiol Biomarkers
Prev 2001, 10:287-301.
32. Statistics New Zealand: New Zealand: An Urban/Rural Profile Wellington:
Statistics New Zealand; 2004.
33. Salmond C, Crampton P: NZDep2001 Index of Deprivation Wellington:
Department of Public Health, Wellington School of Medicine and Health
Sciences; 2002.
34. Kingham S, Fisher G, Hales S, Wilson I, Bartie P: An empirical model for
estimating census unit population exposure in areas lacking air quality
monitoring. J Expo Sci Environ Epidemiol 2008, 18(2):200-210.
35. Maas J, Verheij RA, Spreeuwenberg P, Groenewegen PP: Physical activity
as a possible mechanism behind the relationship between green space
and health: a multilevel analysis. BMC Public Health 2008, 8:206.
36. Mathieu R, Freeman C, Aryal J: Mapping private gardens in urban areas
using object-oriented techniques and very high-resolution satellite
imagery. Landsc Urban Plan 2007, 81(3):179-192.
37. Loram A, Tratalos J, Warren PH, Gaston KJ: Urban domestic gardens (X):
the extent & structure of the resource in five major cities. Landsc Ecol
2007, 22(4):601-615.
38. Statistics New Zealand: Internal Migration Report: Are New Zealanders
living closer to the coast? 2008 [ Wellington:
Statistics New Zealand Accessed 28 July 2009.
39. Annear MJ, Cushman G, Gidlow B: Leisure time physical activity
differences among older adults from diverse socioeconomic
neighbourhoods. Health Place 2009, 15:482-490.
Pre-publication history
The pre-publication history for this paper can be accessed here:
/>doi: 10.1186/1471-2458-10-240
Cite this article as: Richardson et al., The association between green space
and cause-specific mortality in urban New Zealand: an ecological analysis of
green space utility BMC Public Health 2010, 10:240