Bank and Nonbank Financial Institutions as Providers of LongTerm Finance
Bạn đang xem bản rút gọn của tài liệu. Xem và tải ngay bản đầy đủ của tài liệu tại đây (1.25 MB, 40 trang )
4
Bank and Nonbank
Financial Institutions as
Providers of Long-Term Finance
T
his chapter studies the role of bank and
nonbank financial intermediaries in the
provision of long-term finance. In particular,
based on data from different financial institutions, it reports on the extent to which financial institutions hold long-term securities in
their portfolios and which of them are more
likely to extend the maturity structure toward
the long term.
Banks are the main source of finance for
firms and households across countries. Therefore, understanding the degree to which banks
lend long term and what drives maturity
lengths is of crucial importance. Furthermore,
the recent global financial crisis has highlighted the risk that banks’ deleveraging could
result in a shortening of the maturity of loans.
Also, forthcoming changes in international
bank regulation could alter the composition
of bank loans and could reinforce the need to
monitor and understand the degree to which
banks lend long term.
Over the past two decades, many countries
have also tried to foster long-term lending
through the promotion of nonbank domestic
institutional investors. The expectation was
that these investors would have long investment horizons, which would allow them to
take advantage of long-term risk and illiquidity premiums to generate higher returns on
their assets. Moreover, they were expected to
behave in a patient, countercyclical manner,
making the most of cyclically low valuations
to seek attractive investment opportunities,
thus helping to deepen long-term financial
markets and, more generally, increase access
to finance. This view has been expressed in
several studies and articles (see, for example, Caprio and Demirgüç-Kunt 1998; Davis 1998; Davis and Steil 2001; Corbo and
Schmidt-Hebbel 2003; Impavido, Musalem,
and Tressel 2003; BIS 2007a; Borensztein
and others 2008; Eichengreen 2009; Impavido, Lasagabaster, and Garcia-Huitron
2010; Della Croce, Stewart, and Yermo 2011;
The Economist 2013, 2014c; OECD 2013a,
2013c, 2014a; and Financial Times 2015).
Nonbank institutional investors have,
in fact, become increasingly important participants in global financial markets. The
proportion of household savings channeled
through these institutional investors has
grown significantly in recent decades, and
their assets under management are rapidly
catching up with those of the banking system
(BIS 2007b). Data from the Organisation for
GLOBAL FINANCIAL DEVELOPMENT REPORT 2015/2016
107
108
FINANCIAL INSTITUTIONS AS PROVIDERS OF LONG-TERM FINANCE
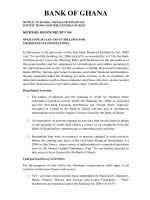
FIGURE 4.1 Assets under Management of Nonbank Institutional
Investors, 2001–13
90
U.S. dollars, trillions
80
70
60
50
40
30
20
10
0
2001 2002 2003 2004 2005 2006 2007 2008 2009 2010 2011 2012 2013
Pension funds
Insurance companies
Investment funds
Source: OECD 2014b.
Note: Only data for OECD countries are included. Investment funds include both open-end and
closed-end funds. Pension funds and insurance companies’ assets include assets invested in
mutual funds, which may be also counted in investment funds.
Economic Co-operation and Development
(OECD) show that in 2013 financial assets
under management reached $24.7 trillion for
pension funds, $26.1 trillion for insurance
companies, and $34.9 trillion for investment
funds (figure 4.1).
Little evidence exists, however, on whether
these investors actually invest in long-term
securities or on how they structure their asset holdings. While macroeconomic factors
and strong institutions may contribute to
lengthening the maturity structure of these
investors, this chapter highlights the role of
incentives, market forces, and regulations in
shaping investors’ maturity structure. Different types of institutions with different objectives are likely to provide funding for financial
markets in distinct ways. For example, some
institutions might need to match the maturity
of their assets to their liabilities, while others
might have only fiduciary responsibilities for
managing their assets without specific directives to invest short or long term. When savings from the public are delegated to financial
institutions, the regulator has to ensure that
managers are doing a good job at managing
these savings, avoiding excessive risk taking,
and minimizing loses. The way these regulations are set up can affect the incentives that
GLOBAL FINANCIAL DEVELOPMENT REPORT 2015/2016
managers have and the maturity profile of the
portfolios they choose.
This chapter contributes to these discussions by providing empirical evidence on the
investment strategies and, more specifically, on
the portfolio maturity and composition of different classes of bank and nonbank financial
intermediaries. Because gathering evidence on
the maturity structure of different financial
institutions is difficult, the chapter relies on
various types of evidence that are different in
nature, and in some cases new. The chapter
starts by presenting evidence on loan maturity for banks in different countries. Then it
presents country-specific evidence across different nonbank institutional investors and international evidence based on bond funds to
study the extent to which mutual funds, pension funds, and insurance companies hold and
bid for long-term instruments. In addition,
the chapter examines the investment profiles
of two growing types of nonbank financial
institutions that are also expected to have
long investment horizons, namely, sovereign
wealth funds (SWFs) and private equity (PE)
investors. The analysis is performed across
different countries, with special emphasis in
developing (low- and middle-income) countries, and discusses the potential limitations of
these investors in providing long-term funding. The chapter concludes by discussing some
policy implications from this evidence.
BANKS
Bank-level data across countries reveal that
the maturity of bank loans in high-income
countries is significantly longer than it is in
developing countries.1 Aside from data on
syndicated lending, discussed in chapter 3, the
main source of comparable international data
on bank lending is Bankscope, a commercial
database produced by Bureau van Dijk. Data
on the maturity breakdown of bank loans
is available for 3,400 banks operating in
49 countries from 2005 to 2012. Figure 4.2
shows the mean share of bank loans across
three maturity buckets: up to one year, two
to five years, and more than five years. While
close to a third of bank loans in high-income
countries have a maturity that exceeds five
years, for developing countries the share of
loans with maturity longer than five years averages 18 percent. In contrast, while half of
bank loans are short term (less than one year)
in developing countries, the share of shortterm loans in high-income countries averages
40 percent. There are smaller differences between high-income and developing countries
in the share of loans with maturity between
two and five years: this share averages 28 percent for high-income countries and 32 percent
for developing countries.
There are also differences between highincome and developing countries in the recent evolution of the share of bank loans by
maturity buckets. In both country groups,
however, there is no consistent evidence that
the recent crisis led to a significant decline in
the share of long-term loans when the overall
loan portfolio is considered.2 For high-income
countries, short-term debt declined from an
average of 40 percent in the precrisis period
to 37 percent in the postcrisis period, while
the share of long-term debt rose from 31
percent to 33 percent (table 4.1). It is likely
that as short-term debt matured, it was not
renewed and, hence, the share of mediumand long-term debt increased. For developing countries, the share of short-term debt
remained fairly stable at around 50 percent,
while the share of long-term debt increased
somewhat. In particular, the average share
of bank loans with maturity greater than five
years increased by 3 points, from 16 percent
to 19 percent, while the median rose from 8
percent to almost 13 percent. Of course, these
FINANCIAL INSTITUTIONS AS PROVIDERS OF LONG-TERM FINANCE
109
FIGURE 4.2 Average Share of Bank Loans by Length of Maturity and
Country Income Group, 2005–12
60
50
50
Share of total loans, %
GLOBAL FINANCIAL DEVELOPMENT REPORT 2015/2016
40
40
32
31
28
30
18
20
10
0
Up to 1 year
2–5 years
High-income countries
Over 5 years
Developing countries
Source: Bankscope (database), Bureau van Dijk, Brussels, />/products/company-information/international/bankscope.
patterns could hide significant differences in
the composition of borrowers—it is possible
that, while the share of long-term bank lending remained fairly stable, fewer small or medium firms, for example, might have received
long-term financing (see chapter 2).
Even when focusing on international bank
claims, where deleveraging has been well documented, there is no compelling evidence of
a significant and across-the-board shortening
of maturities following the financial crisis.3
The Bank for International Settlements (BIS)
reports quarterly data on international claims
from banks operating primarily in developed
countries vis-à-vis most countries around the
world. International claims consist of crossborder claims (that is, claims extended from
the home country where the international
TABLE 4.1 Share of Bank Loans across Different Maturity Buckets (percent)
Precrisis period
2005–07
Crisis period
2008–09
Postcrisis period
2010–12
Maturity bucket
Country classification
Mean
Median
Mean
Median
Mean
Median
Up to 1 year
High income
Developing
40.2
49.9
36.4
52.1
40.4
48.4
33.9
49.6
36.8
49.1
29.0
47.9
2 to 5 years
High income
Developing
28.6
32.5
26.6
32.3
26.2
33.4
24.8
31.0
29.5
31.6
29.9
30.4
More than 5 years
High income
Developing
30.6
16.4
29.1
8.0
33.0
17.9
33.6
13.0
33.3
19.0
30.1
13.3
Source: Bankscope (database), Bureau van Dijk, Brussels, />
110
FINANCIAL INSTITUTIONS AS PROVIDERS OF LONG-TERM FINANCE
FIGURE 4.3 Share of International Bank Claims with Maturity
above Two Years by Period and Country Income Group, 2005–13
60
Share of total claims, %
50
40
49
41 43
38 40
45 44 44
50
47
43 43
30
20
10
0
High-income countries
2005–07
Upper-middle-income
countries
2008–09
2010–11
Lower-middle- and
low-income countries
2012–13
Source: Consolidated Banking Statistics (database), Bank for International Settlements, Basel,
/>Note: International claims consist of cross-border claims and local claims denominated in foreign
currencies.
bank is headquartered to borrowers in other
host countries) and local claims denominated
in foreign currencies (that is, claims extended
through subsidiaries operating in host countries denominated in a currency other than
that of the host country). The BIS reports
data on the maturity breakdown of international claims, distinguishing between three
maturity buckets: less than one year, between
one and two years, and more than two years.
Among high-income countries, the share of
claims above two years increased steadily
throughout the 2005–13 period (figure 4.3).
In developing countries, the share of claims
above two years decreased slightly during the
2008–09 crisis period but then climbed above
its precrisis levels in 2012–13.
Substantial evidence shows that macroeconomic factors such as low inflation and country risk, as well as strong institutions, help
lengthen bank maturity. Demirgüç-Kunt and
Maksimovic (1999), Tasić and Valev (2008,
2010), and Kpodar and Gbenyo (2010) found
that inflation is negatively related to the share
of long-term loans banks make. Qian and
Strahan (2007) and Bae and Goyal (2009)
found that increased country risk is associated
GLOBAL FINANCIAL DEVELOPMENT REPORT 2015/2016
with shorter loan maturities. As for the importance of the institutional environment,
Fan, Titman, and Twite (2012) found that in
countries with weaker laws, firms tend to use
more short-term bank debt.
Other country characteristics, such as the
degree of development of the financial sector, the ability to effectively enforce financial contracts, the collateral framework, and
the credit information environment, are also
important determinants of bank loan maturity. First using data on the maturity of domestic bank credit to the private sector in 74
countries and then using a panel dataset for
a sample of transition economies, Tasić and
Valev (2008, 2010) found that financial sector development, as captured by the ratio of
bank credit to gross domestic product (GDP),
has a positive impact on bank loan maturity.
Bae and Goyal (2009), using loan data, and
Fan, Titman, and Twite (2012), using firmlevel data, found that better contract enforcement is associated with longer debt maturity.
Using a database of credit institutions in 129
countries, Djankov, McLiesh, and Shleifer
(2007) showed that legal creditor rights and
information-sharing institutions are statistically significant and quantitatively important
determinants of private credit development.
Qian and Strahan (2007), using a database of
syndicated bank loans in 43 countries, found
that creditor rights are positively associated
with loan maturity. De Haas, Ferreira, and
Taci (2010), using data for transition economies specifically, found that banks that perceive the legal collateral environment to be
good tend to focus on mortgage lending. The
introduction of collateral registries and credit
bureaus, which strengthen the collateral and
information environment, have been found to
result in a lengthening of bank loan maturities
(Martínez Pería and Singh 2014; Love, Martínez Pería, and Singh, forthcoming).
The significance of most of these country
characteristics was confirmed by a recent
analysis using Bankscope data (box 4.1). This
analysis also revealed that the presence of
fewer restrictions on bank entry is associated
with a larger share of long-term loans. Along
GLOBAL FINANCIAL DEVELOPMENT REPORT 2015/2016
BOX 4.1
FINANCIAL INSTITUTIONS AS PROVIDERS OF LONG-TERM FINANCE
The Correlates of Long-Term Bank Lending
What factors are correlated with bank long-term
lending over the period 2005–12? Bank-level data
from Bankscope on the share of loans with maturity
greater than one year can be combined with country-level data to answer this question. In particular,
these data can help to assess the association between
long-term lending and macroeconomic, institutional,
and regulatory factors.
The estimations reported in table B4.1.1, based
on data for 3,400 banks operating in 49 countries,
suggest that macroeconomic, institutional, and regulatory factors all seem to be significantly correlated
with a higher share of long-term fi nancing. Among
the macroeconomic factors, the estimations show
that infl ation is negatively and signifi cantly correlated with long-term lending. Stronger legal rights
and lower political risk are positively correlated with
long-term lending, indicating that institutional factors are important. Finally, banking regulations also
matter. In particular, more stringent requirements
for bank entry (including limits on foreign bank
entry) and higher capital requirements are negatively
correlated with bank long-term debt.
TABLE B4.1.1 Estimations for the Share of Bank Loans with Original Maturity Greater than 1 Year
Variables
Lag log of assets
Lag deposits to liabilities
Lag equity to assets
Lag liquidity to assets
Lag return on assets
Inflation
Dependent variable: Share of bank lending greater than 1 year
5.975***
[3.079]
–0.009
[–0.359]
0.058
[0.639]
0.015
[0.646]
0.108
[0.379]
–0.864***
[–2.916]
Strength of legal rights
3.243**
[2.148]
–0.023
[–0.994]
–0.023
[–0.257]
0.019
[0.880]
0.526*
[1.879]
6.085***
[3.238]
–0.011
[–0.465]
0.068
[0.764]
–0.003
[–0.133]
0.114
[0.390]
6.954***
[2.878]
0.001
[0.024]
0.075
[0.781]
0.001
[0.038]
–0.001
[–0.004]
5.089***
[3.300]
–0.012
[–0.472]
0.044
[0.522]
–0.005
[–0.234]
0.247
[0.867]
8.084***
[5.092]
Lack of political risk
1.004**
[2.517]
Limits on foreign entry
–3.879*
[–1.738]
Index of bank entry
requirements
–2.901**
[–2.489]
Index of capital regulation
Constant
Observations
R-squared
Number of banks
6.444***
[3.202]
–0.003
[–0.129]
0.070
[0.734]
0.000
[–0.018]
0.008
[0.031]
–5.115
[–0.188]
14,997
0.093
3,415
–30.545
[–1.087]
14,955
0.147
3,413
–92.091*
[–1.712]
14,933
0.095
3,391
–4.300
[–0.112]
14,739
0.076
3,362
27.012
[1.390]
14,770
0.103
3,370
–1.220*
[–1.918]
–5.107
[–0.196]
14,671
0.090
3,359
Sources: Calculation based on data from Bankscope (database), Bureau van Dijk, Brussels, />/international/bankscope; World Bank, Washington, DC.
Note: Estimations include bank fixed effects. Standard errors are clustered at the country-year level. Significance level: * = 10 percent, ** = 5 percent,
*** = 1 percent.
111
112
FINANCIAL INSTITUTIONS AS PROVIDERS OF LONG-TERM FINANCE
with the negative impact of inflation and the
positive impact of legal rights and low country risk, this exploratory analysis found that
bank entry restrictions and limits on foreign
entry are negatively related to bank loan maturity, suggesting an important role for establishing a contestable banking environment in
extending debt maturity.
Research has also found that bank characteristics such as size and capitalization can
affect the maturity of bank loan portfolios.
Other things equal, larger banks are expected
to exhibit higher shares of long-term to total
loans relative to other banks because they
tend to be more diversified, have greater access to funding, and have more resources to
develop credit risk management and evaluation systems to monitor their loans. Some
empirical evidence confirms this prediction.
Using data from 35 commercial banks of
six African countries of the Central African
Economic and Monetary Community over
the period 2001–10, Constant and Ngomsi
(2012) found that larger banks tend to make
business loans of longer maturity. Chernykh
and Theodossiou (2011) found a similar result when they analyzed the determinants of
long-term business lending by Russian banks.
On the surface, the impact of bank capitalization on loan maturity is ambiguous. On the
one hand, banks with larger capital might
have a higher capacity to deal with unexpected losses resulting from extending risky
long-term loans. On the other hand, high
levels of capital can signal that a bank is risk
averse and conservative and that it may be
reluctant to issue risky long-term loans. Existing empirical evidence supports the notion
that better-capitalized banks are more likely
to issue long-term loans because they are
more capable of dealing with the associated
risks (Chernykh and Theodossiou 2011; Constant and Ngomsi 2012).
Evidence suggests that bank ownership
also influences bank loan maturity. Despite
the conventional wisdom that government
ownership of banks is associated with greater
long-term lending, existing empirical evidence
does not support such an association. For
example, using quarterly data on lending by
commercial banks to the private sector in 14
GLOBAL FINANCIAL DEVELOPMENT REPORT 2015/2016
transition countries during the period from
1992 to 2007, Tasić and Valev (2010) found
that the asset share of state-owned banks has
a negative and statistically significant effect on
measures of bank loan maturity. In turn, analyzing a cross-section of banks operating in the
Russian Federation during 2007, Chernykh
and Theodossiou (2011) found that foreign
banks are more likely than state-owned banks
to extend a larger share of long-term business
loans in Russia. Using data from 220 banks
operating in 20 transition countries, De Haas,
Ferreira, and Taci (2010) found that foreign
banks are relatively more strongly involved in
mortgage lending than other banks.
Some research also shows that the type
of funding banks use to finance the loans
they make is significantly correlated with the
maturity structure of their debt. In particular,
empirical studies of the loan maturity structure of African (Constant and Ngomsi 2012)
and Russian (Chernykh and Theodossiou
2011) banks show that banks with a higher
share of long-term liabilities exhibit higher
shares of long-term loans. That is consistent
with the evidence from the corporate finance
literature discussed in chapter 2, which shows
that firms tend to match the maturity of their
assets and liabilities.
Despite the correlation between the maturity structure of bank assets and liabilities,
some degree of maturity transformation is
inherent in banking and facilitates long-term
lending. Banks typically borrow money on
demand or sight from depositors and lend
most of these funds at longer terms. By virtue of the role they play in maturity transformation, banks are exposed to investor and
deposit runs with potential implications for
bank liquidity and solvency.
Policies, such as deposit insurance, set up
to minimize the risk of depositor runs, can
affect the ability of banks to lend long term.
By lowering the risk of bank runs, deposit insurance may reduce banks’ need to hedge this
risk by extending a larger share of short-term
loans. Fan, Titman, and Twite (2012) showed
that firms located in countries with deposit insurance have more long-term debt. Although
policies such as deposit insurance could mitigate such risks, they may also generate moral
GLOBAL FINANCIAL DEVELOPMENT REPORT 2015/2016
hazard problems and higher risk taking by
banks in some circumstances (Demirgüç-Kunt
and Detragiache 2002).
While some degree of funding risk is expected in banking, evidence from the recent
global crisis suggests that excessive maturity
transformation risk can be a major source of
bank failure and ultimately can be pernicious
to long-term lending. Banks’ recent increasing
reliance on wholesale funding and derivative
financing has been identified as one of the
major sources of bank instability and failure
during the recent banking crisis (Huang and
Ratnovski 2010; Shleifer and Vishny 2010;
Gorton and Metrick 2012; Brunnermeier
and Oehmke 2013). Empirically, Yorulmazer (2008), Vazquez and Federico (2012),
and the International Monetary Fund (IMF
2013a) have found that banks with excessive
BOX 4.2
FINANCIAL INSTITUTIONS AS PROVIDERS OF LONG-TERM FINANCE
113
structural funding mismatches (such as higher
loan to deposit and short-term to total liabilities ratios) are more vulnerable to banking
distress and failure.4
Regulations that affect bank size, capitalization, and funding are likely to affect longterm finance, because these bank characteristics are correlated with the maturity structure
of bank loans. Basel III is a comprehensive set
of reform measures, developed by the Basel
Committee on Banking Supervision, with the
objective of strengthening the regulation, supervision, and risk management of the banking sector. Its capital requirements and new
minimum liquidity standards do not specifically target long-term bank finance, but they
may still affect it, as the Financial Stability Board recognized in a recent report (box
4.2).5 In particular, the combined effects of
The Basel III Framework
The Basel III framework is designed to strengthen
the regulation, supervision, and risk management of
the banking sector. It includes a comprehensive set of
policy measures divided into two categories: capital
reforms and liquidity reforms. The capital reforms
are primarily directed at improving the quality of
capital, while the liquidity reforms are intended to
minimize liquidity shortages and stresses, and to
reduce the risk of spillover from the fi nancial sector
to the real economy.
Under the new Basel III capital regime, Tier 1
capital has to be at least 6 percent of risk-weighted
assets (RWA), of which 4.5 percent has to be in the
form of common equity (CET1). In addition, the
same institutions are subject to an additional conservation buffer of 2.5 percent of RWA and to a countercyclical buffer of 0–2.5 percent of RWA, depending on national circumstances. An additional capital
surcharge of 1–2.5 percent of RWA also applies to
systemically important banks (that is, those whose
failure might trigger a fi nancial crisis) (figure B4.2.1).
Moreover, banks will be subject to a leverage ratio
of 3 percent, a requirement that aims to contain the
buildup of excessive leverage in the banking system.
15.5
1–2.5%
Capital surcharge for global
systemically important institutions
0–2.5%
Countercyclical buffer
13.0
10.5
2.5%
0
Lower tier 2
Tier 2: 2%
Upper tier 2
Additional tier 1: 1.5%
Innovative tier 1
Noninnovative tier 1
Core tier 1: 2%
Basel II
Common eqity
(CET1): 4.5%
Minimum
requirements
> 4.5% CET1
6.0
4.5
Capital conservation buffer
> 8% total capital
8.0
> 6% CET1
Share of risk-weighted assets (RWA), %
FIGURE B4.2.1 Basel III Requirements
Basel III (in 2019)
(box continued next page)
114
FINANCIAL INSTITUTIONS AS PROVIDERS OF LONG-TERM FINANCE
BOX 4.2
GLOBAL FINANCIAL DEVELOPMENT REPORT 2015/2016
The Basel III Framework (continued)
The liquidity component of Basel III consists of
two new ratios: the liquidity coverage ratio (LCR)
and the net stable funding ratio (NSFR). Under the
LCR, banks are required to hold sufficient highquality liquid assets (HQLA) that can be converted
into cash to meet all potential demands for liquidity over a 30-day period under stressed conditions.
The numerator contains two categories of easy-tosell asset classes. Level 1 assets include government
bonds, cash, and certain central bank reserves. Level
2 assets include long-term securities such as corporate bonds and covered bonds rated A+ to BBB–,
certain equities, and mortgage-backed securities that
meet specific conditions. The denominator is the difference between total expected cash outflows minus
total expected cash inflows during the 30-day stress
scenario. The ratio must be at least 100 percent.
The NSFR aims to promote resilience over a oneyear time horizon by ensuring that long-term assets
are funded with at least a minimum amount from
a stable funding source. In particular, loans with
a maturity greater than one year are to be covered
by stable funding with a maturity greater than one
year (for example, bank equity and liabilities such as
deposits and wholesale borrowing).
The Financial Stability Board (FSB) has analyzed
the potential consequences of Basel III for long-term
fi nancing (Financial Stability Board 2013) and does
not anticipate any direct effects on long-term loans
from the introduction of the LCR. The board notes,
however, that in order to meet the LCR requirement,
banks may prefer to hold certain liquid assets that
are treated more favorably under the HQLA defi nition (such as sovereign bonds). The FSB expects that
the NSFR allows for considerable maturity transformation since a long-term loan can be fully funded
with bank liabilities of one year or greater, but it recognizes that if the long-term loan is funded through
short-term deposits or other liabilities (that are regularly rolled over), the maturity mismatch will need
to be covered by lengthening the term of funding, by
reducing the maturity of loans, or both.
the reforms will be to increase the amount
of regulatory capital for such transactions
and to dampen the scale of maturity transformation risks. The overall effects will vary
depending on several factors—in particular,
the alternative funding sources in different
markets segments. In this regard, concerns
have been raised that the impact on developing countries could be more severe, since
these countries have less-developed markets
and fewer nonbank financial intermediaries
and, therefore, would suffer more if banks cut
back on long-term finance as a result of these
regulatory changes.
The impact of ongoing regulatory changes
should be monitored carefully, but in the
meantime government policies that help banks
access stable sources of funding might be desirable. These policies may include improving
financial inclusion to grow banks’ depositor
bases, promoting banks’ issuance of covered
bonds, and having banks improve their financial reporting on liquidity and other risks as
well as strengthen accounting and auditing
standards so that banks can tap into longerterm funding sources including those from
domestic and international capital markets
(Gobat, Yanase, and Maloney 2014).
PORTFOLIO MATURITY OF
DOMESTIC INSTITUTIONAL
INVESTORS: THE CASE OF CHILE
This section describes the differences in the
maturity structure of Chilean nonbank institutional investors and analyzes the factors
that lie behind them. The analysis is based
on Opazo, Raddatz, and Schmukler (2015),
which used unique monthly asset-level data
on Chilean domestic bond mutual funds,
pension funds, and insurance companies during 2002–08. This was a period with stable
growth in capital markets and in overall
economy and is thus ideal for investigating
the extent to which these nonbank financial
institutions invest long term as the global crisis did not hit Chile until 2009. In addition,
because these investors operate in the same
GLOBAL FINANCIAL DEVELOPMENT REPORT 2015/2016
macroeconomic and institutional environment and have access to the same set of instruments, their comparison allows observation of their different behavior. The data on
Chilean mutual funds’ and insurance companies’ holdings came from the Chilean Superintendency of Securities and Insurance. The
data on Chilean pension funds came from the
Chilean Superintendency of Pensions.
Although the private pension industry in
developing countries is typically small—mandatory state-owned pension schemes dominate the landscape—a few economies such
as Chile have large pension systems covering
most workers. Chile was the first country to
adopt, in 1981, a mandatory, privately managed defined contribution (DC) pension fund
model by replacing the old public defined benefit (DB) system. Since then, pension funds
have become very large, holding most of the
population’s long-term retirement savings.
Chile also has developed other institutional
investors and has provided a stable macroeconomic and institutional framework for longterm financing to flourish. On the demand
side of funds, Chile introduced several reforms
to foster capital market development, leading
to a varied range of securities issued, including
FINANCIAL INSTITUTIONS AS PROVIDERS OF LONG-TERM FINANCE
long-term local currency and inflation-indexed
bonds. Many high-income and developing
countries have followed the Chilean example
and have reformed their pension regimes,
shifting away from DB schemes toward privately managed DC plans (Antolín and Tapia
2010; OECD 2013b). Figure 4.4 shows that
the DC system is the most-used scheme nowadays in many members of the OECD.
The kind of regulations adopted in the
Chilean pension fund system are not Chilespecific and are typical of systems that have
DC pension programs, where the regulator
wants to ensure the safety of public savings.
For example, the Chilean regulation establishes a minimum return band that pension
funds must guarantee. This type of guarantee is common in Latin American countries,
and it also has been used in Central European
countries (Castañeda and Rudolph 2010) and
in high-income countries (Antolín and others
2011). Chile, therefore, stands as a benchmark case, and the numerous challenges faced
by the Chilean policy makers shed light on the
difficulties of developing long-term financial
markets.
The Chilean evidence challenges the expectation that institutional investors across the
FIGURE 4.4 Relative Shares of Defined Benefi t and Defined Contribution Pension Fund Assets in Selected
Countries, 2013
Share of total pension fund assets, %
100
80
60
40
20
Cz
ec
h R Chil
ep e
ub
Es lic
to
ni
Fra a
nc
Gr e
ee
Hu ce
ng
ar
Sl
ov Po y
ak la
Re nd
pu
Sl blic
ov
e
De nia
nm
ar
k
Ita
Au ly
str
ali
Ne Me a
w xic
Ze o
ala
n
Ice d
lan
Un S d
ite pa
d S in
ta
te
Tu s
rke
y
Ko Isra
re el
Lu a, R
xe ep
mb .
o
Po urg
rtu
g
Ca al
na
d
Fin a
lan
Ge d
Sw rma
itz ny
er
lan
d
0
Defined contribution
Defined benefit / Hybrid-mixed
Source: OECD 2014b.
Note: Selected countries are members of the OECD. For the United States and Canada, data refer to occupational pension plans only. For Luxembourg,
data refer to pension funds under the supervision of the Commission de Surveillance du Secteur Financier (CSSF) only.
115
116
FINANCIAL INSTITUTIONS AS PROVIDERS OF LONG-TERM FINANCE
FIGURE 4.5 Differing Maturity Structures of Chilean Institutional
Investors
a. Share of total portfolio
45
Share of total portfolio, %
40
35
30
25
20
15
10
5
0
<1
1–3
3–5
5–7
7–10
10–15
15–20
20–30
Years to maturity
Insurance
companies
Domestic
mutual funds
Pension fund
administrators
b. Average maturity, years
Insurance companies
Domestic mutual funds
Pension fund administrators
9.77
3.97
4.36
Source: Opazo, Raddatz, and Schmukler 2015.
Note: The maturity structure is calculated for each mutual fund, insurance company, and pension
fund administrator at each moment in time using monthly bins. Then the maturities are averaged
across each set of investors and then averaged over time. The sample period is September 2002
to June 2008.
board would help lengthen the maturity structure and raises the question of what lies behind
their short-termism. While the presence of
these investors has played an important role in
improving market depth and in increasing private savings, their contribution to the lengthening of financial contracts seems limited.6 In
particular, the evidence shows that Chilean asset-management institutions (mutual and pension funds) hold a large amount of short-term
instruments and overall invest shorter term
relative to insurance companies (figure 4.5).
Both mutual funds and pension funds invest
more than half of their portfolios in maturities of three years or less, whereas insurance
companies invest a little more than one-third
of their portfolios in these shorter-term maturities. The differences are even starker at the
longer maturities. As a result, average maturity for insurance companies (9.77 years) is
more than double that of mutual funds (3.97
years) and pension funds (4.36 years). Relative to outstanding bonds, mutual and pension
funds also invest shorter term.
GLOBAL FINANCIAL DEVELOPMENT REPORT 2015/2016
The short-termism of pension funds is not
constrained by the supply side of instruments.
Chilean asset managers choose short-term
instruments even when assets for long-term
investments are widely available and held by
other investors. In particular, pension funds
do not exhaust the supply of long-term government and corporate debt instruments.
Moreover, individual biddings at government
paper auctions suggest that pension funds bid
less aggressively for long-term instruments,
both relative to other instruments and relative
to insurance companies.
The incentives faced by these investors appear to be essential to understanding their
different preferences for debt maturity structures. In this sense, the comparison between
insurance companies and pension funds is
particularly illustrative because, in principle,
both should be long-term investors. Insurance companies provide mainly long-term
annuities for retirement, while pension funds
invest for the retirement of their affiliates. Indeed, upon retirement individuals can choose
between buying an annuity or keeping their
assets in a pension fund and gradually drawing the principal according to a program
that considers expected longevity. Despite
the similarity in their implicit operational
goals, given their different natures (open- and
closed-end) and the monitoring exercised by
the underlying investors and the regulator,
these intermediaries face very different incentives, which lead to different maturities profiles. These incentives are analyzed in more
detail in box 4.3.
The short-termism of pension funds has important consequences for future pensions. In
fact, some discussions have started to emerge
in Chile and elsewhere (BIS 2007a; The
Economist 2014a) about their pension system
and how to reform it given the lower-thanexpected replacement rates. According to some
estimates, the amount in the average 65-yearold pensioner’s account is $55,000. With
an expected remaining life of 15 years, that
amount is equivalent to about $310 a month,
or one-third of the average salary in Chile.
Chile’s experience shows that the development of large and sophisticated intermediaries with deep pockets does not guarantee
GLOBAL FINANCIAL DEVELOPMENT REPORT 2015/2016
BOX 4.3
FINANCIAL INSTITUTIONS AS PROVIDERS OF LONG-TERM FINANCE
What Drives Short-Termism in Chilean Mutual and Pension Funds?
Although identifying the ultimate underlying factor
is difficult, the shorter investment horizon of Chilean
open-end mutual and pension funds compared with
insurance companies seems to result from agency factors that tilt managerial incentives.a In Chile, managers of open-end funds are monitored in the short run
by the underlying investors, the regulator, and the
asset-management companies. This short-run monitoring, combined with the risk profile of the available
instruments, generates incentives for managers to be
averse to investments that are profitable at long horizons (such as longer-term bonds) but that can have
poor short-term performance. In contrast, insurance companies are not open-end asset managers,
receive assets that cannot be withdrawn in the short
run, and have long-term liabilities because investors
acquire a defi ned benefit (DB) plan when purchasing
a policy. Thus, insurance companies are not subject
to the same kind of short-run monitoring.
In the case of mutual funds, their short-termism is
driven mainly by the short-term monitoring exercised
by the underlying investors. In particular, Chilean
mutual funds are subject to significant redemptions
related to short-run performance. For example, during the 2002–08 period, mutual funds in Chile were
exposed to much greater outflows than were mutual
funds in the United States. This short-run monitoring
might explain why these funds avoid investing in longterm bonds, which may have poor short-term performance, and prefer to invest in shorter-term bonds.
Because saving for retirement is mandatory, flows
to pension funds tend to be very stable, even during
crises. That is, unlike mutual funds, pension funds
are not exposed to significant outflows. Nevertheless, within the same pension fund, investors might
transfer funds across different fund managers seeking higher performance. Da and others (2014) showed
that, in Chile, individuals often reallocate their
investments between riskier funds (holding mostly
stocks) and funds that hold mostly risk-free government bonds. Pension fund contributors, in an apparent effort to “time the market,” frequently switch
within funds following the recommendations issued
by a popular investment advisory fi rm. In response
to this behavior, pension fund managers have significantly reduced their holdings of stocks and bonds and
have replaced them with cash to avoid costly redemptions resulting from frequent portfolio rebalancing.
The regulatory scheme seems to be another factor behind the short-termism of pension funds. The
Chilean regulation establishes a lower threshold
of returns over the previous 36 months that each
pension fund needs to guarantee. This type of
short-term monitoring seems to push managers to
move their investments into portfolios that try to
minimize the probability of triggering the guarantee (Randle and Rudolph 2014). Moreover, because
this threshold depends on the average return of the
market, it may generate incentives to herd (Raddatz
and Schmukler 2013; Pedraza, forthcoming) and
to allocate portfolios suboptimally (Castañeda and
Rudolph 2010).
The minimum return rate might be driving the
equilibrium toward the short term because, even
when a manager’s portfolio is close to that of peers,
small differences in holdings of more volatile longerterm securities may increase the manager’s exposure
to the peer-based performance penalty. Moreover,
to the extent that longer-term bonds are less liquid,
these bonds might be harder to rebalance because
traders may find it difficult to either enter or exit
these positions at their requested price, experience
execution delays, or receive a price at execution significantly different from their requested one. Therefore, longer-term bonds might hamper the ability
to follow the changes of the market, increasing the
exposure to the peer-based penalty.
Whereas this type of short-run monitoring can
play a role in open-end funds, it is unlikely to affect
insurance companies. These companies are not evaluated on a short-term return basis by investors who
can redeem their shares on demand, and the companies are not required to be close to the industry
at each point in time. Instead, the maturity structure of the insurance companies’ assets seems to
be determined by that of their liabilities. Insurance
companies have long-term liabilities because they
mostly provide annuities to pensioners. Thus, the
need to meet these liabilities gives them incentives to
hold long-term assets. In contrast, mutual funds and
pension funds are pure asset managers and have no
liabilities beyond their fiduciary responsibility.
In sum, the long-term nature of their liabilities
shapes the incentives of the insurance companies
toward portfolios with longer maturities. In contrast,
given the lack of a liability structure, the incentives
of Chilean pension and mutual funds to take maturity risk are determined mainly by the constant monitoring exerted by the underlying investors, their own
companies, and the regulator.
a. See Opazo, Raddatz, and Schmukler (2015) for a more detailed analysis.
117
118
FINANCIAL INSTITUTIONS AS PROVIDERS OF LONG-TERM FINANCE
an increased demand for long-term assets.
Merely establishing asset management institutions and assuming that managers will invest long term does not appear to yield the
expected outcome, especially if the policy
contexts involve a similar type of market
and regulatory short-term monitoring to that
in Chile. For pension funds, Chilean policy
makers have tried unsuccessfully to make
the system more conducive to long-term investments. For example, in October 1999 the
average real rate of returns for calculating
FIGURE 4.6 Worldwide Total Net Assets Held by Mutual Funds
by Degree of Development and Region
2,500
100
2,000
80
1,500
60
1,000
40
500
20
0
Share of total assets, %
U.S. dollars, billions
a. By degree of development
0
2006
2007
2008
2009
Assets under management,
developing countries
2010
2011
2012
Developing
countries
(right axis)
2013
High-income
countries
(right axis)
b. By region
24%
31%
50%
32%
13%
15% 16%
7%
11%
1%
Europe
Asia and Pacific
United States
Americas (excluding
United States)a
Africa
Luxembourg
France
Ireland
United Kingdom
Other European countries
Source: Investment Company Fact Book 2014, Investment Company Institute, Washington, DC,
.
Note: The sample period for panel b is 2013. The classification between high-income and developing countries is based on the World Bank classification of countries as of 2012.
a. Argentina, Brazil, Canada, Chile, Costa Rica, Mexico, and Trinidad and Tobago.
GLOBAL FINANCIAL DEVELOPMENT REPORT 2015/2016
the minimum return that pension funds must
guarantee was changed from 12 months to
the current 36 months, presumably giving
pension funds more flexibility to deviate in
the short term from their peers and to invest
longer term. The change did not have the
expected result, however, and the maturity
structure of pension funds did not vary significantly. Alternative performance measures
based on risk-adjusted returns, as opposed to
peer-based benchmarks, should be more conducive to lengthening the maturity structure
of pension funds’ portfolios and at the same
time should eliminate some of the pervasive
incentives that lead to herding among these
managers. The regulatory authority needs to
focus on aligning the long-term objectives
of the fund contributors with the sometimes
short-term objectives of fund managers.
INTERNATIONAL EVIDENCE ON
MUTUAL FUNDS
Although the mutual fund industry has been
growing in developing countries during the
last decade, it is still dominated by highincome countries. Assets under management
of mutual funds domiciled in developing countries more than doubled between 2006 and
2013. However, these still represent a small
fraction of mutual funds’ assets worldwide:
funds in high-income countries controlled
over 90 percent of mutual fund assets, with
more than $28 trillion under management in
2013 (figure 4.6a). The regional distribution
also remains highly uneven, with the United
States accounting for half of the total assets
worldwide and a couple of European countries accounting for almost one-third (figure
4.6b). Still, in some developing countries, such
as Brazil, the mutual fund industry has been
growing fast and is rather large.
In recent years, the importance of international mutual funds has been growing.7 This
growth is attributable mainly to investors in
high-income countries who have increasingly
sought to diversify their portfolios by investing in other countries, including developing ones, often through dedicated emerging
markets funds or through increased emerging
market participation by globally active funds
GLOBAL FINANCIAL DEVELOPMENT REPORT 2015/2016
(Gelos 2011). This trend coincides with an
extended period of low interest rates in highincome countries, which has led investors to
look for higher-yielding assets in developing
countries. Emerging Portfolio Fund Research
(EPFR) data show that assets under management of emerging markets’ equity funds increased from $702 billion at the end of 2009
to $1.1 trillion at the end of 2013, and bond
funds quadrupled from $88 billion to $340
billion over the same period (Miyajima and
Shim 2014).
Given the limited size of the mutual fund
industry in developing countries, this section
aims to shed some light on the role that international mutual funds from high-income
BOX 4.4
FINANCIAL INSTITUTIONS AS PROVIDERS OF LONG-TERM FINANCE
119
countries might play in lengthening the maturity structure of financial contracts in developing countries. In particular, this section explores the role that international funds from
the United States and the United Kingdom
might play in lengthening the maturity structure of financial contracts in both developing
and other high-income countries. Throughout
the section, only fixed-income mutual funds
are considered. Although equity funds are
also a source of long-term financing and play
an important role in stock markets (box 4.4),
the analysis focuses exclusively on bond funds
to be able to compute the maturity structure
of the funds’ portfolio and to make comparisons across countries.
Institutional Investors in Equity Markets
In both high-income and developing countries, equity
fi nancing plays a smaller role in fi rms’ funding than
do bond issuances and syndicated loans (chapter 3).
Still, a developed and liquid stock market is expected
to play a key role by creating and aggregating information about economic activity and firms’ fundamentals. According to this view, stock prices aggregate information from many market participants,
information that in turn might be useful for fi rms’
managers and other decision makers such as capital
providers and regulators (Bond, Edmans, and Goldstein 2012). In this sense, stock markets can facilitate
fi rms’ access to credit by reducing information asymmetries between capital providers and fi rms.
Institutional investors might contribute importantly to information production in stock markets.
That is, besides the direct contribution to firms’ equity
financing, some empirical evidence indicates that
institutional activity in equity markets results in better monitoring of corporations and in better corporate
governance structures (Gillan and Starks 2000). For
example, foreign institutional investors from countries with strong shareholder protection appear to
promote good corporate governance practices around
the world (Aggarwal and others 2011). Alternatively,
the presence of institutional investors in a stock might
increase the exposure of the firm to capital providers,
thereby improving its ability to raise funds.
The relationships between the share of institutional investors’ equity ownership and three measures
of stock market development—market capitalization,
turnover, and price informativeness (a measure of the
information content of stock prices)—are presented
in table B4.4.1. According to the table, the presence of domestic and foreign institutional investors
is positively correlated with market size and liquidity. Moreover, in both high-income and developing
countries, a greater presence of institutional investors is positively associated with more informative
prices, consistent with the idea that institutions, as
opposed to retail investors, have a greater capability
to gather private information and that their presence
facilitates information aggregation into stock prices.
The table also shows a negative relationship between
institutional ownership concentration and the different measures of stock market development. For
instance, countries with high levels of concentration
in institutional equity ownership exhibit lower trading volumes (figure B4.4.1).
When the concentration of institutional ownership
is high, these institutions effectively become corporate insiders, a situation that discourages the participation of other equity investors and that undermines
liquidity. Concentration also leads to market power
and hence the ability to trade without affecting
prices. Additionally, in smaller markets, domestic
institutional investors are more likely to have different ties to local publicly traded companies, whether
directly or indirectly (they might belong to the same
economic group, for example, or the firm might
(box continued next page)
FINANCIAL INSTITUTIONS AS PROVIDERS OF LONG-TERM FINANCE
BOX 4.4
GLOBAL FINANCIAL DEVELOPMENT REPORT 2015/2016
Institutional Investors in Equity Markets (continued)
TABLE B4.4.1 Stock Market Development and Institutional Investors, 2000–11
High-income countries
Countries sorted by
Developing countries
Below median
Above median
Below median
Above median
Foreign institutional ownership
Turnover/market capitalization
Market capitalization/GDP
Price informativeness
71.8
64.4
65.5
94.9
86.8
90.1
41.3
42.1
15.2
55.7
45.5
39.5
Domestic institutional ownership
Turnover/market capitalization
Market capitalization/GDP
Price informativeness
46.0
56.3
32.5
100.1
86.3
96.5
39.8
36.3
18.2
60.6
67.1
38.5
Institutional ownership concentration
Turnover/market capitalization
Market capitalization/GDP
Price informativeness
98.9
90.9
88.1
67.5
58.2
67.2
55.6
43.4
45.5
43.0
39.7
12.5
Sources: Global Financial Development Database, World Bank, Washington, DC, Institutional
Ownership Database, FactSet, Norwalk, CT, .
Note: This table reports the averages of three measures of stock market development, sorted by institutional investors’ presence.
FIGURE B4.4.1 Trading Volume versus Institutional Concentration, 2000–11
200
150
100
50
0
0.2
a. High-income countries
United States
Spain
Italy United Kingdom
Netherlands
Germany
Sweden
Finland
Norway
Japan
Switzerland
France
Australia
Denmark
Canada
Singapore
Israel Portugal
GreeceNew Zealand
Ireland Austria Belgium
Luxembourg
0.3
0.4
0.5
Institutional ownership concentration
b. Developing countries
100
0.6
receive lending through a bank member of the same
fi nancial conglomerate as the institutional investor).
Such relationships can be additional sources of asymmetric information, which would reduce trading in
the stock. In all these cases, stock prices might be
more opaque and less likely to reflect fundamentals.
In summary, the extent to which institutional
investors produce information in equity markets
seems to depend on the market structure. Policy
Stock market turnover to market
capitalization, %
250
Stock market turnover to market
capitalization, %
120
Thailand
80
Hungary
Russian Federation
Czech Republic
South Africa
Indonesia
Brazil
40
Poland
Malaysia
Mexico
Philippines
20
Chile
Colombia
Peru
60
0
0.3
0.4
Morocco
0.5
0.6
0.7
0.8
Institutional ownership concentration
0.9
makers could focus not only on strengthening the
investors’ bases but also on improving the level
of competition in their respective markets. For
instance, stock markets with large but few dominant
institutional investors might end up producing little
valuable information about fundamentals. After all,
well-functioning and competitive stock markets are
expected to benefit long-term fi nance and economic
activity, both directly and indirectly.
Sources: Global Financial Development Database, World Bank, Washington, DC, and Institutional Ownership Database, FactSet, Norwalk, CT, .
Note: This figure shows the relationship between stock trading volume and institutional equity ownership concentration for high-income and developing countries.
Concentration is measured as the percentage of domestic equity holdings of the largest five institutional investors.
GLOBAL FINANCIAL DEVELOPMENT REPORT 2015/2016
The data come from various sources. Fundlevel data on mutual fund holdings come from
Morningstar Direct and include the holdings
of international mutual funds (Global Fixed
Income and Emerging Markets Fixed Income
funds) from the United States and the United
Kingdom, as well as holdings of mutual funds
set up to invest domestically (Domestic Fixed
Income funds) for several developing and
high-income countries for 2013.8 The section
also examines information on outstanding
corporate and sovereign bonds to benchmark
the mutual fund holdings. The data on corporate bonds come from the Thomson Reuters
FINANCIAL INSTITUTIONS AS PROVIDERS OF LONG-TERM FINANCE
SDC Platinum database.9 The data on outstanding sovereign bonds come from the BIS.
The investments of international mutual
funds from the United States and from the
United Kingdom are very similar, and thus the
following analysis pools the funds from both
countries. U.S. mutual funds invest 55 percent
in high-income countries outside the United
States, 35 percent in developing countries,
and the rest in domestic bonds (figure 4.7a).
Similarly, U.K. mutual funds invest 65 percent
in high-income countries outside the United
Kingdom, 20 percent in developing countries,
and the rest in domestic bonds. Regionally,
FIGURE 4.7 Shares and Average Maturity of Investments of U.S. and U.K. Mutual Funds, 2013
b. By region
14
12
12
Average maturity, years
Average maturity, years
a. By degree of development
14
10
8
6
4
10
8
6
4
2
2
0
0
High-income
countries
(except domestic)
Developing
countries
Africa
Domestic
investments
Asia
Australia
Europe
Latin
(except U.K.) America
and the
Caribbean
c. By issuer type
14
Average maturity, years
12
10
8
6
4
2
0
Agency
Corporate
Sovereign
U.S. funds
Subsovereign
Supranational
U.K. funds
Sources: Calculations based on data from Morningstar, Chicago, IL, ; and DataStream (database), Thomson Reuters, New
York City, NY, />Note: This figure shows the portfolio shares and average maturities of global and emerging markets fixed income mutual funds from the United States
and the United Kingdom in high-income and developing countries. The size of each bubble represents the portfolio share invested in each set of countries
(panels a and b) or issuer type (panel c).
121
122
FINANCIAL INSTITUTIONS AS PROVIDERS OF LONG-TERM FINANCE
GLOBAL FINANCIAL DEVELOPMENT REPORT 2015/2016
a. Top 2 industries
100
12
80
10
60
8
6
40
4
20
0
2
High-income Developing
U.S. and
countries
countries
U.K.
(except U.S.
and U.K.)
Public administration
High-income Developing
U.S. and
countries
countries
U.K.
(except U.S.
and U.K.)
Finance, insurance, and real estate
High-income
countries
(except U.S.
and U.K.)
Developing
countries
U.S. and
U.K.
0
Other
b. Rest of top 5 industries
60
14
50
12
40
10
30
8
6
20
4
10
0
Average maturity, years
14
2
High-income
countries
(except U.S.
and U.K.)
Developing
countries
U.S. and
U.K.
High-income
countries
(except U.S.
and U.K.)
Manufacturing
Developing
countries
U.S. and
U.K.
Mining
Portfolio share
High-income Developing
U.S. and
countries
countries
U.K.
(except U.S.
and U.K.)
Transportation, communications, electric,
gas, and sanitary services
Average maturity, years
Share of mutual fund investments,
% of “other” industries
Share of mutual fund investments, %
FIGURE 4.8 Shares and Average Maturity of U.S. and U.K. Mutual Funds by Industry, 2013
0
Average maturity (right axis)
Sources: Calculations based on data from Morningstar, Chicago, IL, ; and DataStream (database), Thomson Reuters, New York City, NY, http://
thomsonreuters.com/en/products-services/financial/investment-management/datastream-professional.html.
Note: This figure shows the portfolio shares and average maturities of global and emerging markets fixed income mutual funds from the United States and the United Kingdom in
high-income and developing countries by the issuer’s industry.
U.S. and U.K. mutual funds both invest half
of their portfolio in Europe (excluding the
United Kingdom), around one-third in Asia,
and almost one-fifth in Latin America and the
Caribbean (figure 4.7b). Moreover, U.S. and
U.K. funds both invest heavily in sovereign
bonds (almost 70 percent), followed by corporate bonds from financial and nonfinancial
firms (figure 4.7c). The maturity structure of
their investments is also similar.10 Given these
similarities, the following analysis pools the
funds from both countries.
U.S. and U.K. mutual funds invest longer
term in developing than in high-income countries. Overall, the average maturity of U.S.
and U.K. funds is about 6.4 years in highincome countries and almost 8.0 years in developing countries. These results hold regardless of the industry. The principal industry in
which U.S. and U.K. funds invest is, by far,
public administration: 80 percent of their assets are invested in this category in developing countries and 70 percent in high-income
countries (figure 4.8a). Within this category,
GLOBAL FINANCIAL DEVELOPMENT REPORT 2015/2016
they invest longer term in developing countries (7.7 years) than in high-income ones (6.9
years). Finance, insurance, and real estate is
the second industry in which U.S. and U.K.
funds invest more, but there are important
differences between high-income and developing countries: for high-income countries, they
invest more than 25 percent of their holdings
in this category, while for developing countries they invest only 7 percent. Given that
this industry has a lower average maturity (for
both high-income and developing countries),
the larger weight assigned to this category in
high-income countries also helps explain the
longer average maturity of U.S. and U.K. investments in developing countries. Investment
patterns in other industries are shown in figure 4.8b. Once again in each of these industries the average maturities of U.S. and U.K.
mutual funds’ investments are longer in developing than in high-income countries.
In the vast majority of countries analyzed,
U.S. and U.K. mutual funds invest longer term
FINANCIAL INSTITUTIONS AS PROVIDERS OF LONG-TERM FINANCE
in sovereign bonds than in corporate bonds.
Overall, for the countries depicted in the scatter plot shown in figure 4.9a, the average
maturity of U.S. and U.K. funds is 8.6 years
for sovereign bonds and 7.1 years for corporate bonds. This pattern is consistent with the
fact that the average maturity of outstanding
sovereign bonds is typically longer than that
of corporate bonds (figure 4.9b). Given these
differences, when comparing the maturity
structure across international and domestic
funds, the analysis separates between the corporate and sovereign case.
The evidence suggests that international
mutual funds help lengthen the maturity
structure of corporate bonds in developing
and high-income countries. For most of the
countries analyzed, U.S. and U.K. funds invest longer term than the average maturities
of the outstanding corporate bonds in the
countries in which they invest (figure 4.10a).11
This finding is consistent with evidence that
foreign corporate issuances from developing
FIGURE 4.9 Average Maturity by Country and Issuer Type, 2013
b. Outstanding bonds
20
18
18
16
Average maturity of sovereign bonds, years
Average maturity of sovereign bonds, years
a. U.S. and U.K. mutual funds holdings
20
U.K.
14
12
U.S.
10
8
6
4
2
16
14
U.K.
12
10
8
6
4
U.S.
2
0
0
0
2
4
6
8
10
12
14
16
18 20
Average maturity of corporate bonds, years
Asia
Europe
0
2
4
6
8
10
12
14
16
18
20
Average maturity of corporate bonds, years
Latin America and the Caribbean
Other
Sources: Calculations based on data from SDC Platinum (database), Thomson Reuters, New York City, NY, />-services/financial/investment-banking-and-advisory/sdc-platinum.html; Debt Security Statistics (database), Bank for International Settlements, Basel,
Morningstar, Chicago, IL, ; and DataStream (database), Thomson Reuters, New
York City, NY, />Note: Panel a shows the average maturity, by country, of sovereign and corporate bonds held by global and emerging markets fixed income mutual
funds from the United States and the United Kingdom. Only countries with more than 30 observations in both the sovereign and corporate category are
included. Panel b shows the average maturity of outstanding sovereign and corporate bonds by country.
123
FINANCIAL INSTITUTIONS AS PROVIDERS OF LONG-TERM FINANCE
GLOBAL FINANCIAL DEVELOPMENT REPORT 2015/2016
FIGURE 4.10 Average Maturity of U.S. and U.K. Mutual Funds Compared with Outstanding Bonds
by Country, 2013
a. Corporate bonds
b. Sovereign bonds
20
Average maturity of outstanding bonds, years
20
Average maturity of outstanding bonds, years
124
18
16
14
12
10
U.S.
8
U.K.
6
4
2
18
U.K.
16
14
12
10
8
6
U.S.
4
2
0
0
0
2
4
6
8
10
12
14
16
18
20
Average maturity for U.S. and U.K. mutual funds, years
Asia
Europe
0
2
4
6
8
10
12
14
16
18
20
Average maturity for U.S. and U.K. mutual funds, years
Latin America and the Caribbean
Other
Sources: Calculations based on data from SDC Platinum (database), Thomson Reuters, New York City, NY, />-services/financial/investment-banking-and-advisory/sdc-platinum.html; Debt Security Statistics (database), Bank for International Settlements, Basel,
Morningstar, Chicago, IL, ; and DataStream (database), Thomson Reuters,
New York City, NY, />Note: Panel a compares, by country, the average maturity of corporate bonds held by global and emerging markets fixed income mutual funds from the
United States and the United Kingdom to the average maturity of the outstanding corporate bonds in the countries in which they invest. Panel b makes
the same comparison for sovereign bonds. Only countries with more than 30 observations in both the sovereign and corporate category are included.
countries tend to be longer-term than domestic issuances (chapter 3), signaling that firms
in developing countries might find it easier
to obtain long-term financing from foreign
investors than from domestic ones. Moreover, this finding suggests that international
mutual funds could play some role in extending the maturity structure of the countries in
which they invest. Unlike the corporate case,
however, the evidence is mixed for sovereign
bonds. That is, it is not clear whether U.S.
and U.K. funds can extend the maturity structure of these bonds (figure 4.10b).12
The analysis then compares the maturity
structure of U.S. and U.K. international mutual funds with that of domestic mutual funds
from developing and high-income countries.
It first compares by country the entire portfolio of international mutual funds and domestic funds and then compares separately
sovereign and corporate bonds holdings. In
the latter case, the average maturities of the
portfolios are benchmarked with the maturities of the outstanding bonds.
For developing countries, the comparison suggests that foreign funds invest longer
term than domestic ones when investing in
the same domestic debt instruments. The results show that U.S. and U.K. mutual funds
invest significantly longer than the Chilean,
Mexican, and South African domestic mutual funds (figure 4.11a). For example, the
average maturity of U.S. and U.K. mutual
funds in Chilean (Mexican) bonds is 7.6 (9.4)
years, while the average maturity of domestic
Chilean (Mexican) funds is 4.8 (3.1) years.
In the case of Brazil, the domestic funds invest slightly longer than U.S. and U.K. funds
(10.1 and 9.4 years, respectively). However,
as discussed later, the higher average maturity of Brazilian funds is explained entirely by
their sovereign bonds purchases: if only corporate bonds are considered, U.S. and U.K.
mutual funds invest significantly longer than
GLOBAL FINANCIAL DEVELOPMENT REPORT 2015/2016
FINANCIAL INSTITUTIONS AS PROVIDERS OF LONG-TERM FINANCE
FIGURE 4.11 Comparison of Average Maturity of U.S. and U.K. Mutual Funds to Domestic Mutual Funds,
2013
a. Entire portfolio
Average maturity, years
14
12
10
8
6
4
2
0
Brazil
Chile
India
Mexico
South
Africa
Australia
Hong Kong
SAR, China
New
Zealand
Korea, Rep.
c. Sovereign bonds
14
14
12
12
Average maturity, years
10
8
6
4
2
10
6
4
2
p.
Re
l
re
a,
ae
Isr
ali
str
Au
Ko
So
a
ca
ut
hA
fri
ico
az
Br
ex
il
p.
Re
nd
re
Ko
Ne
w
a,
ala
ina
ae
Ze
Isr
a
Ch
ali
R,
Ho
ng
Ko
ng
SA
Au
str
fri
ico
So
ut
hA
il
az
ex
M
Br
l
0
ca
0
8
M
Average maturity, years
b. Corporate bonds
Israel
Outstanding bonds
Domestic funds
U.S. and U.K. funds
Sources: Calculations based on data from SDC Platinum (database), Thomson Reuters, New York City, NY, />-services/financial/investment-banking-and-advisory/sdc-platinum.html; Debt Security Statistics (database), Bank for International Settlements, Basel,
Morningstar, Chicago, IL, ; and DataStream (database), Thomson Reuters,
New York City, NY, />Note: This figure compares, by economy, the average maturity of global and emerging markets fixed income mutual funds from the United States and the
United Kingdom with that of domestic mutual funds and outstanding bonds. Only domestic bonds are included in the portfolio of the domestic mutual
funds.
Brazilian funds. The only developing country
in the sample in which domestic funds invest
significantly longer term is India. Similar to
Brazil, however, the Indian funds in the sample only purchase sovereign bonds (which are
longer term in the Indian case) while the U.S.
and U.K. funds invest more heavily in Indian
corporate bonds.
The comparison of U.S. and U.K. mutual
fund investment with that of local funds in
other high-income economies shows similar
patterns: U.S. and U.K. funds typically invest
longer term there as well. In Hong Kong SAR,
China; Israel; and New Zealand, U.S. and
U.K. mutual funds invest longer term than the
domestic mutual funds (see figure 4.11a). For
example, the average maturity of U.S. and
U.K. mutual funds in Hong Kong SAR, China
(Israeli) bonds is 6.0 (9.4) years, while the average maturity for domestic Hong Kong SAR,
China (Israeli) mutual funds is 3.0 (6.0) years.
In the case of the Republic of Korea, the average maturity of U.S. and U.K. funds is similar
to that of Korean funds. Australia is the only
high-income country in the sample in which
the domestic funds invest longer term than
U.S. and U.K. mutual funds.
When considering only corporate bonds,
U.S. and U.K. mutual funds tend to invest
longer term than the average maturities of
125
126
FINANCIAL INSTITUTIONS AS PROVIDERS OF LONG-TERM FINANCE
the domestic funds in the countries in which
they invest. With the exception of Australia
and South Africa, U.S. and U.K mutual funds’
foreign corporate holdings have an average
maturity longer than that of the domestic mutual funds (figure 4.11b). In the cases of Brazil;
Hong Kong SAR, China; Mexico; and New
Zealand, the investments of U.S. and U.K. mutual funds are significantly longer term than
those of the domestic funds. Moreover, the
domestic funds of these four economies have
a shorter average maturity than that of the
outstanding corporate bonds, while U.S. and
U.K. investments are longer. These patterns
suggest that foreign investors might be an avenue through which to extend debt maturities.
For sovereign bonds, U.S. and U.K. mutual
funds do not seem to invest longer term than
the domestic funds in the countries in which
they invest. Unlike the corporate case, the evidence is mixed, and it is not clear whether international funds can be an avenue to extend
the maturity structure of sovereign bonds. In
this case, U.S. and U.K. funds invest longer
term than the domestic funds only in Israel
and Mexico. In Australia, Brazil, Korea, and
South Africa, they invest shorter term (figure
4.11c).13 Nevertheless, in Israel and Mexico,
where domestic funds invest shorter term
than the average maturity of the outstanding
sovereign bonds, while U.S. and U.K funds
invest longer term, the role of international
funds might still be important. In addition, in
Brazil, U.S. and U.K. funds still have a longer
average maturity than that of the outstanding
sovereign bonds, and thus may still contribute
to lengthening their average maturity.
Summing up, mutual funds from international financial centers seem to play some role
in extending the maturity structure of corporate bonds in developing and other highincome countries. Although the evidence presented here does not imply causality, it does
suggest that fostering foreign institutional investors might be one avenue for extending the
maturity profile of debt. One potential reason
for this behavior is that international mutual
funds might be willing to take the higher risk
of investing more long-term given their larger
size and their ability to diversify this risk by
GLOBAL FINANCIAL DEVELOPMENT REPORT 2015/2016
investing in different countries around the
world. In addition, according to the Chilean
evidence presented earlier, domestic funds
in developing countries might be subject to
larger outflows related to performance, and
so they might have incentives to hold a higher
proportion of short-term instruments. At the
same time, given that international mutual
funds do not seem to invest more long-term in
the case of sovereign bonds, the evidence simply might be reflecting differences in the attributes (size or asset tangibility) of the firms
in which they invest. For example, because
of information asymmetries, the domestic
funds might be providing finance to smaller
firms that are not able to raise funds in international markets or that are not targeted
by foreign investors, and these firms might be
raising bonds at shorter maturities.14 Nevertheless, even if differences in firm characteristics explain part of the results, the evidence
presented here, together with the fact that
foreign corporate issuances from developing countries are of longer-term nature than
domestic issuances (chapter 3), indicates that
firms in developing countries find it easier to
obtain long-term financing from foreign investors. The analysis presented in this chapter
does not explore these potential explanations,
and much more work is needed in this regard.
SOVEREIGN WEALTH FUNDS
Sovereign wealth funds (SWFs) are a large and
growing class of institutional investors. SWFs
are state-owned funds that invest sovereign
revenues in real and financial assets, typically
with the aim of diversifying economic risks
and managing intergenerational savings. Currently, all SWFs combined have an estimated
$6.6 trillion under management (Gelb and
others 2014)—more than twice the amount
managed by all hedge funds combined. The
assets managed by SWFs have been growing
rapidly and have increased more than 10-fold
over the past two decades. Excluding SWF
home economies, SWF investments could account for more than 10 percent of GDP in
many developing economies of Africa, Eastern
Europe, and Latin America, and for up to 1–2
GLOBAL FINANCIAL DEVELOPMENT REPORT 2015/2016
FINANCIAL INSTITUTIONS AS PROVIDERS OF LONG-TERM FINANCE
percent of the market capitalization of traded
companies in these countries (Curto 2010).
Because SWFs have very low redemption
risk (the risk of investors withdrawing funds),
they are in principle a natural provider of
long-term finance. Many SWFs often have
an explicit mandate to manage intergenerational savings, so they typically also have a
much longer investment horizon than other
investors. As a result, SWFs are better able
to invest in illiquid assets with longer maturities, which in turn can reduce the volatility
of capital flows to the markets in which they
invest. Initially SWF investments were highly
concentrated in traditional asset classes and
high-income countries, but these funds have
been increasingly active in developing economies where they have provided various forms
of long-term financing, either through capital markets or in the form of direct equity
investments.
SWFs have their origins in the need to
manage cyclical state revenues. In many economies, windfall earnings from the discovery of
natural resources increased domestic inflation
and short-term government spending in ways
that proved inefficient or unsustainable in the
long run. To address this problem, sovereign
entities as dissimilar as Saudi Arabia and
Timor-Leste established state funds to set
aside natural resource earnings in a diversified
127
portfolio of investments, whose return would
benefit future generations. It is estimated that
more than 60 percent of current SWF assets
are linked to oil and gas revenues. At the same
time, a number of large SWFs are not linked
to natural resource earnings. Sovereign funds
in China; Hong Kong SAR, China; and Singapore, for example, emerged as a result of persistent trade surpluses and the desire to diversify the resulting foreign currency holdings
away from safe but low-yielding U.S. Treasury bonds (see table 4.2 for an overview of
the world’s largest SWFs). This highlights that
not all SWFs are alike: SWFs have different
funding sources, which in turn result in different investment mandates and governance
structures. Commodity-abundant countries
typically establish SWFs to help stabilize government revenue (stabilization funds) and to
manage these revenues intertemporally (savings funds). Noncommodity SWFs (mostly
coming from East Asia) are funded by transferring assets from international reserves, government budget surpluses, and privatization
revenues. Commodity and noncommodity
SWFs can take the form of pension reserve
funds or of reserve investment corporations.
Pension reserve funds accumulate resources in
the current period to provide for future liabilities related to pensions and social security
(examples include Australia, Chile, New
TABLE 4.2 Sovereign Wealth Funds by Total Assets under Management, 2014
Economy
Norway
United Arab Emirates
Saudi Arabia
China
China
Kuwait
Hong Kong SAR, China
Singapore
China
Singapore
Qatar
Australia
United Arab Emirates
Russian Federation
Russian Federation
Name
Government Pension Fund
Abu Dhabi Investment Authority
SAMA Foreign Holdings
China Investment Corporation
SAFE Investment Company
Kuwait Investment Authority
Hong Kong Monetary Authority Investment Portfolio
Government of Singapore Investment Corporation
National Social Security Fund
Temasek Holdings
Qatar Investment Authority
Australian Future Fund
Abu Dhabi Investment Council
National Welfare Fund
Reserve Fund
Source: Sovereign Wealth Fund Institute, Las Vegas, NV, .
Note: — = not available.
Assets
(billions, $)
Inception
year
878.0
773.0
737.6
575.2
567.9
410.0
326.7
320.0
181.0
173.3
170.0
90.2
90.0
88.0
86.4
1990
1976
—
2007
1997
1953
1993
1981
2000
1974
2005
2006
2007
2008
2008
Origin of funds
Oil
Oil
Oil
Noncommodity
Noncommodity
Oil
Noncommodity
Noncommodity
Noncommodity
Noncommodity
Oil and gas
Noncommodity
Oil
Oil
Oil
FINANCIAL INSTITUTIONS AS PROVIDERS OF LONG-TERM FINANCE
GLOBAL FINANCIAL DEVELOPMENT REPORT 2015/2016
FIGURE 4.12 Targeted Asset Allocation of Selected Sovereign Wealth Funds
100
90
Share of portfolio, %
128
80
70
60
50
40
30
20
10
0
Abu Dhabi
Investment
Authority
Equities
Australian
Future Fund
Debt
Chile ESSF
Real estate
Government of
New Zealand
Singapore Investment Superannuation
Corporation
Fund
Hedge funds
Private equity
Infrastructure
Norway Government
Pension Fund
Other
Sources: Gelb and others 2014; and Sovereign Wealth Fund Institute, Las Vegas, NV, .
Note: The targeted asset allocation is a benchmark portfolio that maximizes expected investment returns subject to the fund’s risk tolerance, taking into
account the uncertainty of inflows (outflows) to (from) the fund. The fund’s portfolio includes not only debt and public equities but also other asset classes
such as real estate, hedge funds, private equity, and infrastructure. Chile ESSF refers to the Chilean Economic and Social Stabilization Fund.
Zealand, and Norway). Reserve investment
corporations will maximize returns on funded
assets subject to risk considerations (examples
include the Singapore Investment Corporation and the Korea Investment Corporation).
Differences in the origins and purposes of
SWFs are reflected in the significant variation of investment behavior across SWFs
(Gelb and others 2014). This variation, in
turn, affects how well-placed different SWFs
are to provide long-term financing and how
likely they are to invest in new markets and
asset classes. The targeted asset allocation of
six leading SWFs is compared in figure 4.12.
The asset allocations plotted in the figure are
benchmark portfolios that maximize expected
investment returns subject to the fund’s risk
tolerance. Reflecting the significant differences
in SWF mandates, risk appetites, and investment horizons, the figure shows striking differences in the targeted holdings of debt versus
equity instruments, as well as in asset classes
with different liquidity and time horizons.
Stabilization funds, such as Chile’s Economic
and Social Stabilization Fund (ESSF), tend to
target a relatively high share of high-liquidity,
low-risk investments. Strategic investors, such
as Singapore’s Temasek, in contrast, target a
higher share of equity investments that are
less liquid and that require greater monitoring
and specialized expertise. As a result, strategic SWFs are much more likely to act as active investors through private or public equity
holdings.
Traditionally, SWFs have invested primarily in liquid assets. In recent years, however,
they have increasingly invested in alternative
assets and asset classes with a longer investment time horizon. Dyck and Morse (2011)
assembled data on the portfolios of all sovereign funds with more than $10 billion in
assets under management and found several
striking results in the portfolio allocation of
these funds. First, the sovereign funds in the
dataset allocate only half of their invested
capital to public equities and hold the remainder in asset classes with a longer-term investment horizon, such as private equity limited
partner positions (29 percent) and real estate
(19 percent). These shares are significantly
higher than comparable figures for banks
and other institutional investors. Second, the
equity holdings of these SWFs are targeted
primarily to sectors with significant demand
GLOBAL FINANCIAL DEVELOPMENT REPORT 2015/2016
for long-term finance, including financial institutions, infrastructure development, and
telecommunications. Sovereign funds tend to
invest actively and often hold equity stakes
of 5 percent or more in their investee companies. Third, SWFs also exhibit severe home
bias in their public and private equity holdings, which is more pronounced when SWFs
are exposed to political influences (Dyck and
Morse 2011; Bernstein, Lerner, and Schoar
2013). Bortolotti and others (2009); Chhaochharia and Laeven (2008); and Bernstein,
Lerner, and Schoar (2013) examined the timing and performance of SWF investments
and found that, on the whole, they tend to
be associated with positive abnormal returns
but with negative returns in the longer run.
This finding suggests that in many cases SWFs
engage in procyclical “trend chasing” rather
than provide long-term finance that reduces
macroeconomic volatility.
As the size and complexity of SWF investment portfolios have grown, one challenge
has been to maintain investment expertise
and returns. That is particularly true for investments in alternative assets, such as private equity, venture capital, and real estate.
SWFs have addressed these diseconomies of
scale in two different ways. At one end of the
spectrum, some large funds avoid investing
in private equity and alternative assets altogether. At the other extreme, some funds have
established specialized units with a mandate
to make equity investments in specific markets, industries, and asset classes. This latter
approach, pioneered by funds such as Singapore’s Temasek and several Middle Eastern funds, is a useful approach for investing
in new asset classes. Greater specialization
is also likely to facilitate direct investments
in developing countries, which often require
greater monitoring and localized expertise.
Although SWF portfolio investments traditionally have been concentrated in highincome countries (often in asset classes with
high liquidity, such as currency and equities), more recently SWFs have increasingly
undertaken investments in developing countries either because they want to diversify
their portfolios and achieve higher returns or
FINANCIAL INSTITUTIONS AS PROVIDERS OF LONG-TERM FINANCE
because they are mandated to invest in their
home economies for economic development
purposes. Such investments have often taken
the form of equity stakes with a long-term investment horizon and have been spearheaded
by funds with local expertise. Examples include investments by Singapore’s Temasek
Holdings in the Indian financial sector, the
Abu Dhabi Investment Authority’s investments in Malaysian land and real estate, and
the Dubai Investment Corporation’s stakes in
the African telecommunications sector. Some
emerging SWFs that are headquartered in developing countries have also undertaken substantial investments in their home economies.
These investments helped finance physical and
social infrastructure, but there are concerns
that they may undermine the goal of economic
stabilization through a diversification of national assets away from the home economy.
SWF investments have been viewed as
a promising source of long-term finance in
many developing countries. This is particularly true in the aftermath of the global financial crisis, which led to a reduction in debt
maturities and capital flows to developing
countries (see chapter 3). In addition to providing a substitute for traditional sources of
long-term finance, the emerging market investments of SWFs have often been geared
toward areas with significant financing gaps,
such as the development of physical and social
infrastructure. Moreover, SWF investments in
developing country infrastructure, health care,
and telecommunications have often been able
to mobilize additional long-term finance from
the private sector. It is estimated that if sovereign funds invested only 1 percent of their
total assets in Sub-Saharan Africa—the world
region where the gap between the supply and
demand for long-term finance is perhaps most
acute—it could mobilize joint investments
of about $420 billion over the 2010–20 decade, enough to account for half of the infrastructure investment required to meet the
Millennium Development Goals (Turkisch
2011). There are several examples of successful co-investments by sovereign funds
and private investors in developing countries.
The China-Africa Development Fund (CAD
129
130
FINANCIAL INSTITUTIONS AS PROVIDERS OF LONG-TERM FINANCE
Fund), for example, is an equity fund that
was established by the Chinese government
but that also engages in fund-raising from
private sector investors. The fund invests in
Chinese enterprises with operations in Africa,
with investments of more than $1 billion. The
investments of this SWF alone are thought
to have facilitated additional investments of
more than $2 billion by Chinese enterprises,
particularly in the agriculture, infrastructure,
energy, and manufacturing sectors across SubSaharan Africa.
The impact of SWF investments in developing countries should not be overstated, however. Despite the overall increase of sovereign
fund investments in developing countries, the
total value of these transactions remains extremely small. The geographical distribution
of sovereign fund deals, summarized in table
4.3, shows that more than 80 percent of all
deals between 2010 and 2013 occurred between high-income countries. Moreover, the
geographical distribution of sovereign fund
deals in developing countries has been very
uneven—more than 77 percent of all SWF
investment in developing countries between
2010 and 2013 was located in East Asia and
Pacific (58 percent) and South Asia (19 percent). Thus, although SWFs have made many
highly visible investments in developing countries, their overall investment patterns are still
heavily concentrated in developed markets, so
despite their different mandate and risk profile, they do not differ very much from other
institutional investors in this respect.
Because SWFs can be susceptible to political influence, transparency and good corporate governance standards can improve the
effectiveness of SWF investment strategies—
especially in developing economies. SWFs
TABLE 4.3 Percentage Share of Sovereign
Wealth Fund Transactions by Level of Economic
Development, 2010–13
Target
Origin
High income
Developing
Total
High income
Developing
Total
80.9
0.8
81.7
14.8
3.3
18.1
95.7
4.1
100.0
Source: Calculations based on data from World Bank.
GLOBAL FINANCIAL DEVELOPMENT REPORT 2015/2016
need legitimacy and credibility so that their
capital is not depleted by the government or
allocated to inefficient investments for political reasons. Some countries have enacted
laws and created institutions to set up sound
corporate governance and investment policies for their funds. The specific procedures
that govern a fund’s asset allocation have to
be tailored to the SWF’s goals. In this context, SWF spending plans should be part of
a coherent policy framework that is flexible
and that is designed to meet unexpected and
large adverse shocks. For instance, TimorLeste’s Petroleum Fund has invested resources
in the country’s electricity grid. The investment mandate might, at the same time, need
to minimize unexpected resource demands
from the government. Transparency and accountability are crucial for the effectiveness of
SWFs. Some funds submit regular reports to
the government or to the public. The Chilean
government, for example, has enacted a fiscal
responsibility law that strengthens the relationship between the fiscal rule and the use of
government savings (Schmidt-Hebbel 2012).
Chile has established two SWFs: the Pension
Reserve Fund (PRF), created to finance the
government’s future pension liabilities, and
the new Economic and Social Stabilization
Fund (ESSF). The law establishes clear procedures for funding these SWFs and specific
rules to deploy resources from them—especially the ESSF. Furthermore, it outlines procedures for the international investment of the
resources held in these funds. The law has also
created an independent committee—the Advisory Financial Committee for Fiscal Responsibility Funds—which provides nonbinding
recommendations to the Ministry of Finance
on fund investment policies and regulations
and publishes an annual report of the financial performance of the SWFs.
Many large SWFs have an explicit mandate
to support the long-run development of their
home economies. SWFs in resource-rich Middle Eastern economies are prominent examples. To achieve this goal, these funds invest a
part of their portfolio in “strategic industries”
at home, with the goal of diversifying their
economies and of reducing the reliance on
GLOBAL FINANCIAL DEVELOPMENT REPORT 2015/2016
natural resources. Table 4.4 provides a list of
the largest SWFs with an explicit domestic investment mandate (Gelb and others 2014). In
recent years, the number of SWFs that invest
in their domestic economies, as well as the
overall volume of such investments, has been
increasing. In many cases, the SWF domestic
investments have provided financing in social
and physical infrastructure, which are of strategic importance for long-run development.
Moreover, in the aftermath of the global financial crisis of 2008–09, many governments
have seen these investments as a useful substitute for other sources of long-term finance
that mitigated the negative consequences of
the global credit crunch.
FINANCIAL INSTITUTIONS AS PROVIDERS OF LONG-TERM FINANCE
131
However, the impact of SWF domestic investments remains highly controversial. There
are two main concerns. On the one hand, sovereign funds may have superior information
and expertise in the domestic economy, allowing them to provide long-term finance to local firms that are financially constrained and
that subsequently perform well. If this view is
correct, the domestic investments of sovereign
funds would be expected to be anticyclical
and directed toward firms that subsequently
outperform their peers. On the other hand,
SWF domestic investments may be subject to
significant political involvement, which can
create agency problems and induce distortions
in SWF investment decisions. For example, a
TABLE 4.4 Selected Sovereign Wealth Funds with a Domestic Investment Mandate, 2014
Country
United Arab
Emirates
Fund
Investment Council
(Abu Dhabi)
Inception
year
2007
Objectives
• To assist the government of Abu Dhabi in achieving continuous
financial success and wealth protection, while sustaining
prosperity for the future.
Assets
(billions $)
627.0
• To increasingly participate in and support the sustainable
growth of the Abu Dhabi economy.
Angola
Fundo Soberano de
Angola
2012
• To generate sustainable financial returns that benefit Angola’s
people, economy, and industries.
5.0
Bahrain
Mumtalakat
2006
• To create a thriving economy diversified from oil and gas,
focused on securing sustainable returns and generating wealth
for future generations.
13.5
Kazakhstan
Samruk-Kazyna
2008
• To develop and ensure implementation of regional, national, and
international investment projects.
47.4
• To support regional development and implementation of social
projects.
• To support national producers.
Malaysia
Kazanah
2003
• To promote economic growth and make strategic investments
on behalf of the government, contributing to nation building.
34.4
• To nurture the development of selected strategic industries
in Malaysia with the aim of pursuing the nation’s long-term
economic interests.
Nigeria
Nigeria
Infrastructure Fund
2011
• To invest in projects that contribute to the development of
essential infrastructure in Nigeria.
Russian
Federation
Russia Direct
Investment Fund
2011
• To make equity investments in strategic sectors within the
Russian economy on a commercial basis by co-investing with
large international investors in an effort to attract long-term
direct investment capital.
Source: Gelb and others 2014.
1.0
10.0