Write a report for a university lecturer describing the information in the graphs below
Bạn đang xem bản rút gọn của tài liệu. Xem và tải ngay bản đầy đủ của tài liệu tại đây (85.16 KB, 2 trang )
<span class="text_page_counter">Trang 1</span><div class="page_container" data-page="1">
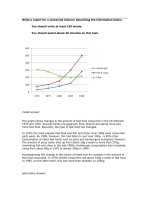
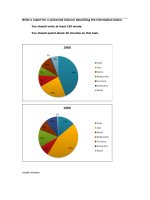
<b>Write a report for a university lecturer describing the information in the graphs below.</b>
You should write at least 150 words.
You should spend about 20 minutes on this task.
</div><span class="text_page_counter">Trang 2</span><div class="page_container" data-page="2">model answer:
The graphs compare the number of deaths caused by six diseases in Someland in 1990 with the amount of research funding allocated to each of those diseases. It can be clearly seen that the amount of research funding in many cases did not correlate with the seriousness of the disease in terms of numbers of deaths. In 1990 there were around 0.2 million deaths from AIDS, 0.1 million deaths from leprosy, 0.3 million deaths from tropical diseases, 0.5 million deaths from diarrhoea, 0.4 million deaths from malaria and 1.8 million deaths from TB. These figures can be contrasted with the amount of funding allocated for each disease. In 1990 AIDS received 180 million dollars in research funding, leprosy 80 million dollars in research funding, tropical diseases 79 million dollars in research funding, diarrhoea 60 million dollars in research funding, malaria 50 million dollars and TB 20 million dollars in research funding. In conclusion it is clearthat funding allocation for disease research in Someland is not wholly determined by the number of deaths for which each disease is responsible in a given year
</div>


