Child Labor in Transition in Vietnam Eric Edmonds and Carrie Turk
Bạn đang xem bản rút gọn của tài liệu. Xem và tải ngay bản đầy đủ của tài liệu tại đây (794.44 KB, 56 trang )
Child Labor in Transition in Vietnam
Eric Edmonds and Carrie Turk
February 2002
Child Labor in Transition in Vietnam*
Eric Edmonds
Department of Economics
Dartmouth College
and
Carrie Turk
Vietnam Country Office
The World Bank
Short Summary:
Vietnam experienced a dramatic decline in child labor during the 1990s. The aim of this study is to
explore in detail this decline and to document the heterogeneity across households in both levels of
child labor and in the incidence of this decline in child labor. Our results suggest embedding efforts
against child labor within an overall anti-poverty program.
Abstract:
Vietnam experienced a dramatic decline in child labor during the 1990s. The aim of this study is to
explore in detail this decline and to document the heterogeneity across households in both levels of
child labor and in the incidence of this decline in child labor. We find a strong correlation between
living standards improvements and child labor so that much of the variation in declines in child
labor can be explained by variation in living standards improvements. Ethnic minority children and
the children of recent migrants appear to remain particularly vulnerable even by the late 1990s.
Children of all ethnicities in the Central Highlands appear to have missed many of the
improvements in the 1990s while children in the rural Mekong and in Provincial Towns have
experienced the largest declines in child labor. Our results suggest embedding efforts against child
labor within an overall anti-poverty program. We notice that the opening or closing of household
enterprises seems to be associated with increases in child labor. Hence, attention should be devoted
to the activities of children in the government's current program to stimulate non- farm enterprises.
*
We are grateful to Paul Glewwe and participants of the Development Strategy Institute, Ministry of Planning and
Investment, and World Bank Conference on Economic Growth and Household Welfare in Vietnam for helpful
comments. The contents of this paper do not reflect the viewpoint of the World Bank. Correspondence to Edmonds at
Correspondence to Turk at
I. Introduction
Child labor 1 is endemic in most of the world’s poorer countries. As a response to chronic
poverty and idiosyncratic shocks, poor children around the world are withdrawn from school, if
they are attending, and are required to make an economic contribution to the household. This may
have a positive effect, in allowing the household and children within the household to maintain
essential basic consumption in times of real hardship. A moderate amount of work in safe
conditions can allow children to develop useful skills and a sense of responsibility. Child labor may
also have negative effects, diminishing a child’s human capital accumulation, creating an enduring
poverty trap for (potentially) generations and exposing children to harmful situations that restrict
their physical, psychological, and emotional development. There are clearly documented problems
in outlawing all forms of child labor (Crawford, 2000). Such prohibitions, if enforced, can cause
severe hardship for households who are barely surviving and drive the economic contributions of
children underground into illegal and exploitative areas of work. At the same time, there is also a
need to safeguard children from abuses to protect them from harmful situations, to ensure their
education and to uphold their basic rights as children.
The incidence of child labor appears to be negatively correlated with living standards.
Using a cross-section of countries from 1995, Krueger (1997) shows that child labor virtually
disappears once a country's GDP per capita reaches $5,000. He finds that 80% of the international
variation in child labor can be exp lained by GDP per capita alone. Vietnam does not appear to be
an exception to this relationship. Driven by rural and other reforms in the late 1980’s and early
1990’s Vietnam enjoyed rapid economic growth of over 6% per annum over the last decade. This in
2
turn generated impressive reductions in the incidence of poverty, with the poverty headcount falling
from 58% to 37% between 1993 and 1998 (World Bank et al). Edmonds (2001) documents that the
probability that a child (ages six to fifteen) works in agriculture, a family operated business, or
wage employment drops by 28% between 1993 and 1998. He shows that 94% of the drop in child
labor for rural households at the poverty line in 1993 can be explained with improvements in
household economic status.2
Not all households benefit equally from improvements in living standards. The aim of this
study is to explore in detail the decline in child labor that Vietnam experienced during the 1990s
and to document the heterogeneity across households in both levels of child labor and in the
incidence of this decline in child labor. Our primary aim is to develop a set of indicators to help
direct policy to children who remain vulnerable despite general improvements in living standards.
We find that even after controlling for time invariant household characteristics, we still
observe substantial heterogeneity across households in the amount by which child labor has
declined in Vietnam in the nineties. Decreases in the probability that children participate in any
type of economic activity have been largest in provincial towns, minor cities, the southeast, and the
rural Mekong river delta. Declines in the fraction of children working have been the smallest in
urban areas, the south central coast, and the Central Highlands.
In addition to geographic indicators, we consider other observable household characteristics
associated with variation in the decline in the probability a child works. Ethnic minorities appear to
work more than non-ethnic minorities, but most of this additional work can be explained by time
1
In much of the literature on child labor, distinctions are made between children “working” and child “labor”. The
former is often used to describe situations where children’s economic contribution is not harmful to their overall
development while child “labor” describes situations where a child’s opportunities for development are being
constrained by their work. In this paper we use the terms “labor” and “work” interchangeably.
2
Glewwe and Jacoby (1998), in looking at retrospective school enrollment and labor market information in the 1993
VNLSS, argue that schooling declined and formal labor market participation rates increased in Vietnam from 1986 to
1991. Unfortunately, there is no data available to link these patterns to changes in household economic status.
3
invariant household characteristics. Ethnic minorities constitute 14% of the population of Vietnam,
but represent 29% of the poor. They have less access to infrastructure, social services and other
resources (Baulch et al 2001). Girls experience smaller reductions in child labor than do boys.
Older children experience greater reductions, but that appears to be because older children were
more apt to work in 1993. Both a past migration history or the actual departure of a household head
are associated with higher levels of child labor, and migrant households experience smaller declines
in child labor than do non- migrant households. The creation of a new household business seems to
be associated with smaller declines in child labor, although households that had a household
business in 1993 experience larger reductions in child labor than other households.
Taken together, the results of this paper paint an optimistic picture for child labor in
Vietnam. Children are doing better in 1998 than in 1993. Although there is substantial
heterogeneity across households and regions in the amount by which they have reduced their child
labor, we do not find any observable household characteristics that clearly indicate a failure to
participate in the declines in child labor that we observe between 1993 and 1998. There is still
ample scope for policy to help improve the well-being of children and there are groups of children
who remain vulnerable even in the context of rising living standards. Some of the worst forms of
child labor are not easily captured with household surveys. Nevertheless, for the average child in
Vietnam who is represented in the VNLSS, there is every reason to be optimistic about their future.
II. The Child Labor Environment in the 1990s
A. Recent Trends in Child Labor
In this paper, we rely on the Vietnam Living Standards Surveys (VNLSS). There are two
nationally representative rounds of the VNLSS. The first round conducted in 1992/93 interviewed
4800 households, collecting data on a wide variety of household characteristics and activities. The
second round took place in 1997/98 and followed a similar questionnaire and field design. The
4
1997/98 round of the VNLSS was designed to be a nationally representative, stand-alone crosssectional survey sampling 5999 households, but it also revisited 4305 households from the first
round of the VNLSS. When our analysis is based on nationwide comparisons, we treat the two
rounds of the VNLSS as separate, nationally representative (when appropriately weighted) crosssectional surveys. We complete our descriptive work with regression analysis where we limit our
sample to the panel households that appear in both rounds of the survey.
There are limitations associated with using the VNLSS to investigate patterns and trends in
child labor. First, some of the most exploitative forms of child labor, such as child prostitution, are
likely to be hidden because they are illegal. Second, the VNLSS collects little information on
working conditions. Whether or not work is harming the development of a child lies partly in the
nature of the work and the exposure to physically hazardous and/or psychologically stressful
conditions. Because the VNLSS does not attempt to docume nt working conditions and the data on
hours worked in agriculture is not comparable between rounds, our quantitative analysis focuses on
participation in work rather than working conditions. We supplement our analysis by drawing on a
growing body of qualitative studies that examine issues around child labor. Third, some of the
children who are laboring are likely to be hidden. Street children3 , for example, are often not part of
households and are therefore likely to be omitted from household surveys. Households of
unregistered migrants are less likely to be included in the VNLSS (World Bank et al, 1999), though
studies suggest that their children are more likely to work for a living (SCF (UK) 1999).
The VNLSS may also miss the labor activities of children who have left their household.
Children who have been “trafficked” overseas are very likely to be working but, since they no
longer reside in Vietnam, will not show up in household survey data. Likewise, there is a case
5
study literature documenting children leaving their parental home to stay and work with other
families for periods of time, either in exchange for board, lodging, and education or to work for a
wage as a domestic helper (SCF (UK), 1997; VN-Sweden MRDP, 1999). The work of these
children may not be adequately captured by the data because these children very often remain both
unregistered in the host family (survey respondents may not consider the child when listing
household residents or members) and absent from the family home (SCF Sweden et al, 2000).
Fortunately, it is possible to assess the scale of this missing children problem with the
VNLSS data. The 1993 survey collects a household roster of all individuals in the household at the
time of the survey, and the 1998 survey asks about the location of each of those members. Of the
children ages 10 and under (and thus between 5 and 15 in 1998) in the 1993 survey, 92% are still in
the household in 1998. Of this missing 8%, 10% died. 56% of the dead are boys (in other
countries, boys have been found to have slightly higher mortality rates). Of the surviving 421
children present in the household in 1993 but not in 1998, 365 (or 87%) moved out when their
family moved. For the remaining 56 children, 31 (55%) are female. 11 of these females left the
household for marriage (9 boys of the 25 boys left the household for marriage). Thus, out of 6003
sampled children between the ages of 0 and 10 in 1993 in panel households, a total of 36 appear to
have left the household for reasons other than death, parental movements, or marriage. The reasons
given for migration of these 36 children are evenly split between employment, schooling, and other.
9 out of the 20 girls report leaving home for employment whereas only 3 out of the 16 boys do.
However, 8 of the 16 boys report leaving for "other" reasons (only 4 girls report other). Thus,
although departing one's household for work is undoubtedly an important event in the lives of those
children being sent away, this experience does not appear to be an integral part of the childhood
3
The term “street children” here is used to describe children who are working on the streets and who live on the street
(with or away from their families) or who live in basic shelter away from their families or who return at night to live
6
experience of either the average boy or the average girl and is unlikely to substantively alter our
conclusions.
The VNLSS surveys present several ways to define child labor. We present these in table 1.
For each household member, age 6 and older, the VNLSS asks whether the person works for pay
outside of the household (“works for wages outside of household”), works for the household in
agriculture (“works in agr. for hh”), and works for the household in self-employment or a household
run business (“works in bus. for hh”). Collectively, we refer to these three work categories as
traditional work. The survey also asks whether a person performs household work and chores such
as cleaning, cooking, washing, shopping, collecting water or wood, and building or maintaining the
house, its surroundings, or furniture. Collectively, we refer to this set of activities as household
work. 4 The VNLSS collects data on participation in each of these activities for the last seven days
and in the last twelve months. Throughout this paper, we focus on participation in the last seven
days.
Table 1: Participation in Child Labor (in last 7 days) by Type of Work for
Children 6-15 (%)
1992/93
1997/98
Mean S.E.
Mean S.E.
Works for wages outside of household
2.3
0.3
1.3
0.2
Works in Agr. in Hh
25.6
1.6
19.3
1.7
Works in Bus. in Hh
4.4
0.6
2.6
0.4
Works in Traditional Work
30.7
1.5
22.0
1.6
Works in Household Work
52.8
1.2
53.0
1.6
Works
62.1
1.3
56.8
1.5
Population means weighted to reflect samp ling probabilities. Standard errors corrected for
clustered sample design. The 1992/93 data are from a sample of 6071 children 6-15 representing a
population of 16,340,704. The 1997/98 data are from a sample of 7071 children 6-15 representing
a population of 19,117,671.
with their families off the street. This is a mixed group of children with different vulnerabilities.
4
We are missing household work information for 47 children (0.4% of our total sample). 6 of these children report
working in traditional work. Thus, throughout this paper when we consider participation in traditional work will we
have 41 more children than when we consider work participation across all categories and 47 more children than when
we consider work participation in household work. Because we are missing household hours for these 47 children, all
hours worked observations contain 47 less children than does hours in traditional work.
7
Table 1 documents the economic activities of children 6-15 in both rounds of the VNLSS.
The outstanding feature of table 1 is that a majority of children in Vietnam are engaged in some
form of economic activity within the last seven days. This is true in both the 1993 and the 1998
rounds of the VNLSS. However, participation rates declines by 9% between the survey years from
62% to 57%. This decline is composed of a large (28%) decline in participation in traditional work
and a small (0.4%), statistically insignificant increase in participation in household work. 5 For the
components of traditional work, children are most likely to be engaged in agricultural work within
the household. The participation rate in agriculture within the household in 1993 is 26%. This
declines to 19% in 1998, a 25% reduction relative to the 1993 level. Work outside of the household
and work for a household business are rare with participation rates of 2% and 4% respectively in
1993. However, both these categories experience large, statistically significant percentage
reductions. Work outside of the household declines by 44%. Work in a household business
declines by 42%.
B. The Economic and Policy Context
These changes in child labor are taking place in a rapidly evolving economic and policy
environment. The rural reforms of the late 1980’s returned responsibility for agricultural
production to the autonomous farming household and this reform is correlated with impressive
growth in agricultural output. Over the 1990’s agricultural GDP grew by nearly 5% per annum,
prompting a rise of 60% in farm incomes between 1993 and 1998 (World Bank, 2000). The
industrial sector has also been expanding rapidly, growing at 13% per year between 1993 and 1998.
Policies that promoted capital- intensive industries and protected domestic markets have meant that
5
When we discuss changes in child labor through time, we will either consider percentage point changes which are
calculated by subtracting the 1998 participation rate from the 1993 participation rate (i.e., the fraction of children
working in traditional work drops by 8.7 percentage points) or percentage changes that are calculated by dividing the
percentage point decline by the 1993 base (i.e., we find a 28% decline in participation in child labor).
8
industrial employment over this period grew relatively slowly (at approximately 4% per annum over
the same period). The introduction of a new Enterprise Law in 2000 and recent announcements that
the Government of Vietnam intends to embark on further reforms to create a stronger environment
for enterprise and international trade suggest that a more labor intensive sector may develop rapidly
over the coming years. Recent estimates based on GSO data suggest that 300,000 new jobs were
created in the private sector during 2000 (World Bank estimates based on GSO data).
1. Education
Government policies in the post-Independence period have demonstrated a commitment to
achieving universal primary education and to protecting children from exploitative situations.
Vietnam entered the 1990’s with net enrollment rates in primary school of 86% (Government of
Vietnam, National Literacy Committee estimates). This emphasis on the provis ion of education was
reinforced in 1991 by the introduction of the Law on the Universalisation of Education and in the
1992 Constitution, which asserts that primary education is both free and compulsory. Though it is
the case that tuition fees are not charged for primary education, many sources have described the
burdensome nature of a whole range of other costs associated with educating children (Actionaid,
1999; Oxfam GB, 1997; World Bank, 1999).
These studies suggest that the costs have become more onerous over the 1990s and that they are an
important cause of interrupted education. Recent estimates using VNLSS data suggest that the costs
of educating one student at primary level are equivalent to nearly 5% of non-food expenditure for a
household in the lowest quintile of the population and that their primary school costs have risen
between 1993-1998 (Government of Vietnam – Donor Working Group, 2000). Households in the
lowest quintile are well below the poverty line. As such, any non-food expend iture diverts funds
from basic consumption needs (World Bank et al, 1999). Much of the qualitative literature on child
labor and working children in Vietnam tracks a path from household economic difficulties to
9
withdrawing children from school to, shortly afterwards, scaling up the economic activity of
children as a strategy for coping with hardship (SCF(UK), 1998; SCF(UK), 1999; VN-Sweden
MRDP, 1999).
Even though the costs of educating children can be considerable, enrollment rates in all
levels of schooling have risen over the 1990’s. Table 2 contains school enrollment rates by quintile
and level of schooling for 1993 and 1998. In 1998, net enrollment in primary education (grades 15) was 91 percent with little difference between the enrollment rates of girls and boys. Enrollment
in lower secondary school (grades 6-10) had climbed to 62 percent by 1997. However, poor
children have generally lower enrollment rates at all levels of schooling in Table 2 and the quality
of education services varies widely across the country. Moreover, Vietnam has one of the shortest
primary school curricula in the world in terms of hours in the classroom (though this is currently
under revision, following the National Assembly’s adoption of resolution No 40/2000/QH on
curriculum reform) and, particularly in rural areas, does not demand more than a few hours’
attendance a day (DFID 2001). For many children, progress through primary school is fully
compatible with a moderate amount of work, either inside or outside the household, paid or unpaid.
In fact, for some children, the costs of pursuing education may necessitate economic activity.
Table 2: School enrollment rates by quintile in Vietnam, 1993-98 (%)
Primary
Lower sec Upper sec
Post sec
1993 1998 1993 1998 1993 1998 1993 1998
Net enrollment rates
Vietnam
Poorest quintile
Richest quintile
Gross enrollment rates
Vietnam
Poorest quintile
Richest quintile
87
72
96
91
82
96
30
12
55
62
34
91
7
1
21
29
5
64
3
0
9
9
0
29
120
100
130
115
112
104
42
15
77
78
47
105
9
1
24
36
8
75
4
0
13
12
0
37
Source: Nguyen Nguyet Nga (forthcoming), based on estimates from VNLSS1 and VNLSS2
10
A child only has so much available time, and time spent working may reduce time in school,
time studying, or leisure time. A vast descriptive literature suggests that low levels of work are
compatible with continued school enrollment, but as hours worked increase, schooling and work
become incompatible. Even if school enrollment is compatible with child labor, work may still
affect a child's human capital accumulation. First, a working child may be enrolled in school, but it
is not clear that we observe time spent in class with enrollment information. Second, physically
being in school is only a necessary, not sufficient, condition for learning. Work may limit the
child's energy for school, or it may limit the child's ability to develop skills outside of the
classroom. Third, even if working has no effect on schooling whatsoever, leisure is important in a
child's development. Play enables a child to develop both its social and creative thinking skills. It
is possible that this cost to a child could be even greater than the lack of general skill accumulation.
Of course, the types of general skill that a child learns in school are not the only types of skill that
are useful to a child. A child may use the skills it develops while working throughout its life. Thus,
the relationship between schooling and child labor is very difficult to analyze. This fact is further
complicated because we cannot separate whether a child works because it does not attend school or
the child does not attend school because it works.
With this in mind, we look at school enrollment rates in 1993 and 1998 for different work
categories. We can say nothing about the quality of time spent in school for working children, and
we do not observe the working child's consumption of leisure. With these caveats, it seems useful
to consider school enrollment rates by the type of work performed by a child. We also consider
whether school enrollment rates differ by type of work through time. This is in table 3:
11
Table 3: School Enrollment by Age and Type of Work in Last 7 Days
Doesn't Work
Works for wages (outside)
Works in Agr in Hh
Works in Bus in Hh
Works in Traditional Work
Works in Household work
Works
All Ages
Ages 6-11
Ages12-13 Ages 14-15
1993 1998 1993 1998 1993 1998 1993 1998
83.3 92.3 83.7 92.9 88.3 93.3 67.0 85.8
15.9
7.5 46.2 39.9 32.4 16.2
4.5
4.0
63.0 74.7 89.8 93.3 66.3 80.6 34.0 58.3
48.9 59.7 86.8 90.1 58.8 62.9 28.1 51.4
59.3 70.2 89.5 92.6 63.2 76.9 30.9 53.3
72.5 86.3 88.8 96.0 72.1 88.2 43.0 72.4
71.8 84.7 89.2 95.5 70.7 86.7 41.6 69.6
In table 3, each cell is calculated by stratifying the sample by the each row. Hence, in the first row,
we compute school enrollment rates for all children that do not work. In the third row, we compute
school enrollment rates for all children that work in agriculture for their household. Any individual
child can appear in multiple rows. For example, if a child works in agriculture and a household
business, it is counted in both rows. The first two columns calculate school enrollment rates by year
for all ages. The remaining columns compute school enrollment rates for children 6-11, 12-13, and
14-15.
Several interesting traits appear in table 3. First, school enrollment rates are generally
highest for nonworking children. 88% of 12-13 year olds who do not work are enrolled in school in
1993, but only 71% of 12-13 year olds that work attend school in 1993. The only exception to this
is for primary school age children (6-11). In this group, children who work report slightly higher
enrollment rates, but this difference in enrollment rates for primary school age children is not
statistically significant. Second, in both 1993 and 1998, children are least likely to attend school if
they work outside of the household (only 8% of children in this group enroll in school in 1998) or if
they work in a household run business. For a majority of children, it is possible to both enroll in
school and work in agriculture or in household work. For children above the age of 11, however,
children that work in any type of traditional work have enrollment rates that are below (statistically)
12
enrollment rates for children who do not work. Third, between 1993 and 1998, school enrollment
rates increase across all rows of table 3 except for those children who work outside of the
household. School enrollment rates are actually lower for children who work outside of the
household in 1998, but this lower rate of school enrollment is only statistically significant at the
10% level for one age group: 12-13. Fourth, outside of ages 6-11, school enrollment rates increase
between 1993 and 1998 by more for working children tha n nonworking children. Part of this may
be attributable to the fact that school enrollment rates are bounded at 1, and they start off very close
to 1 for non-workers in 1993. In addition, work could be becoming more compatible with
schooling in 1998. One mechanism for this increase in the compatibility between schooling and
working might be that a reduction in hours worked accompanies the reduction in work participation
rates that we observe in this paper. Hence, in the VNLSS data we observe that older children who
work are less likely to be enrolled in school than children that do not work, and we see that children
who work become more likely to be enrolled in school through time.
2. Legislation
Vietnam was the second country in the world, and the first country in Asia, to sign the
International Convention on the Rights of the Child in 1990. Article 32 of the Convention
underscores the need for Governments to “recognize the right of the child to be protected from
economic exploitation and from performing any work that is likely to be hazardous to or interfere
with the child’s education, or to be harmful to the child’s health or physical, mental, spiritual, moral
or social development”. The Government of Vietnam has acted on this through a number of
legislative and regulatory measures, seeking to maintain an uneasy balance between allowing
children to contribute to their own survival in times of hardship and safeguarding the rights of
children to physical and intellectual development. Of particular importance are the Law on Child
Protection, Care and Education (1991); the 1992 Constitution of the Socialist Republic of Vietnam
13
(especially Article 65); the Labor Code (1994); many Decrees and Circulars which clarify specific
issues in connection to child labor; and Decision No 134/1999/QD-TTg which approves the
Program of Action to protect vulnerable children in the 1999-2002 period.
The outcome of these laws, decrees, regulations and instructions is a regulatory framework
that outlines the key definitions and priorities in relation to child labor. A child is a person under the
age of 18 (according to the Constitution), but Articles 119-122 of the Labor Code specify conditions
under which adolescents or juniors (15-18 year-olds) may work legally. Restrictions that apply to
the employment of 15-18 year-olds include:
•
Not working more than 7 hours per day or 42 hours per week;
•
Working under dangerous conditions 6 ; and,
•
Being forced to work or being involved in abusive or exploitative work.
Junior employees between the ages of 15 and 18 are entitled by law to the same wage as
an adult, provided they are performing the same work. Children under the age of 15 are allowed to
work in a very restricted range of activities specified by MOLISA (Circular No 21/1999/TTBLDTBXH), but are not permitted to work more than 4 hours per day or 24 hours per week, must
be over the age of 12, and may only work with written consent of their parents or sponsors. The
employer is obliged to ensure the child’s schooling. Children under the age of 13 can be employed
legally if they are being trained in certain occupations identified by the MOLISA (Decree No
90/CP).
The Government of Vietnam ratified the ILO Convention No 182 on the Worst Forms Of
Child Labor in November 2000. As such the Government of Vietnam has indicated its commitment
6
Defined by Circular 09/TTLB, 13.4.95, issued by the Ministry of Labor, Invalids and Social Affairs and the Ministry
of Health, specifies 13 harmful situations and 81 forbidden occupations.
14
to eliminating “the worst forms of child labor” as defined in Article 3 of Convention 182 and is in
the process of drafting a plan to implement the requirements of Convention 182 (MOLISA, 2001).
Vietnamese tradition accords an important role for children within the households and, in
common with many cultures, a moderate amount of work within the household can be considered
positive for the physical, intellectual and personal development of children. This is legal as long as
it is not harmful, dangerous or exploitative and it does not interfere with the completion of primary
education (Institute of Labor Studies and University of Wollongong, 2000).
III. Winners and Losers Among Child Laborers in the Nineties
The allocation of child time is an important component of a household's decision-making
process. The household must weigh the value of child time spent in many activities including
schooling, wage work, work inside the household, and work in household chores or other
components of household production. The value of child time in any of these activities may
depend on both child and household attributes. In this section we consider how observable child
and household characteristics are associated with the degree to which a household benefits from
improved living standards in Vietnam in the 1990s.
A. Child Attributes: Age and Gender
The types of work that a child can perform vary with the child's age and may vary with the
child's gender. A child age 6 is a less capable worker in most activities than is a child age 15. Sextyping of economic and household activities can lead to different age/gender distributions of the
activities of children.
If boys and girls perform different types of activities, it is possible that they
have been differentially affected by the changes that Vietnam has experienced in the 1990s. In this
section, we consider changes in child labor by gender, then discuss gender differences by age.
Table 4 presents participation rates in various types of economic activities by gender. Girls
are more likely to work than are boys in both rounds of the VNLSS. In traditional work, higher
15
participation rates appear to be driven by greater participation by girls in the household business.
Also, girls are more apt to participate in household work, and this extra participation in household
work than boys. Most of the large gender differences in participation in any form of work
("works") appear to owe substantially higher participation rates of girls in household work. The
reduction (in percentage terms) in participation rates between the two rounds of the VNLSS is
larger for boys, although the decline in levels of participation are nearly identical for boys and girls.
Table 4: Participation in Child Labor (in last 7 days) by Gender for Children
6-15
1992/93
1997/98
Mean S.E.
Mean S.E.
Boys
Works for wages outside of household
2.2
0.3
1.2
0.2
Works in Agr. in Hh
25.4
1.7
19.1
1.9
Works in Bus. in Hh
3.6
0.5
2.5
0.5
Works in Traditional Work
29.9
1.6
21.6
1.9
Works in Household Work
45.2
1.6
46.8
1.8
Works
57.9
1.6
52.5
1.8
Girls
Works for wages outside of household
2.4
0.4
1.4
0.3
Works in Agr. in Hh
25.9
1.7
19.4
1.7
Works in Bus. in Hh
5.3
0.7
2.7
0.5
Works in Traditional Work
31.6
1.5
22.4
1.6
Works in Household Work
60.7
1.3
59.6
1.6
Works
66.5
1.3
61.3
1.6
However, the activities of boys and girls differ with their age. Hence, while there may be
little difference between the way boys and girls as groups benefit from the growth in Vietnam in the
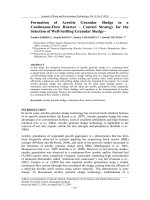
1990s, there may be important by age differences. Figure 1 presents child labor participation rates
16
by age and gender. 7 Throughout this paper, we examine figures similar to figure 1. Hence, it is
important that the interpretation of figure 1 is clear. Figure 1A considers participation in all
categories of work. Figure 1B only considers participation in traditional forms of work (the
difference between the two being household work).
Figure 1: Participation in Work by Age and Gender
A. All Work Categories
0.9
0.8
0.7
0.6
0.5
0.4
Probability
0.3
Working (All Categories)
Boys 1993
Girls 1993
Boys 1998
Girls 1998
0.2
0.1
6
7
8
9
10
11
12
13
14
15
Age
7
Though the sample sizes in the VNLSS are relatively large, when we separate children by age and by gender, the
number of children that we observe of a given age and gender becomes relatively small. Hence, we smooth our
estimates of child labor participation rates using a nonparametric (local) regression smoother. The lines are local
regression lines estimated with an Epanechnikov kernel and a bandwidth of .9. With such a small bandwidth, these
regression lines look only slightly smoother than just the raw, by age, sample means. Later, when we bifurcate the
sample by household characteristics where the number of children at a given age is very small, we use a larger
bandwidth, and this regression procedure imposes more smoothing.
17
B. Traditional Work
0.7
Boys 1993
Girls 1993
Boys 1998
Girls 1998
0.6
0.5
0.4
0.3
0.2
Probability Working in Traditional Work
0.1
6
7
8
9
10
11
12
13
14
15
Age
Each line in figure 1 connects the participation rates by age for the group indicated in the legend.
The vertical axis is labeled the "Probability of Working". It has the interpretation of being the
fraction of children at a given age in a given group (e.g., boys 1993) who are working or of being
the probability, upon observing a child at the indicated age in the given group, of finding that the
child works. When multiplied by 100 these are identical to the labor participation rates in the
tables.
The large drop in the probability that a child works as well as the improvements experienced
by each gender is evident in these pictures. However, there are some interesting age/gender
differences evident in figure 1. In figure 1A (all work categories), the largest drop in work
probabilities appear between the ages of 8 to 10. These are primary school ages. The decline in
work is smaller in older age groups, particularly for girls. However, for traditional work, the
decline in labor participation is greatest for older (post-primary school) ages. In figure 1B, girls
after the age of 11 are more likely to engage in traditional work than are boys although the
18
differences are very small. Both boys and girls experience a similarly large drop in participation
rates in traditional work between 1993 and 1998. The magnitude of this drop (percentage point)
increases with age. Since older children are substantially more likely to work in traditional work in
1993, it makes sense that they should experience the largest reductions over time.
The interpretation of these gender differences is complex. Boys and girls may have different
economic opportunities open to them, and the value of their time outside of work may vary
dramatically. Within the household, members may not agree on how to allocate child time. It is
particularly important to recognize that the benefits from any particular decision may not accrue to
those bearing the costs associated with that decision. This repeatedly emerges as a theme in studies
on children in Vietnam. It is common, for example, to see one child (often a girl) withdrawn from
school and set to work in order to allow the other children to carry on their education (SCF (UK)
(1999)). Since an important part of the difference in work participation between boys and girls lies
in their contribution to household work it is likely that the gender division of labor and genderbased inequities in decision- making within the household are important determining factors. We
return to this issue in the conclusions.
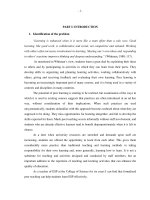
There also appear to be gender differences in hours worked. Figure 2 examines the
distribution of hours worked in nonagricultural traditional work for children that work. The
questionnaires from the 1993 and 1998 VNLSS are virtually identical with respect to child labor
except for a substantive change in the way hours worked in agriculture is collected. Consequently,
we can only compare hours worked in wage work and work for the household business
("nonagricultural traditional work").
19
Figure 2: Distribution of Hours Worked in Nonagricultural Traditional Work
Boys 1993
Girls 1993
Boys 1998
Girls 1998
0.6
0.5
0.4
0.3
Density
0.2
24 hours →
← 42 Hours
0.1
1.5
2
2.5
3
3.5
Logarithm of Hours in Nonagricultural Work, Conditional on Working
4
Figure 2 contains nonparametric estimates of the density of the logarithm of hours worked in the
last week. 8 We separately estimate the densities for 1993 and 1998 and boys and girls. Focusing
first on the 1993 density estimates, we observe that the density of time spent working for girls is
more concentrated than for boys. This is evident by the higher peak in excess of 42 hours of work
in the last week. We find a greater mass of boys working less than 24 hours in 1993 and a greater
fraction of girls working about 42 hours per week.
The distribution of hours worked changes significantly in 1998. For both boys and girls, we
observe a drop in the mass of workers working in excess of 42 hours. We see an increase in the
mass of boys who are working close to 24 hours per week. For girls, we see the emergence of two
clear mass points in the 1998 distribution. The largest subset of girls work more than 42 hours per
week (although the fraction of girls working 42 hours declines between the two years). However, in
8
Density estimates are kernel densities estimated with a Gaussian kernel and a bandwidth chosen by Silverman's rule of
thumb (1986).
20
1998, we see a mass of girls working slightly less than 24 hours per week as well. We have no t
corrected the pictures in 1998 to reflect the fact that the probability of observing a child working in
nonagricultural work is lower in 1998. Hence, the type of children pictured in the 1993 distribution
might be different than the children remaining in the 1998 picture. Nevertheless, to the extent that
the children working in nonagricultural work in 1993 and 1998 are comparable, the picture in figure
2 is consistent with many girls shifting their work from a large number of hours in 1993 to
relatively few hours in 1998.
Figure 2 shows that a considerable number of those children, particularly girls, that work
outside of agriculture are working hours above the legal limits set out in the Labor Code. 45% of
these children are working in enterprises with five or less employees, but these legal limits are still
relevant as indicators of what Vietnamese society and legislators have decided is acceptable within
the specific social, cultural and economic context of Vietnam. The mean child who is working in
nonagricultural traditional work in 1998 is still working 34 hours per week, above the legal
maximum set by the Ministry of Labor, Invalids and Social Affairs (MOLISA) for children under
the age of 15 years. These children could be described as vulnerable in the sense that their working
arrangements might be restricting their wellbeing and interfering with their basic rights as identified
in Article 32 of the International Convention of the Rights of the Child. The second peak at above
42 hours per week is especially worrying, since this exceeds by some margin the legal limits
established for the 15-18 year age group and in our data, only 15% of the children who work more
than 42 hours are even enrolled in school. A study of working children in Ho Chi Minh City (Viet
Nam Youth Institute, 1999) corroborates this pattern, indicating that working hours for girls peaked
at a higher level than for boys and at levels above the maximum limit set by law.
21
B. Residential Location
The distribution of improvements in living standards has been different across rural and
urban areas of Vietnam (Glewwe and Nguyen 2000). For that reason alone, we might expect to see
differences in the improvements in the child labor situation across rural and urban areas (or in even
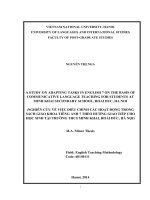
greater geographic detail). However, children also engage in different types of economic activities
in rural and urban areas. Table 5 describes the types of activities undertaken by children of
different gender and ages in Ho Chi Minh City, and table 6 considers the activities of children in
rural Vietnam.
22
Table 5: Starting Age of Work of Children In Different Occupations (Ho Chi Minh City)
Children’s Age
6
7
8
9
10
11
12
13
14
15
16
17
Selling Lottery Tickets
Peeling Onions (at home)
Making Match Boxes (at home)
Weaving Mats and Baskets (at home)
Scavenging at the Dumpsite
Making shoes (support workers – local)
Bobbin Fillers (at weaving enterprises)
Catching Grasshoppers
Making Ball-Point Pens (boys)
Making Lanterns
Classifying Waste Plastic (at home)
Making Operating Parts of Lamps
Recycling Glass
Making Ball-Point Pens (girls)
Making Chains
Silk-Screen Printing
Making Bag Wheels
Selling Noodle Soup
Making Nem Chua (Fermented Pork)
Making Furniture & Wooden Art Products
Making Scales
Recycling Glue
Making Chalk
Recycling Plastic (boys)
Making Shoes (migrant support
workers)
Making Plastic Sandals
Making Bicycle Tyres
Sorting\Recycling Plastic (at
factories – girls)
Dyeing Materials
Catching
Locusts
6
7
8
9
10
11
12
13
14
15
16
17
Source: Save the Children (UK) (1999)
23
Table 6: Starting Age of Work of Children In Different Occupations (Rural North Central
Region)
Children’s Age
4
5
6
7
8
9
10
11
12
13
14
15 …
Looking after younger siblings
Sweep house and yard
Watch house
Washes dishes
Feed chickens
Collect pig feed
Catch crabs, shrimp and snails
Dig up worms for ducks
Wash clothes
Cook food for humans
Cook food for pigs
Feed pigs
Fetch fuelwood
Boil water
Dry paddy
Process cassava
Tend cows and buffalos
Collect grass
Fetch water
Collect cattle manure
Harvest rice
Transplant rice
Weed and irrigate crops
Plough and harrow fields
Collect firewood from forest
Mill and husk paddy
Wage labor
Go
fishing
Migrate
4
5
6
7
8
9
10
11
12
13
14
15 …
Source: Save the Children (UK) (1997)
Both tables are taken from participatory research with working children in different
locations of Vietnam. The scope of activities open to children in rural areas at earlier ages is much
greater. Thus because of both the nature of the economic change in Vietnam and differences in the
24