Báo cáo y học: "Changes in gene expression during the development of mammary tumors in MMTV-Wnt-1 transgenic mice" ppt
Bạn đang xem bản rút gọn của tài liệu. Xem và tải ngay bản đầy đủ của tài liệu tại đây (490.63 KB, 13 trang )
Open Access
Volume
et al.
Huang
2005 6, Issue 10, Article R84
Research
Shixia Huang*†‡, Yi Li*Đ, Yidong Chenả, Katrina Podsypanina*,
Mario Chamorro*, Adam B OlshenƠ, Kartiki V Desai#**, Anne Tann†,
David Petersen#, Jeffrey E Green# and Harold E Varmus*
reviews
Addresses: *Program in Cancer Biology and Genetics, Sloan-Kettering Institute, New York, NY 10021, USA. †Breast Center, Baylor College of
Medicine, Houston, TX 77030, USA. ‡Department of Medicine, Baylor College of Medicine, Houston, TX 77030, USA. §Department of Cell and
Molecular Biology, Baylor College of Medicine, Houston, TX 77030, USA. ¶National Human Genome Research Institute, National Institutes of
Health, Bethesda, MD 20892, USA. ¥Department of Epidemiology and Biostatistics, Memorial Sloan-Kettering Cancer Center, New York, NY
10021, USA. #National Cancer Institute, National Institutes of Health, Bethesda, MD 20892, USA. **Johns Hopkins in Singapore Ltd, The
Nanos, Singapore 138669, Republic of Singapore.
comment
Changes in gene expression during the development of mammary
tumors in MMTV-Wnt-1 transgenic mice
Correspondence: Shixia Huang. E-mail:
Received: 11 May 2005
Revised: 20 July 2005
Accepted: 30 August 2005
Genome Biology 2005, 6:R84 (doi:10.1186/gb-2005-6-10-r84)
The electronic version of this article is the complete one and can be
found online at />
Abstract
Genome Biology 2005, 6:R84
information
Conclusion: We described gene-expression patterns associated with breast-cancer development
in mice, and identified genes that may be significant targets for oncogenic events. The expression
data developed provide a resource for illuminating the molecular mechanisms involved in breast
cancer development, especially through the identification of genes that are critical in cancer
initiation and progression.
interactions
Results: We used cDNA microarrays to determine the expression profiles of five normal
mammary glands, seven hyperplastic mammary glands and 23 mammary tumors from MMTV-Wnt1 transgenic mice, and 12 mammary tumors from MMTV-Neu transgenic mice. Adipose tissues
were used to control for fat cells in the vicinity of the mammary glands. In these analyses, we found
that the progression of normal virgin mammary glands to hyperplastic tissues and to mammary
tumors is accompanied by differences in the expression of several hundred genes at each step.
Some of these differences appear to be unique to the effects of Wnt signaling; others seem to be
common to tumors induced by both Neu and Wnt-1 oncogenes.
refereed research
Background: In human breast cancer normal mammary cells typically develop into hyperplasia,
ductal carcinoma in situ, invasive cancer, and metastasis. The changes in gene expression associated
with this stepwise progression are unclear. Mice transgenic for mouse mammary tumor virus
(MMTV)-Wnt-1 exhibit discrete steps of mammary tumorigenesis, including hyperplasia, invasive
ductal carcinoma, and distant metastasis. These mice might therefore be useful models for
discovering changes in gene expression during cancer development.
deposited research
© 2005 Huang et al.; licensee BioMed Central Ltd.
This is an Open Access article distributed under the terms of the Creative Commons Attribution License ( />which permits unrestricted use, distribution, and reproduction in any medium, provided the original work is properly cited.
ferentially expressed at each stage of tumor development
cDNA microarray-derived expression profiles development.
Gene expression in mouse mammarybreast tumorof MMTV-Wnt-1 and MMTV-Neu transgenic mice reveal several hundred genes to be dif-
reports
Published: 30 September 2005
R84.2 Genome Biology 2005,
Volume 6, Issue 10, Article R84
Huang et al.
/>
Background
Gene expression arrays are being widely used to improve the
classification of human cancers and to improve our understanding of the molecular changes associated with carcinogenesis [1,2]. However, their use in defining expression
patterns in tumor evolution and in correlating genotypes with
phenotypes has been limited because of the poor availability
of tissues at different stages in cancer development and
because of the great diversity of genetic backgrounds among
individuals [3-5]. Mouse models of cancer have advantages
for exploring the use of this method: a partially defined neoplastic genotype, relatively uniform genetic background, and
ample sources of tissue samples from different stages in
mammary tumor evolution. Some features of expression profiles identified in mouse mammary tumors are shared by patterns seen in RNA from human tumors [6]. By comparing
expression patterns of mammary tumors in six different
transgenic mouse models, Desai and coworkers [7] have
shown that the initiating pathway determines a distinctive
expression phenotype in tumors. In addition, using proteins
as markers of cell phenotypes, we showed that initiating
oncogenes determine the developmental status of mammary
tumor cells [8].
Members of the Wnt gene family were discovered as protooncogenes that are frequently activated in mammary tumors
arising in mice infected with mouse mammary tumor virus
(MMTV) [9,10]. Wnt genes encode extracellular matrix binding proteins that control many developmental processes,
including cell fate specification and stem cell renewal; they
are also involved in mammary morphogenesis and progenitor
cell renewal [11,12]. Made as secreted glycoproteins, Wnt proteins exert their biologic effects by binding to at least two
membrane receptors, namely the frizzled and low-density
lipoprotein receptor related proteins. As a result of signaling
via the 'canonical' pathway, β-catenin is stabilized, translocates to the nucleus, and transactivates different sets of genes
depending on the cellular context [13].
Mice expressing Wnt-1 under the control of the enhancer elements in the MMTV long terminal repeat develop extensive
hyperplasias of the mammary glands at prepubertal ages,
mammary tumors at a median age of 6 months, and sometimes pulmonary metastases ([14]; Podsypanina K, unpublished observations). Tumors in these MMTV-Wnt-1
transgenic mice appear to arise from progenitor cells in the
mammary gland, because many cells in both hyperplastic and
neoplastic lesions express putative progenitor cell markers
(such as Sca-1 and keratin-6) and efflux fluorescent Hoechst
33342 dye - a property that has been associated with stem
cells in the hematopoietic system [8,15]. The resulting tumors
also contain tumor cells with myoepithelial as well as epithelial markers, implying that they arise from a progenitor cell
that gives rise to both lineages [8,15]. Because at least some
human breast cancers are also thought to arise from progenitor cells [16], it is important to define better the molecular
events that lead to tumor formation in this line of mice.
Here we report the expression profiles at different steps of
tumor evolution in the MMTV-Wnt-1 transgenic model, and
we compare these profiles with those in the MMTV-Neu
transgenic model. We addressed the following questions. Can
we follow progression in MMTV-Wnt-1 transgenic mice from
hyperplasia to primary tumor? Are differences apparent
between tumors induced by different transgenic oncogenes?
Can we distinguish tumors with additional genetic alterations
in MMTV-Wnt-1 transgenic mice from those without other
known genetic alterations?
Results and discussion
Mammary tumors in MMTV-Wnt-1 transgenic mice
have an expression profile distinct from that seen in
mammary tumors induced by MMTV-Neu
Comparison of expression profiles of tumors from several
transgenic models has led to the identification of expression
signatures for different oncogenic pathways [7]. In order to
determine whether tumors from MMTV-Wnt-1 transgenic
mice also have a distinctive expression profile, we determined
Table 1
Tissue samples
Tissue type
Abbreviation
Number of samples
Age (weeks)
Array size
Normal virgin mammary gland
VMG or V
5
9
15k
Hyperplastic mammary glands from MMTV-Wnt-1 transgenic mice
WntH
7
9
15k
Mammary tumors from MMTV-Wnt-1 transgenic mice
WntT
33
9-56
15k (23 arrays),
8.7k (10 arrays)
Mammary tumors from MMTV-Neu transgenic mice
NeuT
12
32-60
15k
Normal fat tissue
Fat
3
12
15k
Mammary tumors from MMTV-Wnt-1 transgenic/P53-/- mice
WntT/p53-/-
6
9-14
8.7k
Mammary tumors from MMTV-Wnt-1 transgenic/Pten+/- mice with
LOH at the Pten locus
WntT/Pten+/-LOH
3
12-21
8.7k
LOH, loss of heterozygosity; MMTV, mouse mammary tumor virus.
Genome Biology 2005, 6:R84
/>
Genome Biology 2005,
Volume 6, Issue 10, Article R84
Huang et al. R84.3
Table 2
Numbers of genes that are differentially expressed
Tissue A (number of samples)
Number of genes differentially expressed
Tissue B (number of samples)
Total
Up
Down
WntH (7)
VMG (5)
584
121
463
WntT (23)
WntH (7)
388*
112
comment
Comparisons
276
NeuT (12)
1,296
624
672
NeuT (12)
VMG (5)
1,263*
419
844
WntT, H-ras mutant (12)
WntT, H-ras wild-type (9)
40
31
9
WntT/p53-/-
WntT (10)
113
43
70
WntT/Pten+/- LOH (3)
WntT (10)
115
45
70
reviews
WntT (23)
Expression ratio is computed by dividing the average expression level of the A group by the average expression level of the B group. The numbers of
differentially expressed genes were determined by random permutation (P < 0.001), as described in the Materials and method section. *In selected
comparisons, to reduce potential false signals due to stromal effects, the genes that were less than three-fold different in expression were filtered
out from the listed total number of genes. LOH, loss of heterozygosity.
information
Genome Biology 2005, 6:R84
interactions
A panel of 652 genes were reported to be differentially
expressed between MMTV-Neu-induced tumors and normal
virgin mammary glands in the study of Desai and coworkers
[7] using the 8.7k chips (> two-fold). In the present study
comparing 12 tumors from MMTV-Neu transgenic mice and
five nontransgenic normal virgin mammary glands using the
15k chips, 1,263 genes were differentially expressed (P <
0.001, more than three-fold; Table 2). Among these 1,263
genes, 626 genes were represented in the 8.7k arrays used by
Desai and coworkers. Of these 626 genes, 225 (35%) overlapped with the 652 genes reported to be differentially
expressed between MMTV-Neu-induced tumors and normal
virgin mammary glands in the study conducted by Desai and
colleagues. We consider this to be an acceptable level of
reproducibility, considering the multiple differences in the
generation of the two data sets (including differences in
refereed research
In an effort to identify genes that are specifically dysregulated
in tumors induced by MMTV-Wnt-1, we performed a permutation t-test (see Materials and methods, below, for details)
on these two groups of array data. In total, 1,296 genes were
differentially expressed between MMTV-Wnt-1-induced and
MMTV-Neu-induced tumors (P < 0.001; Table 2 and Additional data file 1). Among the 1,296 genes that we found to be
differentially expressed between Wnt-1-induced and Neuinduced tumors, 842 genes are represented in the 8.7k chips
used in the previous report [7]. In that study, 672 genes were
found to be differentially expressed among tumors from
MMTV-Neu, MMTV-Ha-Ras, MMTV-c-Myc, MMTV-polyoma middle T antigen, C3(1)/simian virus 40 T/t antigen,
and Wap-simian virus 40 T/t antigen transgenic mice using
the 8.7k chips. Comparing the 842 differentially expressed
It should be noted that the MMTV-Wnt-1 transgenic mice had
a mixed genetic background that was mostly FVB (>75%),
whereas MMTV-Neu transgenic mice were on a pure FVB
background. Although this small variation in genetic background between these two groups of mice is unlikely to
account for the differences in expression profiles we detected,
we cannot exclude the possibility that some of the genes identified by this analysis might be due to variation in genetic
background.
deposited research
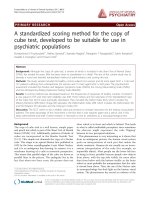
The expression profiles of these two sets of tumors were
clearly separated into two groups by unsupervised average
linkage hierarchical clustering analysis (Figure 1), suggesting
that the global expression patterns of these two sets of tumors
differ significantly. This finding extends previous reports of
significant divergence in histopathobiology, cellular composition, and possibly the cell types of origin between these two
groups of tumors [8,20,21].
genes in the present study with the 672 genes from the earlier
study, we found that 165 genes were present in both lists
(Additional data file 1), including 91 of the 178 genes (51%)
reported as the Neu-Ras-polyoma middle T antigen cluster
[7]. Examples of these 91 genes include Rap1-GTPase activating protein 1, matrix metalloproteinase 15, and CD81
(Additional data file 1).
reports
the profiles of 23 mammary tumors from MMTV-Wnt-1
transgenic mice and, for comparison, 12 mammary tumors
from mice carrying the MMTV-Neu transgene (Tables 1 and 2
provide sample information and a list of all comparisons).
Neu (ErbB2/HER2), a proto-oncogene that is amplified in
approximately 25% of human breast cancers [17], encodes a
member of the epidermal growth factor receptor family of
receptor tyrosine kinases [18]. It activates signaling pathways
different from those activated by Wnt-1, and the two oncogenes can collaborate in mammary tumorigenesis [19].
R84.4 Genome Biology 2005,
Volume 6, Issue 10, Article R84
Huang et al.
/>
t11
t9
t10
ln60
s10
s7
s2
n17
nt9
NeuT m68
NeuT m73
NeuT m53
NeuT m76
NeuT m77
NeuT m61
NeuT m56
NeuT m74
NeuT m72
NeuT m75
NeuT m78
NeuT m67
WntTW
ntT
WntT m23
WntT m8
WntT m36
WntT m25
WntT m20
WntT m22
WntT m21
WntT m26
WntT m24
WntT m38
WntT m70
WntT m69
WntT m62
WntT m47
WntT m79
WntT m65
WntT m66
WntT m80
WntT m64
WntT m71
WntT m50
WntT m49
WntT m42
nt4
WntT
(a)
Wnt T
NeuT
(b)
WntT
NeuT
Nidogen
α-tubulin
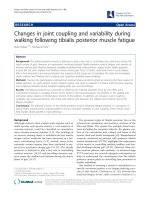
Figure 1
Gene expression in mammary tumors from MMTV-Wnt-1 versus MMTV-Neu transgenic mice
Gene expression in mammary tumors from MMTV-Wnt-1 versus MMTV-Neu transgenic mice. (a) Dendrogram of 35 mammary tumors analyzed by
average linkage hierarchical clustering analysis using 1,932 genes selected for high variability across all tumors. 15k arrays were used. The status of Ha-Ras
on MMTV-Wnt-1-induced tumors is color coded: red, wild-type; brown, mutant; green, unknown. (b) Western blot analysis for nidogen protein
expression on representative mammary tumors from MMTV-Wnt-1 and MMTV-Neu transgenic mice. MMTV, mouse mammary tumor virus; NeuT,
mammary tumors from MMTV-Neu transgenic mice; WntT, mammary tumors from MMTV-Wnt-1 transgenic mice.
reference RNAs, array prints, age of the virgin mammary
glands, and sample size).
Genes that were more highly expressed (P < 0.001) in MMTVWnt-1-induced tumors than in MMTV-Neu-induced tumors
include genes reported to be transcriptional targets of Wnt
signaling [22-26] such as cyclin D1 (2.0-fold), c-Myc (2.0-
fold), frizzled 7 (2.1-fold), and Wnt-5a (9.2-fold; Additional
data file 1). Wnt-5b, another member of the Wnt family, was
also more highly expressed (3.7-fold) in tumors from MMTVWnt-1 transgenic mice than in tumors from MMTV-Neu
transgenic mice; it remains to be determined whether this
Wnt member is also a transcriptional target of Wnt signaling.
Genome Biology 2005, 6:R84
/>
Genome Biology 2005,
Volume 6, Issue 10, Article R84
Huang et al. R84.5
comment
reviews
reports
WntT
WntT/Pten+/-LOH
WntT/p53-/-
Expression profiles are similar among mammary
tumors with additional genetic alterations in MMTVWnt-1 transgenic mice
The distinct patterns of genes expressed in MMTV-Wnt-1induced and MMTV-Neu-induced tumors described in the
preceding section suggest that initiating oncogenes strongly
influence gene expression in the tumors arising in these two
Genome Biology 2005, 6:R84
information
MMTV-Wnt-1-induced tumors contain both epithelial and
myoepithelial cells in approximately equal numbers, unlike
tumors induced by the MMTV-Neu transgene, which contain
only epithelial tumor cells [8,21,31]. Consistent with these
reports, we observed higher expression levels (P < 0.001) of
myoepithelial markers, including calponin 1 (12.5-fold) and
calponin 2 (2.5-fold and 4.0-fold for two separate clones), in
interactions
tumors from MMTV-Wnt-1 transgenic than in tumors from
MMTV-Neu transgenic mice (Additional data file 1). Consistent with earlier reports that tumors may arise from mammary
progenitor cells in MMTV-Wnt-1 transgenic mice [8,15], we
found that RNA encoding the candidate progenitor cell markers keratin 6 (13-fold), tenascin (3.1-fold), osteoblast specific
factor 2 (2.0-fold), insulin-like growth factor binding protein 7 (2.0-fold), and nidogen 1 (1.8-fold) [8,32] were more
abundant (P < 0.001) in tumors from MMTV-Wnt-1 transgenic mice. Using immunoassays, we demonstrated that keratin 6 and nidogen proteins are expressed at higher level in
MMTV-Wnt-1-induced tumors than in MMTV-Neu-induced
tumors (Figure 1b) [8].
refereed research
Retinoic acid signaling has been reported to synergize with
Wnt signaling to induce gene expression [27,28]. Retinoic
acid receptor and Stra6, a gene activated by the addition of
retinoids to cultured cells [29], have also been suggested to be
targets of Wnt signaling [27]. Consistent with these reports,
we found higher level of Stra6 (P < 0.001, 9.0-fold) in
MMTV-Wnt-1-induced tumors than in MMTV-Neu-induced
tumors. In addition, cellular retinol binding protein (RBP)1,
a gene related to retinoic acid signaling, was also more highly
expressed (P < 0.001, two-fold) in MMTV-Wnt-1-induced
tumors than in MMTV-Neu-induced tumors, which is consistent with our recent report that RBP1 is induced by β-catenin [30].
deposited research
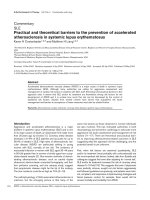
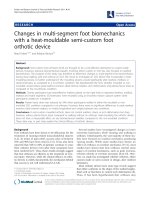
Figure 2
Multidimensional scaling analysis of 18 tumor samples of indicated genotypes
Multidimensional scaling analysis of 18 tumor samples of indicated genotypes. 8.7k arrays were used. MMTV, mouse mammary tumor virus; WntT,
mammary tumors from MMTV-Wnt-1 transgenic mice; WntT/Pten+/- loss of heterozygosity (LOH), mammary tumors from MMTV-Wnt-1 transgenic/Pten+/
- mice with Pten loss of heterozygosity; WntT/P53-/-, mammary tumors from MMTV-Wnt-1/P53-/- mice.
R84.6 Genome Biology 2005,
Volume 6, Issue 10, Article R84
Huang et al.
models. We have observed that other genetic events accelerate tumorigenesis in MMTV-Wnt-1 transgenic mice [14,33].
We next evaluated whether the events that mediate acceleration are reflected in the gene expression patterns.
We recently reported that approximately 50% of mammary
tumors in MMTV-Wnt-1 transgenic mice have activating
mutations in the Ha-Ras locus [19]. Thus, we first considered
whether tumors carrying mutant Ha-Ras have an expression
profile distinct from that observed in tumors that are wildtype at the Ha-Ras locus. We sequenced Ha-Ras cDNA to
seek mutations in 21 out of the 23 MMTV-Wnt-1-induced
tumors: 12 tumors carry Ha-Ras mutations and nine have
only Ha-Ras wild-type alleles (Figure 1a). Tumors with and
without Ha-Ras mutations did not have distinct global
expression profiles (Figure 1a). Independent multidimensional scaling (MDS) and hierarchical clustering of these 21
tumors based on expression profiles also did not separate
them according to Ha-Ras status (data not shown). Nevertheless, permutation t test identified 40 genes differentially
expressed between tumors bearing wild-type Ha-Ras and
those carrying a mutant Ha-Ras (Table 2 and Additional data
file 2). This is more than expected (P < 0.001) but many fewer
than we saw in our earlier comparison between MMTV-Wnt1-induced and MMTV-Neu-induced tumors. In addition, the
average fold difference is much smaller (Additional data file
2) than that in the earlier comparison.
We previously determined that loss of either p53 or Pten
accelerates mammary tumorigenesis in MMTV-Wnt-1 transgenic mice [34,35]. To further investigate the influence of
these genetic alterations on expression patterns in MMTVWnt-1-induced tumors, we determined the expression profiles of six tumors from MMTV-Wnt-1 transgenic mice that
were p53 null and three tumors from MMTV-Wnt-1 transgenic/Pten+/- mice that had lost the wild-type allele of Pten
(i.e. loss of heterozygosity). When genes in the 8.7k array data
set from these two groups of tumors and those from 10
tumors from MMTV-Wnt-1 transgenic mice that were otherwise wild-type were subjected to analysis by MDS or unsupervised hierarchical clustering, the three groups of samples
could not be separated from each other (Figure 2 and data not
shown). These findings suggest that the global expression
profiles of MMTV-Wnt-1 tumors carrying different additional
genetic alterations cannot be distinguished.
Permutation t test identified 113 genes that were differentially
expressed (p < 0.001) between tumors from MMTV-Wnt-1
transgenic mice and those from MMTV-Wnt-1 transgenic/
p53-/- mice (Table 2). Among the 113 genes, 43 were upregulated, and 70 were downregulated in the latter set of tumors
(Additional data file 3). Examples of the upregulated genes
are cyclin D2 (3.7-fold), Myb (2.9-fold and 2.8-fold for two
separate clones), Bcl11a (1.5-fold), and Pbx3 (1.8-fold average), which promote proliferation or survival. Examples of
the downregulated genes are CD59a antigen (two-fold), a
/>
potential p53 target [36], the Rb1 tumor suppressor gene, and
the Met proto-oncogene. Using similar analyses, we found
that 115 genes were differentially expressed (P < 0.001)
between tumors from MMTV-Wnt-1 transgenic mice and
those from MMTV-Wnt-1/Pten+/- mice with Pten loss of heterozygosity (Table 2). Forty-five were upregulated, and 70 of
them were downregulated in the latter set of tumors (Additional data file 4). Interestingly, among the downregulated
genes is tensin (two-fold), a cell adhesion molecule that is
related to Pten. Similar to the comparison between Ha-Ras
mutant and Ha-Ras wild-type tumors in MMTV-Wnt-1 transgenic mice, the number of genes differentially expressed and
the average fold difference were much smaller in the above
two comparisons than in the comparison between MMTVWnt-1-induced and MMTV-Neu-induced tumors (Additional
data files 1, 3, and 4).
Collectively, these findings suggest that tumors from MMTVWnt-1 transgenic mice are similar to each other in their global
expression profiles, regardless of whether the tumors have
additional genetic alterations. It is not known whether the
modest differences in RNA levels we identified among these
groups of tumors explain the accelerating effects of these
alterations on tumorigenesis in MMTV-Wnt-1 transgenic
mice. We plan to test some of these changes by expressing
cDNAs in mammary glands in Wnt-1 transgenic mice using
TVA-mediated somatic gene transfer technology [37].
Distinct changes in gene expression accompany the
evolution from normal mammary glands to
hyperplasias and to tumors in MMTV-Wnt-1 transgenic
mice
Hyperplastic lesions are widespread in MMTV-Wnt-1 transgenic mice before the development of mammary tumors [14].
To determine whether unique gene expression patterns
accompany the evolution from normal mammary cells to
hyperplasias and then to tumors, we compared expression
profiles among mammary glands of nontransgenic virgin
mice, hyperplastic mammary glands, and mammary tumors
from MMTV-Wnt-1 transgenic mice. Unsupervised
hierarchical clustering analysis and MDS showed that expression profiles from these three groups of tissues were separated from each other (Figure 3a and data not shown). The
difference between hyperplastic and normal glands is
unlikely to be due to decreased contribution of stromal RNA
in the preparation of RNAs from the hyperplastic glands from
MMTV-Wnt-1 transgenic mice, because the expression levels
of epithelial and myoepithelial marker genes (keratin 19, calponin 1, and calponin 2) were not significantly statistically
different between hyperplastic mammary glands from
MMTV-Wnt-1 transgenic mice and mammary glands from
age-matched nontransgenic virgins.
In total, 584 genes were differentially expressed (P < 0.001,
Table 1) between hyperplastic mammary glands from MMTVWnt-1 transgenic mice and normal mammary glands from
Genome Biology 2005, 6:R84
In total, 1,372 genes were differentially expressed (P < 0.001)
between tumors and hyperplastic glands from MMTV-Wnt-1
transgenic mice. Among them, expression levels for 388 differed by at least three-fold (Additional data file 7). This subgroup is likely to contain genes that are important for the
evolution of hyperplastic lesions into tumors, including genes
that are required for tumor cell proliferation and survival.
One such candidate is c-Kit, a proto-oncogene that is frequently overexpressed in cancers and that encodes a receptor
that activates both Ras and Akt pathways. The expression of
c-Kit was 3.6-fold higher in tumors than in hyperplastic
lesions (Additional data file 7), although it was similarly
expressed in normal virgin glands and hyperplastic mammary glands from MMTV-Wnt-1 transgenic mice. This is consistent with a recent report that c-Kit is highly expressed in
the basal group of human breast tumors compared to other
groups [38]. Using immunohistochemical staining, c-Kit protein was barely detectable in normal mammary glands from
nontransgenic mice and in hyperplastic mammary glands
from MMTV-Wnt-1 transgenic mice, but was readily and
widely detected in the tumor samples from MMTV-Wnt-1
transgenic mice (Figure 3b).
information
Genome Biology 2005, 6:R84
interactions
Figure 3 (see following page) tumor evolution in MMTV-Wnt-1 transgenic mice
Gene expression in mammary
Gene expression in mammary tumor evolution in MMTV-Wnt-1 transgenic mice. (a) Dendrogram of 35 samples analyzed by average linkage hierarchical
clustering analysis, using 3,359 genes selected for high variability across all samples. 15k arrays were used. (b) Immunohistochemical staining for c-Kit in
the indicated tissue sections. A 20× objective was used. MMTV, mouse mammary tumor virus; VMG, virgin mammary glands from nontransgenic mice;
WntT, mammary tumors from MMTV-Wnt-1 transgenic mice; WntH, hyperplastic mammary glands from MMTV-Wnt-1 transgenic mice.
refereed research
Some of the genes that were differentially expressed between
mammary tumors and hyperplastic glands in MMTV-Wnt-1
transgenic mice may be needed for evolution of tumors
induced by both Wnt-1 and other oncogenes. Other genes
may be uniquely important for induction of tumors from
hyperplastic glands in MMTV-Wnt-1 transgenic mice. For
example, certain signaling pathways may need to be activated
in hyperplastic cells in MMTV-Wnt-1 transgenic mice before
a tumor will form, but they may be optional for tumorigenesis
initiated by other oncogenes. To discover genes that might be
uniquely important for tumors to develop in hyperplastic
glands in MMTV-Wnt-1 transgenic mice, we compared the
388 genes that we found to be differentially expressed
between tumors and hyperplastic glands from MMTV-Wnt-1
transgenic mice with the 1,296 genes that we found to be differentially expressed between tumors from MMTV-Wnt-1
transgenic and MMTV-Neu transgenic mice. Fifty-six genes
corresponding to 59 cDNA clones in the former group were
shared in the latter group (Table 3), suggesting they might be
specifically involved in neoplastic progression in MMTVWnt-1 transgenic mice. Among these 56 genes, 23 were more
highly expressed and 33 were expressed at lower level in
MMTV-Wnt-1-induced tumors than in either MMTV-Wnt-1induced hyperplasia or MMTV-Neu-induced tumors (Table
3). The upregulated genes (P < 0.001) include TNFRSF19
(3.5-fold), NGFR (3.6-fold), apolipoprotein D (4.7-fold), and
deposited research
Based on the above calculation, approximately 62% of the
RNAs from hyerplastic mammary glands might come from
adipocyte-rich stroma. Thus, tumor samples, which have very
little contribution from adipocytes, may appear to have
downregulated the genes that are associated with adipocytes.
In order to identify these genes, we compared the expression
profiles of a set of three fat samples with those of the 35 mammary tumors from MMTV-Wnt-1 and MMTV-Neu transgenic
mice. Expression of 741 genes was at least three-fold or higher
(P < 0.001) in fat than in the mammary tumors (Table 2 and
Additional data file 6). These include published fat-specific
genes (Additional data file 6), such as fat-specific gene 27,
lipoprotein lipase, CD36, carbonic anhydrases, and solute
carrier family members [7]. We note these genes in our table
comparing hyperplastic mammary glands with tumors (Additional data file 7).
Huang et al. R84.7
reports
nontransgenic littermates. Among these 584 genes, 121 were
more highly expressed in the hyperplastic glands (Additional
data file 5), which includes some of the known transcriptional
targets of Wnt signaling such as c-Myc (3.6-fold) and frizzled
7 (2.1-fold). This list may therefore provide an important
starting point for confirming mammary-specific target genes
and for discovering novel in vivo targets of Wnt signaling. In
fact, two genes in this list, namely RBP1 (2.9-fold) and tumorassociated calcium signal transducer (3.5-fold), were shown
to be upregulated by β-catenin in 293 cells in our recent studies [30].
One of the greatest challenges in identifying specific genes
and expression patterns associated with the evolution from
hyperplastic glands to tumors is the change in cellular composition. Normal and MMTV-Wnt-1-induced hyerplastic ductal
trees are embedded in stroma, but tumors often contain much
less stroma. Thus, the differential contribution of RNA from
the stromal cells may skew array analysis, which is based on
total RNA content. However, stromal cells are mostly large
adipocytes whose RNA to mass ratio is small; thus, the relative contribution of RNA from these cells is probably much
less than it appears to be from histologic assessment. The
average expression level of epithelial and myoepithelial
markers (keratin 19, calponin 1, and calponin 2) was 2.6-fold
higher in the tumors (which contain very few stromal cells)
than in the hyperplastic tissues, suggesting that 38% (1/2.6 =
38%) of the RNA in the hyperplastic tissues might come from
the ducts and alveoli. Thus, to eliminate genes that were not
truly differentially expressed, we filtered out any genes that
were less than three-fold different in our comparison between
tumors and hyperplastic glands in Table 2.
Volume 6, Issue 10, Article R84
reviews
Genome Biology 2005,
comment
/>
VMG m13
VMG m27
VMG m29
VMG m28
VMG m17
WntH m9
WntH m10
WntH m7
WntH m15
WntH m11
WntH m14
WntH m5
WntT m49
WntT m42
WntT m70
WntT m47
WntT m79
WntT m50
WntT m71
WntT m69
WntT m64
WntT m80
WntT m65
WntT m66
WntT m62
WntT m23
WntT m8
WntT m24
WntT m20
WntT m36
WntT m26
WntT m25
WntT m22
WntT m21
WntT m38
R84.8 Genome Biology 2005,
VMG
Volume 6, Issue 10, Article R84
VMG
Huang et al.
WntH
WntH
Figure 3 (see legend on previous page)
Genome Biology 2005, 6:R84
/>
(a)
WntT
(b)
WntT
/>
Genome Biology 2005,
Volume 6, Issue 10, Article R84
Huang et al. R84.9
Table 3
List of genes potentially specifically involved in neoplastic progression in MMTV-Wnt-1 transgenic mice
Image ID Gene name
Symbol
WntH/V
WntT/WntH
WntT/NeuT
Tumor necrosis factor receptor superfamily, member 19
Tnfrsf19
2.56
3.48
6.23
Retinol binding protein 1, cellular
Rbp1
2.93
3.02
1.96
572428
Cell cycle cyclin D1 Mm.35804 Cyclin D1
Ccnd1
=
5.53
1.97
536306
Hormone/GF growth/diff 1 Mm.22621 Procollagen type I α1
Col1a1
=
3.04
3.27
=
8.8
5.95
=
3.74
3.96
536526
ESTs
329780
Cadherin 3
Cdh3
427360
Mus musculus, clone IMAGE:3590270, mRNA, partial cds
LOC192176
638805
Expressed sequence AI504637
355990
Chondroitin sulfate proteoglycan 2
574500
ESTs
476431
Nerve growth factor receptor
680894
Glial cell line derived neurotrophic factor family receptor α1
482943
Odd-skipped related 1 (Drosophila)
Osr1
695687
Calponin 2
Cnn2
335572
Dihydropyrimidinase-like 3
621246
Interferon concensus sequence binding protein
482170
Four jointed box 1 (Drosophila)
3.5
2.44
3.3
2.27
=
3.62
5.05
=
4.13
1.65
Ngfr
=
3.61
6.34
Gfra1
=
4.74
4.05
=
4.1
3.65
=
3.49
2.54
=
3.27
7.61
Icsbp
=
3.38
4.91
Fjx1
=
4.13
3.78
Cspg2
Il17b
=
4.27
5.37
Tumor-associated calcium signal transducer 2
Tacstd2
=
4.16
3.69
479405
ESTs
=
3.01
4.95
722262
Wingless-related MMTV integration site 5A
Wnt5a
=
4.44
9.23
719592
GATA binding protein 2
Gata2
=
6.06
10.54
1247541
Apolipoprotein D
Apod
=
4.67
3.86
331186
Caveolin, caveolae protein, 22 kDa
Cav1
0.31
0.29
3.67
596968
Caveolin, caveolae protein, 22 kDa
Cav1
0.3
0.31
3.05
948509
Caveolin, caveolae protein, 22 kDa
Cav1
0.52
0.18
3
386555
CD36 antigen
Cd36
0.21
0.06
0.08
832585
ESTs
0.21
0.06
0.21
620819
transcription elongation factor A (SII) 1
0.24
0.07
0.25
831701
ESTs
0.2
0.09
0.25
775253
ESTs
0.16
0.07
0.22
AI158848
Unknown
493675
Riken cDNA 2700018N07 gene
0.24
571367
Riken cDNA 2410012F02 gene
463388
Epoxide hydrolase 2, cytoplasmic
374030
EST
1067881
Fc receptor, IgG, low affinity III
474184
Expressed sequence AW554339
579349
Expressed sequence AI593221
2410127E18Rik
874232
Riken cDNA 1110025G12 gene
1110025G12Rik
0.21
0.11
0.27
0.3
0.11
0.41
0.11
0.33
0.36
0.16
0.26
0.3
Fcgr3
0.21
0.1
0.25
Ephx2
0.06
0.18
0.24
Scd1
0.15
0.33
0.29
0.18
0.23
0.33
0.19
0.56
Expressed sequence AI315208
AI315208
=
0.2
0.16
1399595
Riken cDNA 2810422B09 gene
1810061M12Rik
0.3
0.18
0.4
737745
ESTs
0.34
0.17
0.37
0.62
876063
BCL2/adenovirus E1B 19 kDa-interacting protein 1, NIP3
Bnip3
0.38
0.27
850642
Epoxide hydrolase 2, cytoplasmic
Ephx2
0.18
0.22
0.44
1248105
Expressed sequence AI595343
AI595343
0.42
0.21
0.37
330661
Mus musculus golli-interacting protein mRNA, complete cds
Nif3
0.66
0.21
0.22
Genome Biology 2005, 6:R84
information
891453
interactions
334182
refereed research
IL-17b
373716
deposited research
468019
reports
=
=
reviews
474107
406897
comment
Expression ratio
R84.10 Genome Biology 2005,
Volume 6, Issue 10, Article R84
Huang et al.
/>
Table 3 (Continued)
List of genes potentially specifically involved in neoplastic progression in MMTV-Wnt-1 transgenic mice
1349720
Apoptosis NIP3, Bcl-2-binding protein homolog (Nip3) mRNA
Bnip3
0.37
0.29
0.52
1067414
Expressed sequence AI413399
1110001E17Rik
=
0.24
0.52
832584
ESTs, Weakly similar to STHM MOUSE STATHMIN [M. musculus]
0.31
0.21
0.46
876369
Amyotrophic lateral sclerosis 2 (juvenile) homolog (human)
Als2
0.41
0.29
0.39
764542
ESTs, Weakly similar to GPRY_mouse probable G protein-coupled
receptor GPR34 [M. musculus]
Gpr43
0.49
0.24
0.43
1248075
Transcription factor 1
Tcf1
949592
ESTs, Moderately similar to hypothetical protein [H. sapiens]
1195295
Actinin α3
820307
0.29
0.31
0.36
=
0.32
0.22
Actn3
=
0.29
0.43
A kinase (PRKA) anchor protein (gravin) 12
Akap12
=
0.31
0.08
864409
Riken cDNA 1200013I08 gene
1200013I08Rik
0.47
0.33
0.39
947659
Riken cDNA 2310016E22 gene
2310016E22Rik
=
0.33
0.37
1396547
Myosin binding protein H
=
0.25
0.45
This list displays genes that are differentially expressed between mammary tumors (WntT) and hyperplastic mammary gland (WntH) from MMTVWnt-1 transgenic mice, and that are also differentially expressed between WntT and mammary tumors from MMTV-Neu transgenic mice (NeuT).
Genes are sorted according to the average ratio of WntT versus WntH. A numeric ratio is displayed if the gene expression meets the criteria
(statistical significance and fold cutoff) described in Table 2; otherwise, it is marked as '=', indicating that there is no significant difference between the
two sets of samples in comparison. EST, expressed sequence tag; MMTV, mouse mammary tumor virus.
Wnt5a (4.4-fold), and the downregulated genes (P < 0.001)
include BNIP3 (2.5-fold) and caveolin (2-, 3.3-, and 3.3-fold
for three separate clones). Of note, apolipoprotein D has been
reported to be upregulated in a subset of human breast cancers [39], and caveolin 1, a negative regulator of the Ras-p42/
p44 mitogen-activated protein kinase cascade, has been
reported to inhibit growth in human breast cancer cells [40].
are Riken cDNAs. The 15k slides contain the 8700 Incyte
GEM1 clone set and the mammary 6000 clone set; a total of
1,444 clones do not map to a Unigene cluster ID, whereas the
rest of the clones map to 10,062 unique genes as defined by
Unigene cluster ID. Among the 10,062 Unigene clusters,
3,750 are named genes, 3,922 are expressed sequence taqs,
and 2,390 are Riken cDNAs.
Sample information
Conclusion
Our analysis of different stages of tumorigenesis in mouse
models identified changes in gene expression accompanying
tumor initiation and evolution. We also extended the report
by Desai and coworkers [7] that the initiating oncogene determines the expression profiles of primary mammary tumors.
In addition, we observed that the tumors from MMTV-Wnt-1
transgenic mice are similar to each other in their global
expression profiles, regardless of whether the tumors have
additional genetic alterations. These data may be useful for
elucidation of oncogenic signaling pathways in breast cancer
initiation and evolution.
Materials and methods
All nontransgenic and MMTV-Neu transgenic animals used
in this study were on the FVB background. All MMTV-Wnt-1
transgenic mice [14] were a mixture of FVB (>75%), SJL, and
C57BL/6 strains. MMTV-Neu transgenic mice [41] were purchased from Jackson Laboratories (Bar Harbor, ME, USA).
This transgenic line carries a rat cDNA encoding the wild-type
Neu protein. Fat tissues were collected from intestinal fat in
virgin FVB mice. All samples were collected fresh and snapfrozen in liquid nitrogen. RNA was extracted by Trizol (Invitorgen, Carlsbad, CA, USA). Reference RNA was a mixture of
ovarian RNA (Ambion, Austin, TX, USA; Cat number 7824)
and RNA extracted from tissues of liver, spleen, kidney,
thymus, pancreas, lung, and normal lactating mammary
gland of FVB mice of 6 months of age. All reference RNA used
in this study is from a single preparation.
cDNA microarray slides
The mouse 15k slides and 8.7k slides used in this study were
arrayed at the National Cancer Institute microarray facility.
All slides of each array type were printed in a single batch. The
8.7k slides contain the 8700 Incyte GEM1 clone set, which are
mapped to 6,877 Unigene cluster IDs, among which 2,953 are
named genes, 2,206 are expressed sequence tags, and 1,628
cDNA microarray hybridization and data extraction
The cDNA probes were prepared from a total of 35-50 µg reference RNA and 50-75 µg sample RNA from normal, hyperplastic, or tumor tissues, as described [42,43]. The cDNA
from reference RNA was labeled with cyanine 3-dUTP, and
that from sample RNA was labeled with cyanine 5-dUTP. Flu-
Genome Biology 2005, 6:R84
orescent images of hybridized microarrays were obtained by
using a GenePix 4000 scanner (Axon Instruments, Foster
City, CA, USA). Microarray images were analyzed using the
ArraySuite software [44,45] based on the Scanalytics IPlab
platform (Scanalytics, Fairfax, VA, USA). For each cDNA
probe location, fluorescence intensity ratio and its associated
measurement quality (q) were calculated. The evaluation of
measurement quality is based on spot size, signal to noise
ratio, background uniformity, and saturation pixel percentage [45]. The range of measurement quality is from 1.0 to 0,
with higher measurements reflecting better quality. Areas of
the array with obvious blemishes were automatically given a
low quality value.
histochemistry, the sections were boiled for 15 minutes in 10
mmol/l citrate buffer of pH 6.0 (to unmask antigen epitopes).
Endogenous peroxidase activity was inactivated by 10 minute
incubation in 3% hydrogen peroxide, and subsequent steps
were performed using Vector ABC kits and the Nova-Red substrate (Vector Laboratories, Burlingame, CA, USA) following
the manufacturer's recommendations.
Statistical analysis of cDNA microarray data
Huang et al. R84.11
For Western blotting, tumors were ground to powder in liquid
nitrogen and lysed in the M-PER tissue lysis solution (Pierce,
Rockford, IL, USA) with gentle shaking overnight at 4°C. Proteins in resulting supernatant (25 µg protein) were denatured
using 2-mercaptoethanol, resolved on 10% polyacrylamide
mini-gels containing 10% sodium dodecyl sulfate, and transferred to nitrocellulose membranes. The membranes were
then incubated with primary antibodies and peroxidase-conjugated secondary antibodies (Jackson Laboratories) in trisborate buffer (1 mmol/l Tris and 13.7 mmol/l NaCl, pH 7.6)/
0.05% Tween 20/5% nonfat dried milk. Proteins recognized
by specific antibodies were visualized using a chemiluminescent substrate (Supersignal; Pierce).
reports
Normalized log test to reference ratios and their corresponding quality measurements in each experiment were calculated
as described previously [45]. A gene was excluded from further analyses (see below for description) if the average quality
measurement was under 0.5 across samples in that specific
comparison. Approximately 14,000 genes are suitable for
analyzing on the 15k chips and 8,000 genes on the 8.7k chips.
Volume 6, Issue 10, Article R84
reviews
Genome Biology 2005,
comment
/>
Accession number
Additional data files
tumors listing fileandexpressed tumors and loss MMTV-Wnt-1
A table from hyperplastic mammary glands from of heterozygosity
Additionaltumors in differentiallymice micehyperplastic mammary
at thehere forMMTV-Wnt-1transgenic in MMTV-Wnt-1 mice mice
transgenic Filetransgenic/Pten three-fold transgenic/Ptentissues
than fromMMTV-Wnt-1 and MMMTV-Wnt-1 and tumors
glandsPten mice5 tumors from+/- in p53-wild-type background
mary glandsHa-Ras p53-nullfromexpressed transgenic mice from
Click in mammary nontransgenicMMTV-Neubetween MMTV-WntMMTV-Wnt-1 genes wild-typeandmice with higher inMMTV-Neu
mutant andlocus
1-induced from
7
6
2
4
3
1
tumors
Wnt-1 or
virgin mammammary
Ha-Ras
fat +/+
Antibodies used include rabbit IgG directed against nidogen
and c-Kit (Santa Cruz, CA, USA). Tissues were fixed in 10%
neutral formalin and processed as previously described [34]
to obtain paraffin sections of 4 µm in thickness. For immuno-
Acknowledgements
We thank Patrick O Brown, Michael B Eisen, Vishy Iyer, Nick Socci, Larry
Donehower, Xinbin Chen, and Alfonso Bellacosa for advice and members
of the Varmus laboratory for helpful discussion. We thank Xiaomei Zhang
for immunohistochemical staining and Gary Chamness for assistance in the
Genome Biology 2005, 6:R84
information
Western blot analysis and immunohistochemical
staining
interactions
The following additional data are available with the online
version of this article: a table listing genes differentially
expressed between mammary tumors from MMTV-Wnt-1
and MMTV-Neu transgenic mice (Additional data file 1); a
table listing genes differentially expressed between Ha-Ras
mutant and Ha-Ras wild-type tumors in MMTV-Wnt-1 mice
(Additional data file 2); a table listing genes differentially
expressed between MMTV-Wnt-1-induced tumors in p53null and in p53-wild-type background (Additional data file 3);
a table listing genes differentially expressed between tumors
from MMTV-Wnt-1 transgenic/Pten+/- mice with loss of heterozygosity at the Pten locus and tumors from Wnt-1 transgenic/Pten+/+ mice (Additional data file 4); a table listing
genes differentially expressed between virgin mammary
glands from nontransgenic mice and hyperplastic mammary
glands from MMTV-Wnt-1 transgenic mice (Additional data
file 5); a table listing genes expressed three-fold or higher in
fat tissues than in mammary tumors from MMMTV-Wnt-1
and MMTV-Neu transgenic mice (Additional data file 6); and
a table listing genes differentially expressed between mammary tumors and hyperplastic mammary glands from
MMTV-Wnt-1 transgenic mice (Additional data file 7).
refereed research
A permutation t-test was used to select genes significantly differentially expressed between any two groups [47]. Here, a
standard t-statistic was computed between two groups on the
log-transformed ratios of each gene. The group labels were
randomly permuted and the t-statistic for each gene in the
permuted data set was calculated. The process was repeated
10,000 times. A P value was reported for each gene by comparing the observed statistic with the permutation statistics.
To control for multiple comparisons, only genes with P values
less than 0.001 were considered differentially expressed. The
distribution of the significant differences expected by chance
and the probability of observing as many or more differentially expressed genes were calculated from the permuted
data. This latter probability is the P value reported in the
Results and discussion section.
The GEO accession number for the series of array data-sets is
GSE2860.
deposited research
Two methods were used to visualize the expression patterns
among samples. Both used the Pearson correlation as a similarity measure. In average linkage hierarchical clustering, the
distances between samples are represented on a tree called a
dendrogram. In MDS, samples with similar expression ratios
were placed closer to each other in three dimensional space.
Average linkage hierarchical clustering analysis was implemented using the CLUSTER program, and the results were
displayed using TREEVIEW [46]. MDS was developed in the
MATLAB (Natick, MA, USA) environment.
R84.12 Genome Biology 2005,
Volume 6, Issue 10, Article R84
Huang et al.
preparation of this manuscript. We thank Raju Chaganti for providing
access to the scanner and Veronique Bourdon for assistance in its use. S.H.
was supported by Department of Defense Breast Cancer Research Program awards. This work was supported in part by a National Institutes of
Health Grant P01 CA94060-02 (to H.E.V.) and funds from the Martell
Foundation (to H.E.V.) and Department of Defense (USAMRMC)
BC030755 (to Y.L.).
2.
3.
4.
5.
6.
7.
8.
9.
10.
11.
12.
13.
14.
15.
16.
17.
18.
19.
20.
21.
22.
23.
References
1.
/>
Fuller AP, Palmer-Toy D, Erlander MG, Sgroi DC: Laser capture
microdissection and advanced molecular analysis of human
breast cancer. J Mammary Gland Biol Neoplasia 2003, 8:335-345.
Perez EA, Pusztai L, Van de Vijver M: Improving patient care
through molecular diagnostics. Semin Oncol 2004, 31(5 Suppl
10):14-20.
Ma XJ, Salunga R, Tuggle JT, Gaudet J, Enright E, McQuary P, Payette
T, Pistone M, Stecker K, Zhang BM, et al.: Gene expression profiles
of human breast cancer progression. Proc Natl Acad Sci USA
2003, 100:5974-5979.
Porter D, Lahti-Domenici J, Keshaviah A, Bae YK, Argani P, Marks J,
Richardson A, Cooper A, Strausberg R, Riggins GJ, et al.: Molecular
markers in ductal carcinoma in situ of the breast. Mol Cancer
Res 2003, 1:362-375.
Porter DA, Krop IE, Nasser S, Sgroi D, Kaelin CM, Marks JR, Riggins
G, Polyak K: A SAGE (serial analysis of gene expression) view
of breast tumor progression. Cancer Res 2001, 61:5697-5702.
Hu Y, Sun H, Drake J, Kittrell F, Abba MC, Deng L, Gaddis S, Sahin A,
Baggerly K, Medina D, Aldaz CM: From mice to humans: identification of commonly deregulated genes in mammary cancer via comparative SAGE studies.
Cancer Res 2004,
64:7748-7755.
Desai KV, Xiao N, Wang W, Gangi L, Greene J, Powell JI, Dickson R,
Furth P, Hunter K, Kucherlapati R, et al.: Initiating oncogenic
event determines gene-expression patterns of human breast
cancer models. Proc Natl Acad Sci USA 2002, 99:6967-6972.
Li Y, Welm B, Podsypanina K, Huang S, Chamorro M, Zhang X, Rowlands T, Egeblad M, Cowin P, Werb Z, et al.: Evidence that transgenes encoding components of the Wnt signaling pathway
preferentially induce mammary cancers from progenitor
cells. Proc Natl Acad Sci USA 2003, 100:15853-15858.
Nusse R, Varmus HE: Many tumors induced by the mouse
mammary tumor virus contain a provirus integrated in the
same region of the host genome. Cell 1982, 31:99-109.
Nusse R, Varmus HE: Wnt genes. Cell 1992, 69:1073-1087.
Brennan KR, Brown AM: Wnt proteins in mammary development and cancer. J Mammary Gland Biol Neoplasia 2004, 9:119-131.
Hatsell S, Rowlands T, Hiremath M, Cowin P: Beta-catenin and
Tcfs in mammary development and cancer. J Mammary Gland
Biol Neoplasia 2003, 8:145-158.
Nelson WJ, Nusse R: Convergence of Wnt, beta-catenin, and
cadherin pathways. Science 2004, 303:1483-1487.
Tsukamoto AS, Grosschedl R, Guzman RC, Parslow T, Varmus HE:
Expression of the int-1 gene in transgenic mice is associated
with mammary gland hyperplasia and adenocarcinomas in
male and female mice. Cell 1988, 55:619-625.
Liu BY, McDermott SP, Khwaja SS, Alexander CM: The transforming activity of Wnt effectors correlates with their ability to
induce the accumulation of mammary progenitor cells. Proc
Natl Acad Sci USA 2004, 101:4158-4163.
Smalley M, Ashworth A: Stem cells and breast cancer: a field in
transit. Nat Rev Cancer 2003, 3:832-844.
Slamon DJ, Clark GM, Wong SG, Levin WJ, Ullrich A, McGuire WL:
Human breast cancer: correlation of relapse and survival
with amplification of the HER-2/neu oncogene. Science 1987,
235:177-182.
Olayioye MA, Neve RM, Lane HA, Hynes NE: The ErbB signaling
network: receptor heterodimerization in development and
cancer. EMBO J 2000, 19:3159-3167.
Podsypanina K, Li Y, Varmus H: Evolution of somatic mutations
in mammary tumors in transgenic mice is influenced by the
inherited genotype. BMC Med 2004, 2:24.
Cardiff RD, Anver MR, Gusterson BA, Hennighausen L, Jensen RA,
Merino MJ, Rehm S, Russo J, Tavassoli FA, Wakefield LM, et al.: The
mammary pathology of genetically engineered mice: the
consensus report and recommendations from the Annapolis
24.
25.
26.
27.
28.
29.
30.
31.
32.
33.
34.
35.
36.
37.
38.
39.
40.
41.
meeting. Oncogene 2000, 19:968-988.
Rosner A, Miyoshi K, Landesman-Bollag E, Xu X, Seldin DC, Moser
AR, MacLeod CL, Shyamala G, Gillgrass AE, Cardiff RD: Pathway
pathology: histological differences between ErbB/Ras and
Wnt pathway transgenic mammary tumors. Am J Pathol 2002,
161:1087-1097.
He TC, Sparks AB, Rago C, Hermeking H, Zawel L, da Costa LT,
Morin PJ, Vogelstein B, Kinzler KW: Identification of c-MYC as a
target of the APC pathway. Science 1998, 281:1509-1512.
Tetsu O, McCormick F: Beta-catenin regulates expression of
cyclin D1 in colon carcinoma cells. Nature 1999, 398:422-426.
Shtutman M, Zhurinsky J, Simcha I, Albanese C, D'Amico M, Pestell R,
Ben-Ze'ev A: The cyclin D1 gene is a target of the beta-catenin/LEF-1 pathway. Proc Natl Acad Sci USA 1999, 96:5522-5527.
Michaelson JS, Leder P: Beta-catenin is a downstream effector
of Wnt-mediated tumorigenesis in the mammary gland.
Oncogene 2001, 20:5093-5099.
Willert J, Epping M, Pollack JR, Brown PO, Nusse R: A transcriptional response to Wnt protein in human embryonic carcinoma cells. BMC Dev Biol 2002, 2:8.
Szeto W, Jiang W, Tice DA, Rubinfeld B, Hollingshead PG, Fong SE,
Dugger DL, Pham T, Yansura DG, Wong TA, et al.: Overexpression
of the retinoic acid-responsive gene Stra6 in human cancers
and its synergistic induction by Wnt-1 and retinoic acid. Cancer Res 2001, 61:4197-4205.
Tice DA, Szeto W, Soloviev I, Rubinfeld B, Fong SE, Dugger DL,
Winer J, Williams PM, Wieand D, Smith V, et al.: Synergistic induction of tumor antigens by Wnt-1 signaling and retinoic acid
revealed by gene expression profiling. J Biol Chem 2002,
277:14329-14335.
Bouillet P, Sapin V, Chazaud C, Messaddeq N, Decimo D, Dolle P,
Chambon P: Developmental expression pattern of Stra6, a
retinoic acid-responsive gene encoding a new type of membrane protein. Mech Dev 1997, 63:173-186.
Chamorro MN, Schwartz DR, Vonica A, Brivanlou AH, Cho KR, Varmus HE: FGF-20 and DKK1 are transcriptional targets of
beta-catenin and FGF-20 is implicated in cancer and
development. EMBO J 2005, 24:73-84.
Cui XS, Donehower LA: Differential gene expression in mouse
mammary adenocarcinomas in the presence and absence of
wild type p53. Oncogene 2000, 19:5988-5996.
Dontu G, Abdallah WM, Foley JM, Jackson KW, Clarke MF, Kawamura MJ, Wicha MS: In vitro propagation and transcriptional
profiling of human mammary stem/progenitor cells. Genes
Dev 2003, 17:1253-1270.
Li Y, Hively WP, Varmus HE: Use of MMTV-Wnt-1 transgenic
mice for studying the genetic basis of breast cancer. Oncogene
2000, 19:1002-1009.
Li Y, Podsypanina K, Liu X, Crane A, Tan LK, Parsons R, Varmus HE:
Deficiency of Pten accelerates mammary oncogenesis in
MMTV-Wnt-1 transgenic mice. BMC Mol Biol 2001, 2:2.
Donehower LA, Godley LA, Aldaz CM, Pyle R, Shi YP, Pinkel D, Gray
J, Bradley A, Medina D, Varmus HE: Deficiency of p53 accelerates
mammary tumorigenesis in Wnt-1 transgenic mice and promotes chromosomal instability. Genes Dev 1995, 9:882-895.
Gazouli M, Kokotas S, Zoumpourlis V, Zacharatos P, Mariatos G,
Kletsas D, Perunovic B, Athanasiou A, Kittas C, Gorgoulis V: The
complement inhibitor CD59 and the lymphocyte functionassociated antigen-3 (LFA-3, CD58) genes possess functional
binding sites for the p53 tumor suppressor protein. Anticancer
Res 2002, 22:4237-4241.
Fisher GH, Orsulic S, Holland E, Hively WP, Li Y, Lewis BC, Williams
BO, Varmus HE: Development of a flexible and specific gene
delivery system for production of murine tumor models.
Oncogene 1999, 18:5253-5260.
Sotiriou C, Neo SY, McShane LM, Korn EL, Long PM, Jazaeri A, Martiat P, Fox SB, Harris AL, Liu ET: Breast cancer classification and
prognosis based on gene expression profiles from a population-based study. Proc Natl Acad Sci USA 2003, 100:10393-10398.
Sgroi DC, Teng S, Robinson G, LeVangie R, Hudson JR Jr, Elkahloun
AG: In vivo gene expression profile analysis of human breast
cancer progression. Cancer Res 1999, 59:5656-5661.
Lee SW, Reimer CL, Oh P, Campbell DB, Schnitzer JE: Tumor cell
growth inhibition by caveolin re-expression in human breast
cancer cells. Oncogene 1998, 16:1391-1397.
Guy CT, Webster MA, Schaller M, Parsons TJ, Cardiff RD, Muller WJ:
Expression of the neu protooncogene in the mammary epithelium of transgenic mice induces metastatic disease. Proc
Genome Biology 2005, 6:R84
/>
42.
44.
45.
46.
Huang et al. R84.13
reviews
47.
Natl Acad Sci USA 1992, 89:10578-10582.
DeRisi JL, Iyer VR, Brown PO: Exploring the metabolic and
genetic control of gene expression on a genomic scale. Science 1997, 278:680-686.
Guo QM, Malek RL, Kim S, Chiao C, He M, Ruffy M, Sanka K, Lee NH,
Dang CV, Liu ET: Identification of c-myc responsive genes
using rat cDNA microarray. Cancer Res 2000, 60:5922-5928.
Chen Y, Dougherty ER, Bittner ML: Ratio-based decusuibs abd
quantitative analysis of cDNA microarray images. J Biomed
Opt 1997, 2:364-374.
Chen Y, Kamat V, Dougherty ER, Bittner ML, Meltzer PS, Trent JM:
Ratio statistics of gene expression levels and applications to
microarray data analysis. Bioinformatics 2002, 18:1207-1215.
Eisen MB, Spellman PT, Brown PO, Botstein D: Cluster analysis
and display of genome-wide expression patterns. Proc Natl
Acad Sci USA 1998, 95:14863-14868.
Hedenfalk I, Duggan D, Chen Y, Radmacher M, Bittner M, Simon R,
Meltzer P, Gusterson B, Esteller M, Kallioniemi OP, et al.: Geneexpression profiles in hereditary breast cancer. N Engl J Med
2001, 344:539-548.
Volume 6, Issue 10, Article R84
comment
43.
Genome Biology 2005,
reports
deposited research
refereed research
interactions
information
Genome Biology 2005, 6:R84